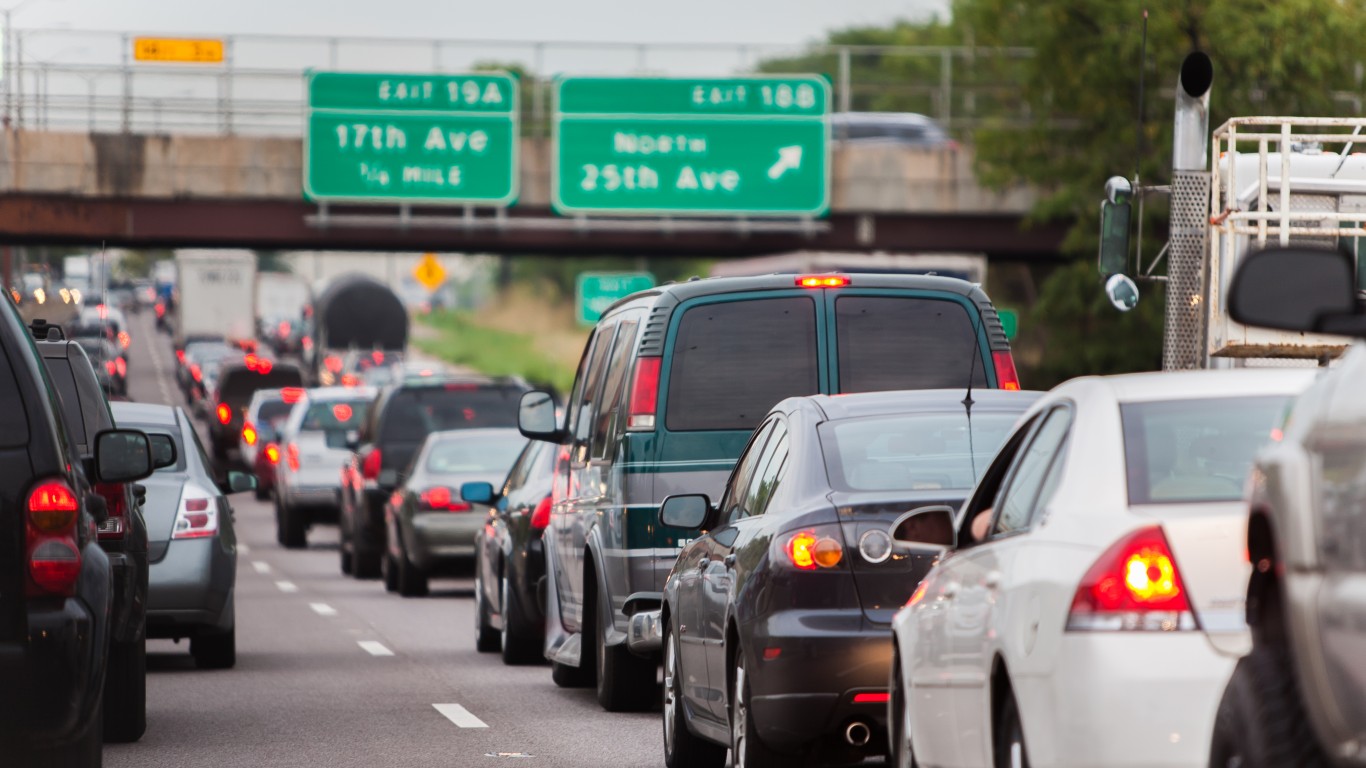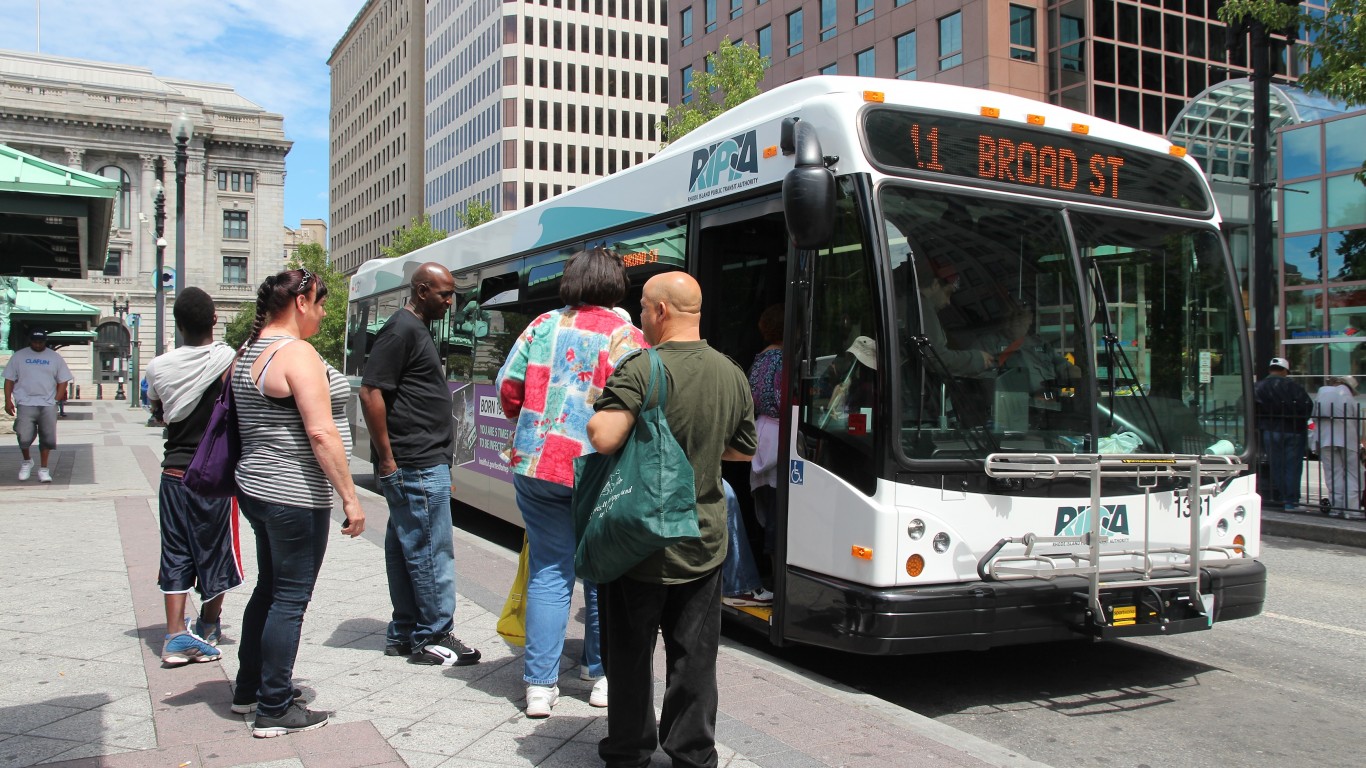
The United States is mostly a vast, public transportation desert, especially compared to other developed European or Asian countries. Buses, trains, light rail systems, and subways tend to have lower ridership levels and longer wait times in part due to the country’s suburban sprawl, car culture, and a public generally unwilling to support loss-leading transportation policies supported by public money.
Outside of a handful of large urban areas, most Americans rely heavily on private vehicles while the carless are left with few low-cost commuting and errand-running options. But there are some pockets of the country with fairly decent public transport options. (These are the cities with the longest commutes.)
To determine the 25 small cities with the best public transportation systems, 24/7 Wall St. constructed an index using data on transit ridership and performance for all U.S. transit systems from the Federal Transit Administration’s National Transit Database, the U.S. Census Bureau’s American Community Survey, and other sources.
These 25 small American cities have the best systems to move people around, mostly by bus. Three of them also offer ferry service, and two — Alexandria, Virginia, and Salt Lake City — have light rail systems. (What it actually costs to live in America’s most expensive cities.)
The share of commuters who use public transport in these small cities averages about 11%, and ridership averages about 22 people per hour. The age of the vehicles (mostly buses) used by these systems ranges from 3.2 years in Vail, Colorado, to 11.5 years in Ames, Iowa.
Thanks to its proximity to the nation’s capital, Virginia has the largest number of small cities with the best public transportation infrastructure on this list: Blacksburg, Arlington, Richmond, and Alexandria. New York has three cities on the list: Ithaca, Long Beach, and Albany.
The country’s largest state by population, California, has only two small cities with the best public transportation, Santa Cruz and Davis, but Davis leads the cities on this list in the average number of users per hour. Texas, the second-largest state by population, has no cities on the list. Only 16 states have small U.S. cities with the best public transportation based on ridership, frequency, and fleet age.
Here is the small American city with the best public transportation
Click here to read our detailed methodology
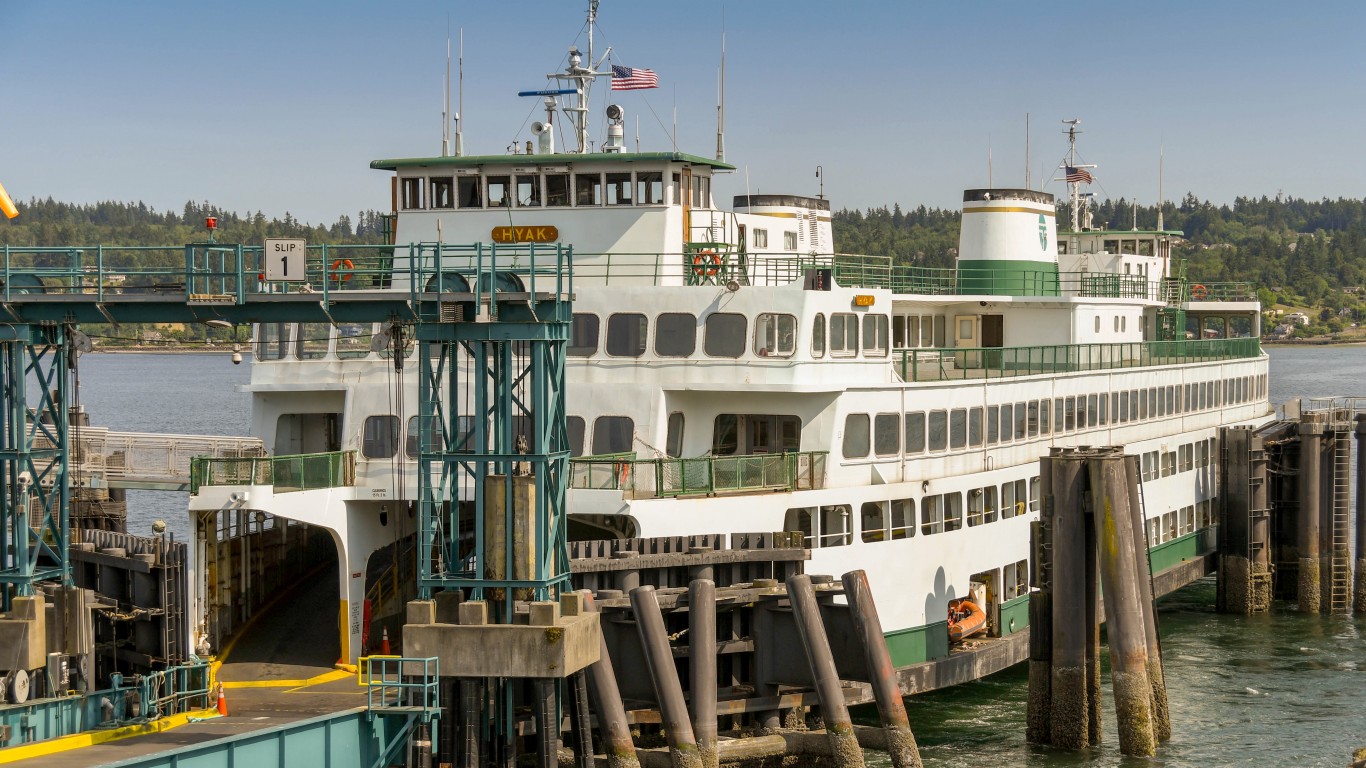
25. Bremerton, WA
> Commuters using public transit: 7.7%
> Ridership, all systems: 9.5 passengers per hour
> Avg. age of fleet: 9.1 years
> Modes of transit: Bus, demand response, ferryboat, vanpool
[in-text-ad]
24. Iowa City, IA
> Commuters using public transit: 7.8%
> Ridership, all systems: 25.2 passengers per hour
> Avg. age of fleet: 8.2 years
> Modes of transit: Bus, demand response
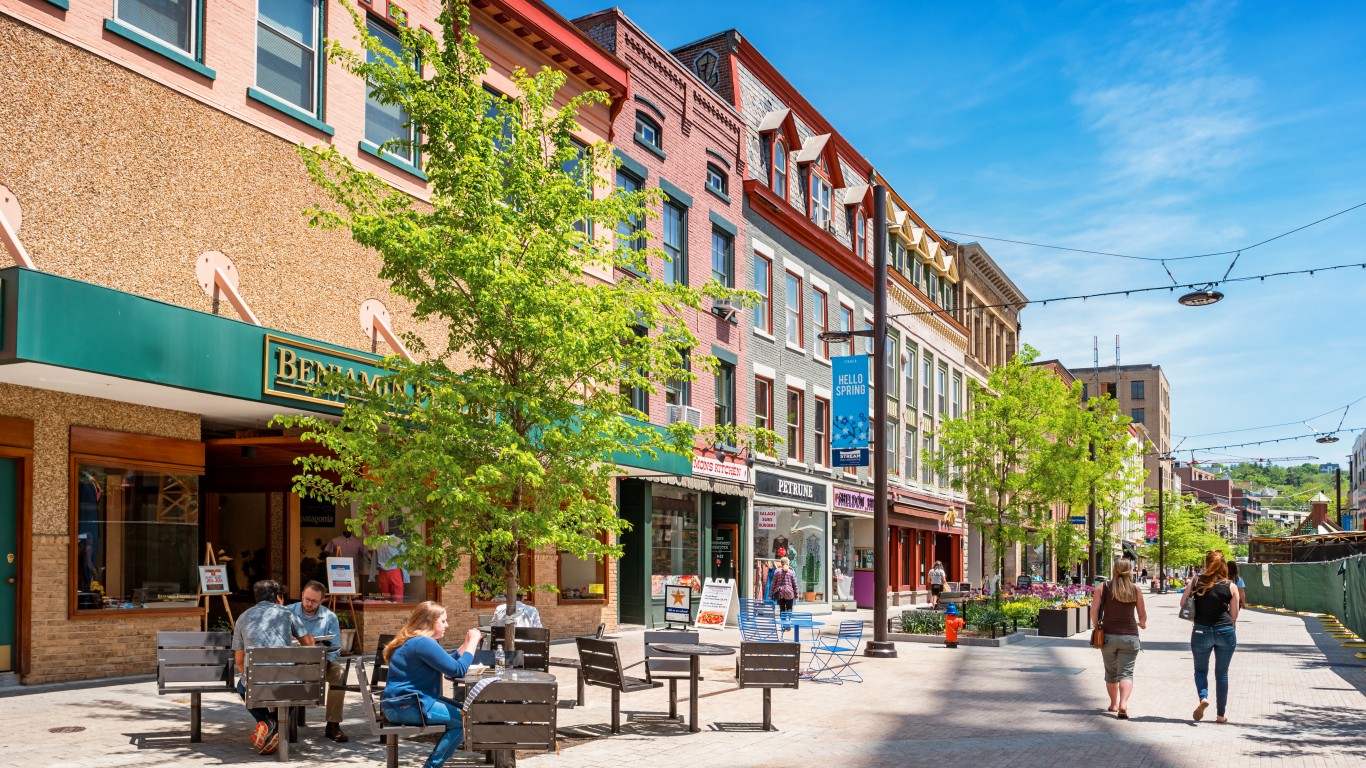
23. Ithaca, NY
> Commuters using public transit: 12.5%
> Ridership, all systems: 12.6 passengers per hour
> Avg. age of fleet: 5.1 years
> Modes of transit: Bus, demand response
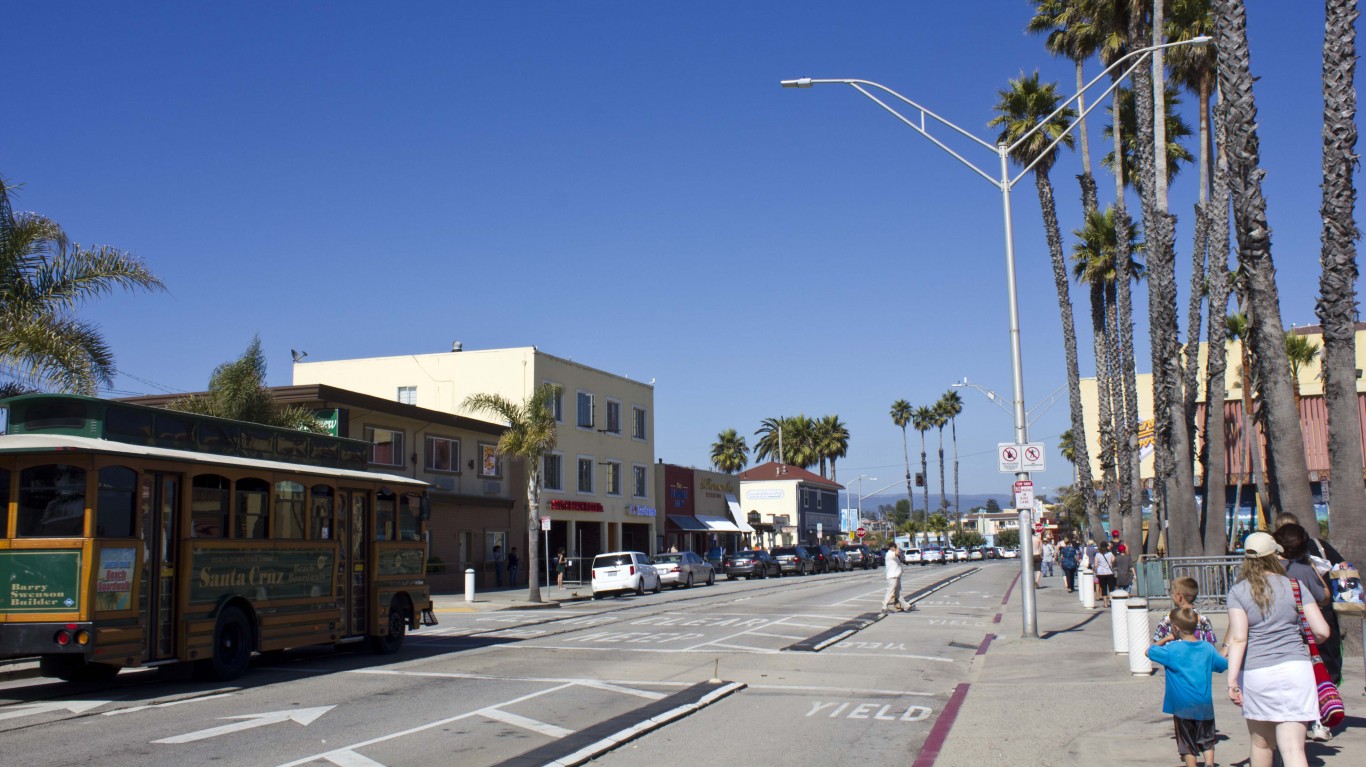
22. Santa Cruz, CA
> Commuters using public transit: 5.4%
> Ridership, all systems: 16.9 passengers per hour
> Avg. age of fleet: 7.9 years
> Modes of transit: Bus, commuter bus, demand response
[in-text-ad-2]
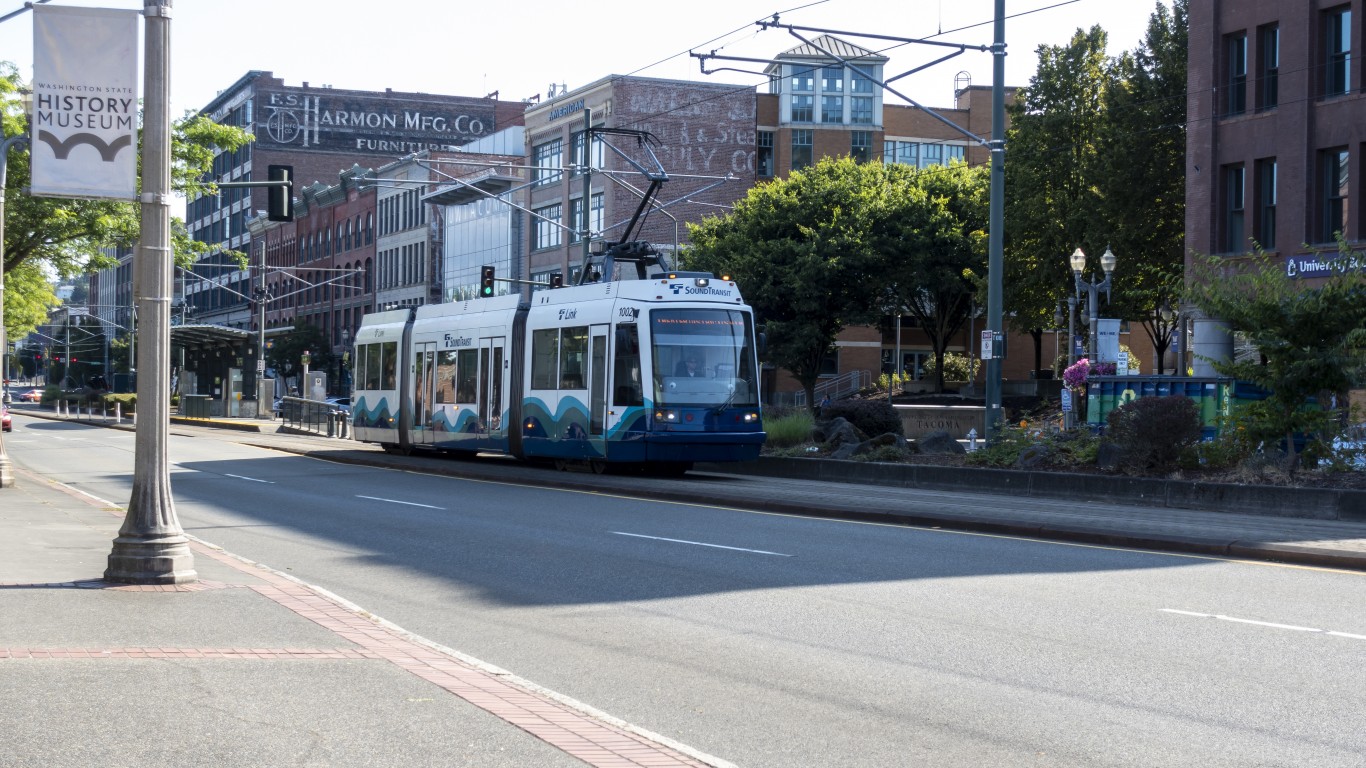
21. Tacoma, WA
> Commuters using public transit: 6.5%
> Ridership, all systems: 10.2 passengers per hour
> Avg. age of fleet: 4.4 years
> Modes of transit: Bus, demand response, ferryboat, vanpool
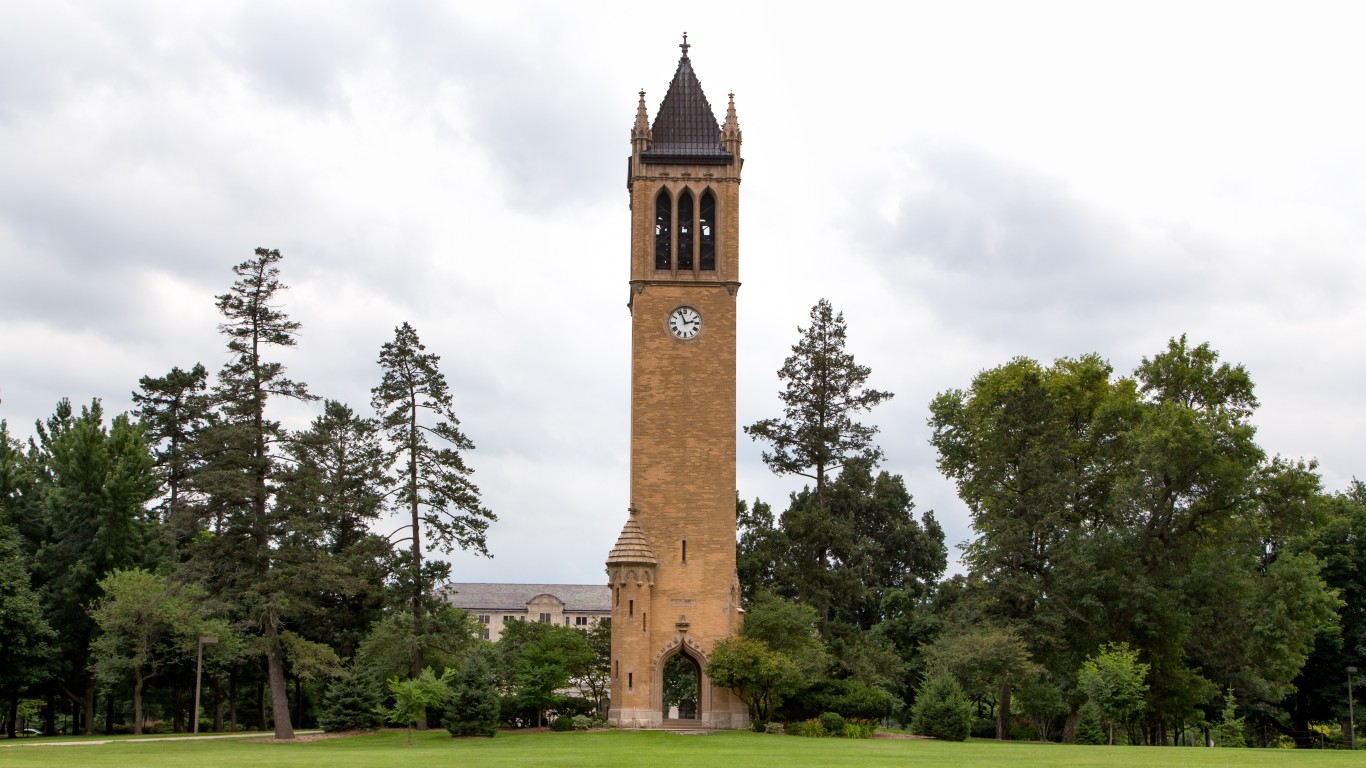
20. Ames, IA
> Commuters using public transit: 7.9%
> Ridership, all systems: 38.3 passengers per hour
> Avg. age of fleet: 11.5 years
> Modes of transit: Bus
[in-text-ad]
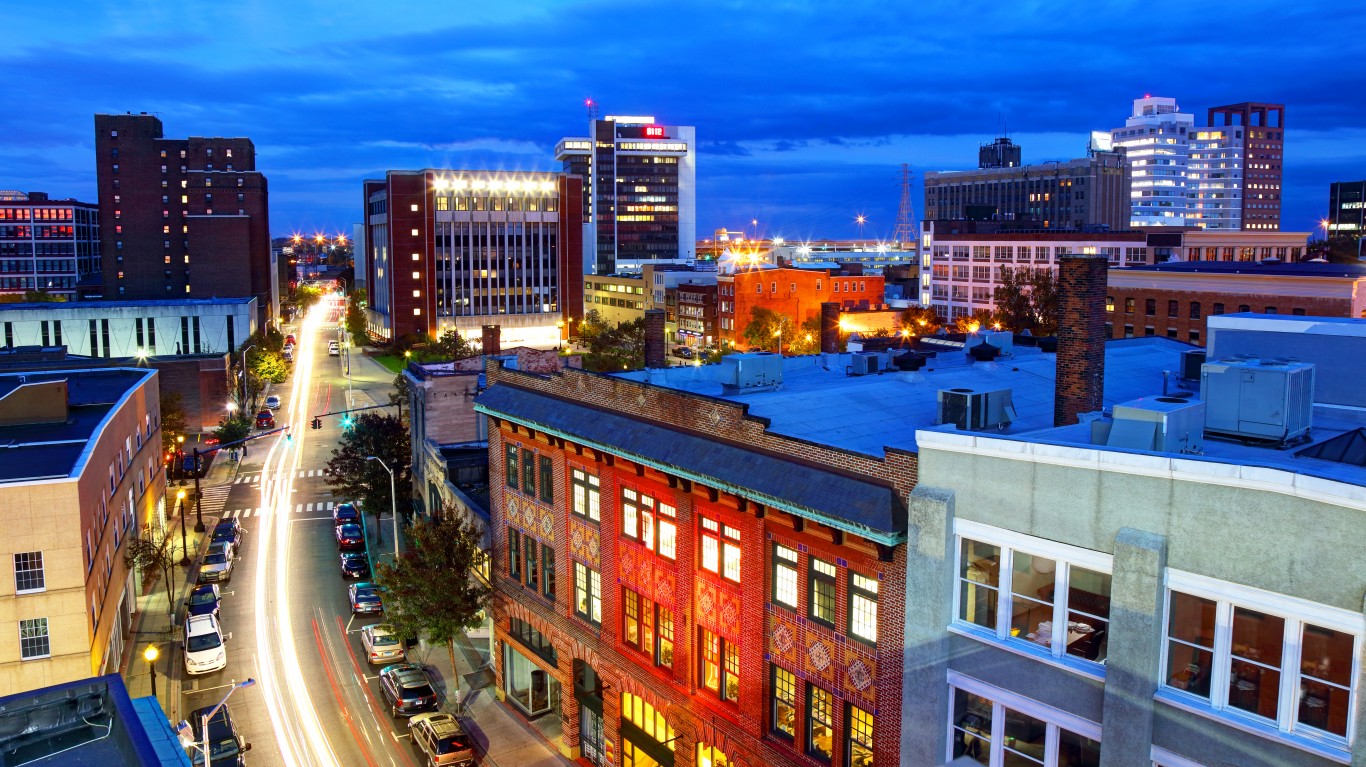
19. Bridgeport, CT
> Commuters using public transit: 10.4%
> Ridership, all systems: 24.1 passengers per hour
> Avg. age of fleet: 4.3 years
> Modes of transit: Bus, demand response
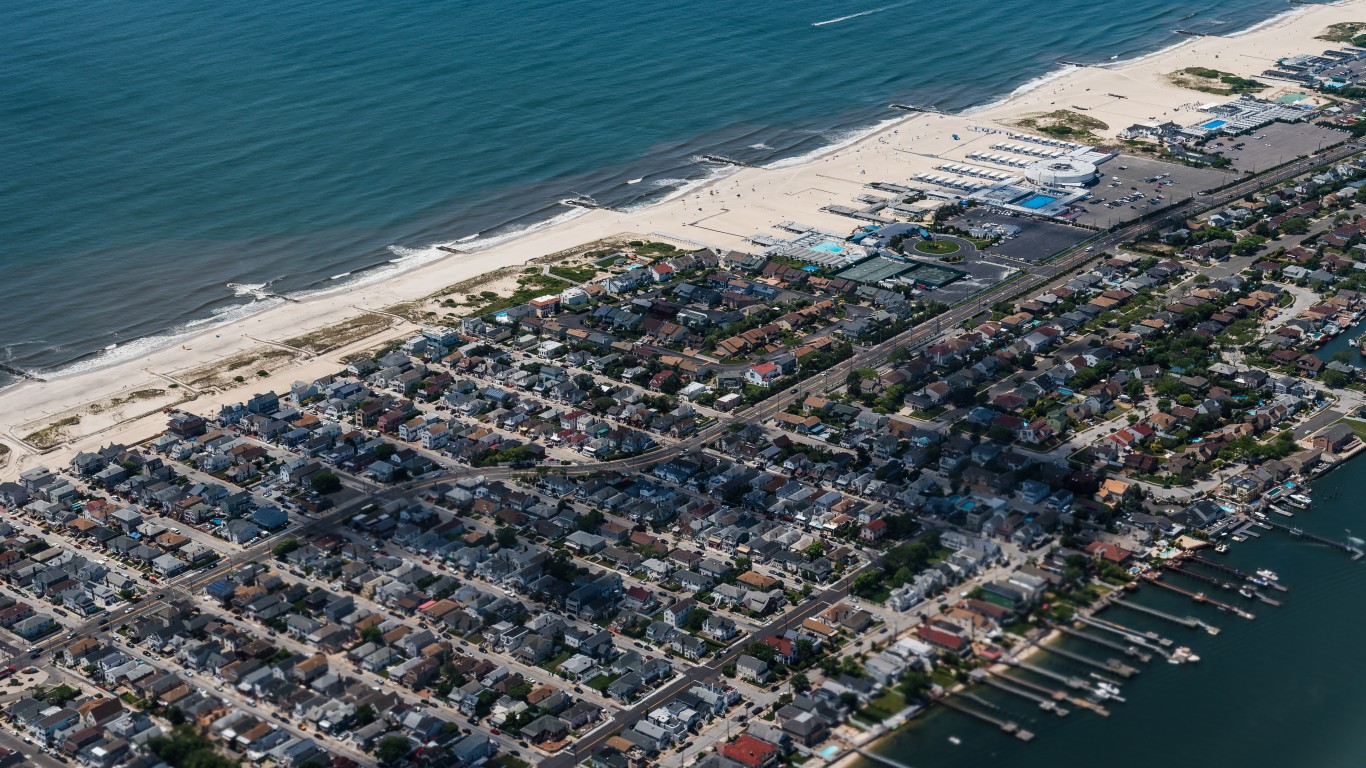
18. Long Beach, NY
> Commuters using public transit: 20.3%
> Ridership, all systems: 5.8 passengers per hour
> Avg. age of fleet: 7.1 years
> Modes of transit: Bus, demand response

17. Providence, RI
> Commuters using public transit: 5.4%
> Ridership, all systems: 15.7 passengers per hour
> Avg. age of fleet: 5.4 years
> Modes of transit: Bus, demand response, ferryboat, vanpool
[in-text-ad-2]
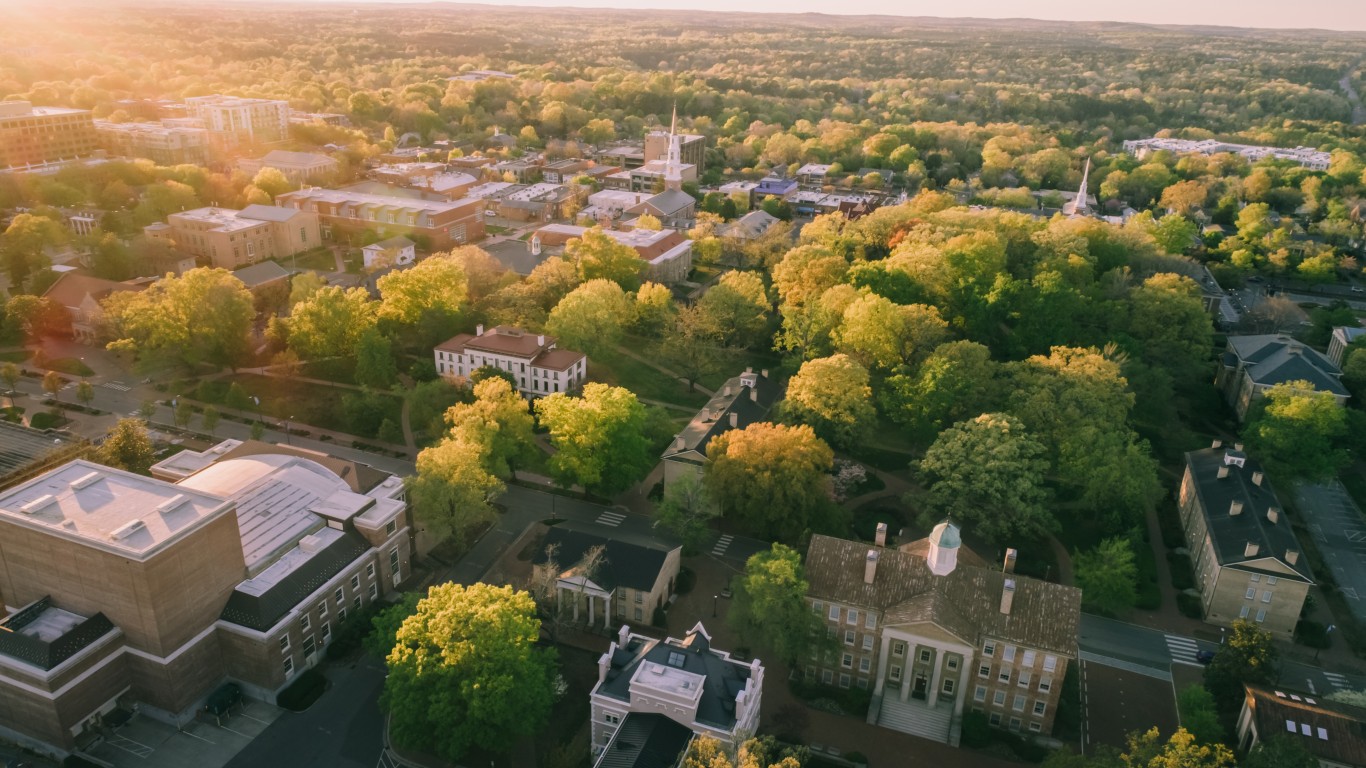
16. Chapel Hill, NC
> Commuters using public transit: 8.9%
> Ridership, all systems: 30.5 passengers per hour
> Avg. age of fleet: 5.4 years
> Modes of transit: Bus, demand response
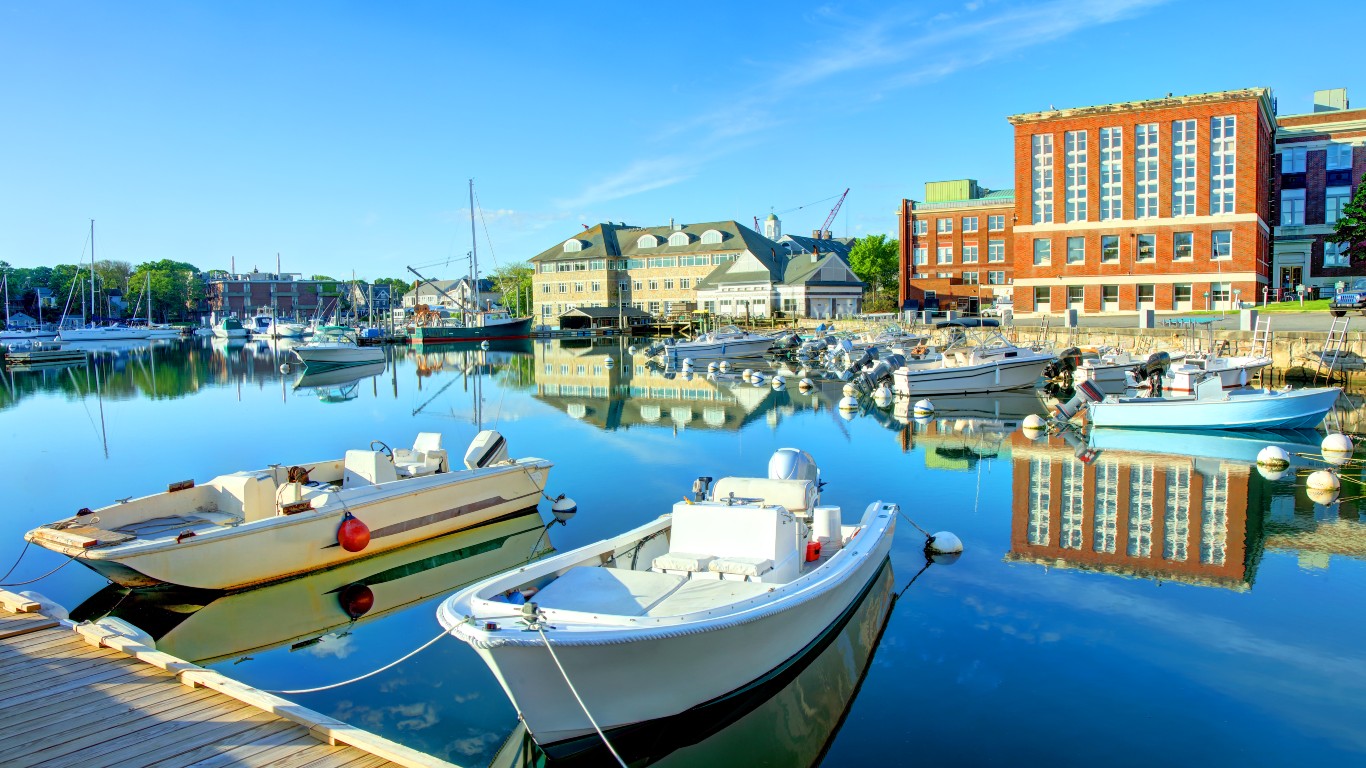
15. Woods Hole, MA
> Commuters using public transit: 6.9%
> Ridership, all systems: 36.3 passengers per hour
> Avg. age of fleet: 7.2 years
> Modes of transit: Bus, ferryboat
[in-text-ad]
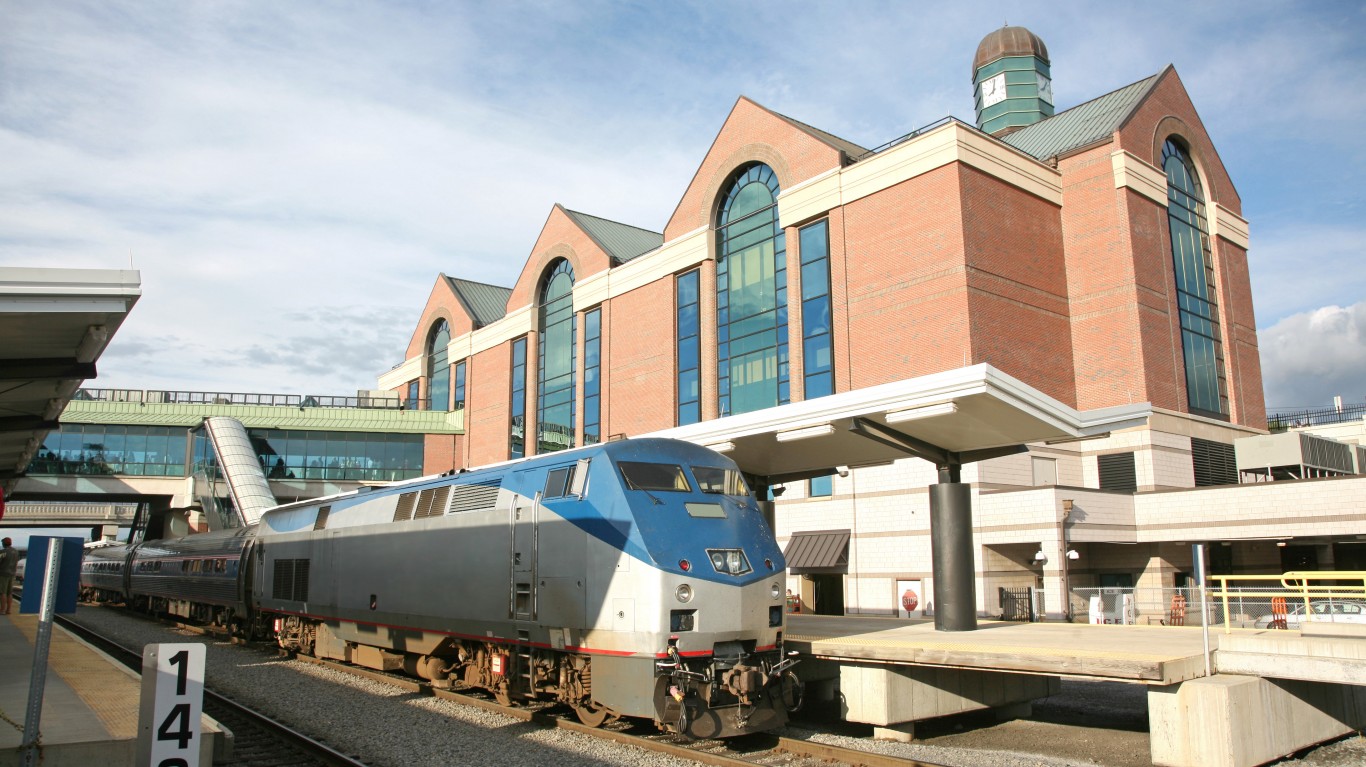
14. Albany, NY
> Commuters using public transit: 13.6%
> Ridership, all systems: 18.3 passengers per hour
> Avg. age of fleet: 6.0 years
> Modes of transit: Bus, commuter bus, demand response, vanpool

13. Davis, CA
> Commuters using public transit: 7.7%
> Ridership, all systems: 42.5 passengers per hour
> Avg. age of fleet: 8.8 years
> Modes of transit: Bus, demand response
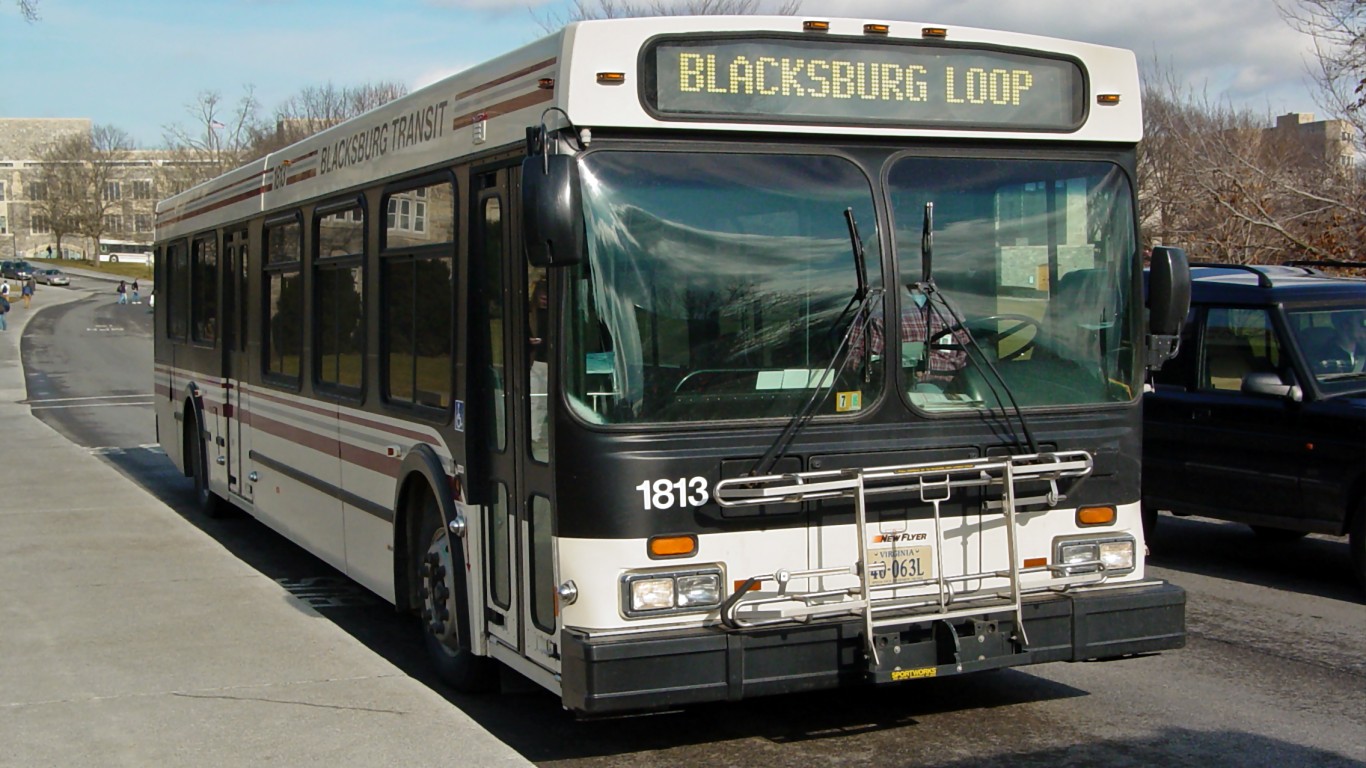
12. Blacksburg, VA
> Commuters using public transit: 6.1%
> Ridership, all systems: 34.8 passengers per hour
> Avg. age of fleet: 5.8 years
> Modes of transit: Bus, demand response
[in-text-ad-2]

11. Breckenridge, CO
> Commuters using public transit: 20.7%
> Ridership, all systems: 18.5 passengers per hour
> Avg. age of fleet: 6.6 years
> Modes of transit: Bus, commuter bus, demand response
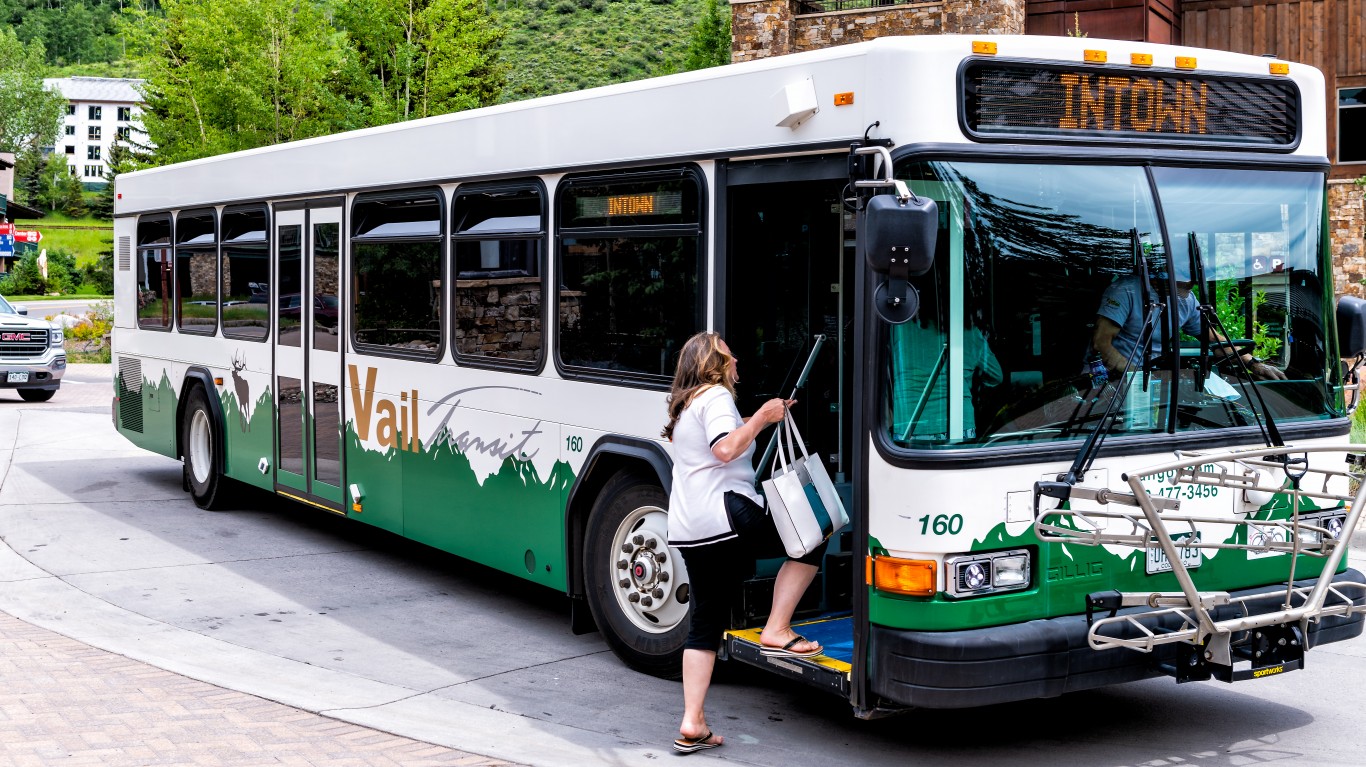
10. Vail, CO
> Commuters using public transit: 10.8%
> Ridership, all systems: 33.2 passengers per hour
> Avg. age of fleet: 3.2 years
> Modes of transit: Bus, demand response
[in-text-ad]
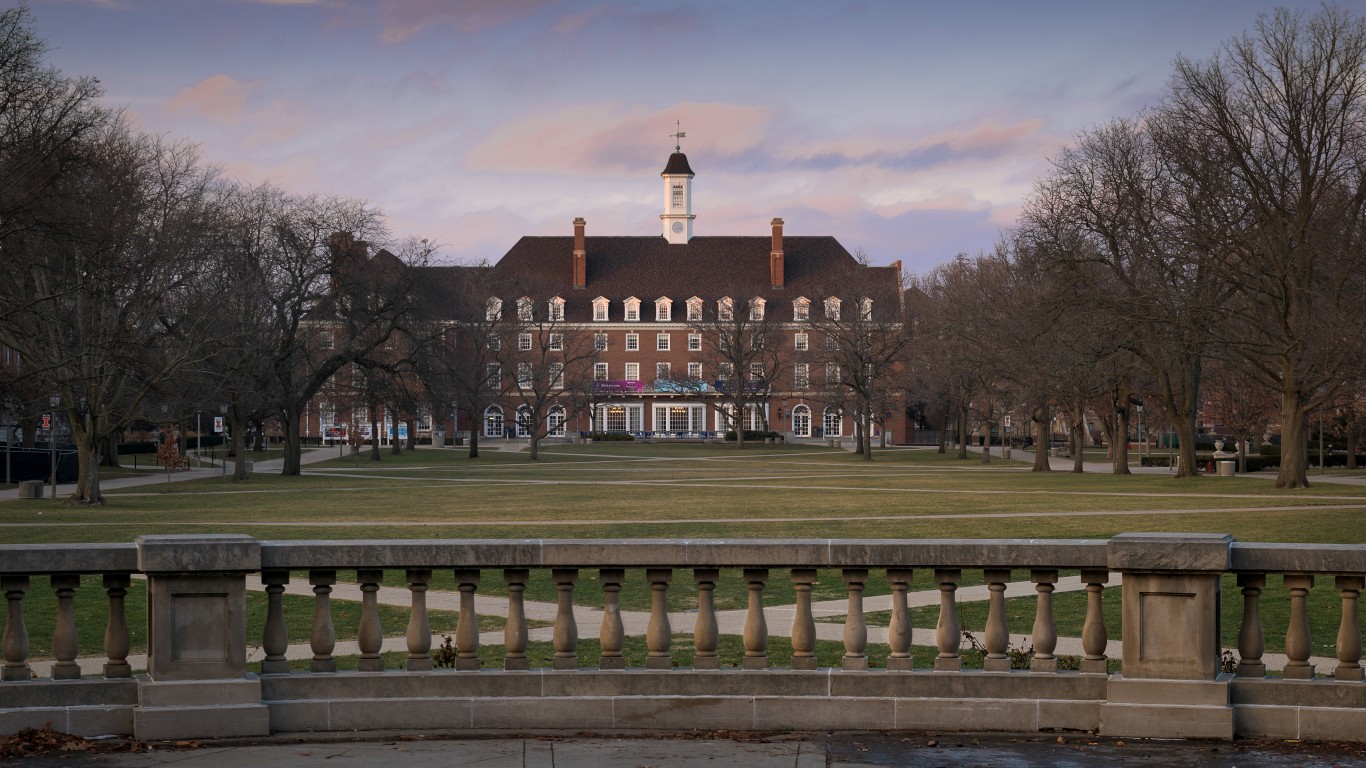
9. Urbana, IL
> Commuters using public transit: 11.3%
> Ridership, all systems: 27.3 passengers per hour
> Avg. age of fleet: 6.6 years
> Modes of transit: Bus, demand response
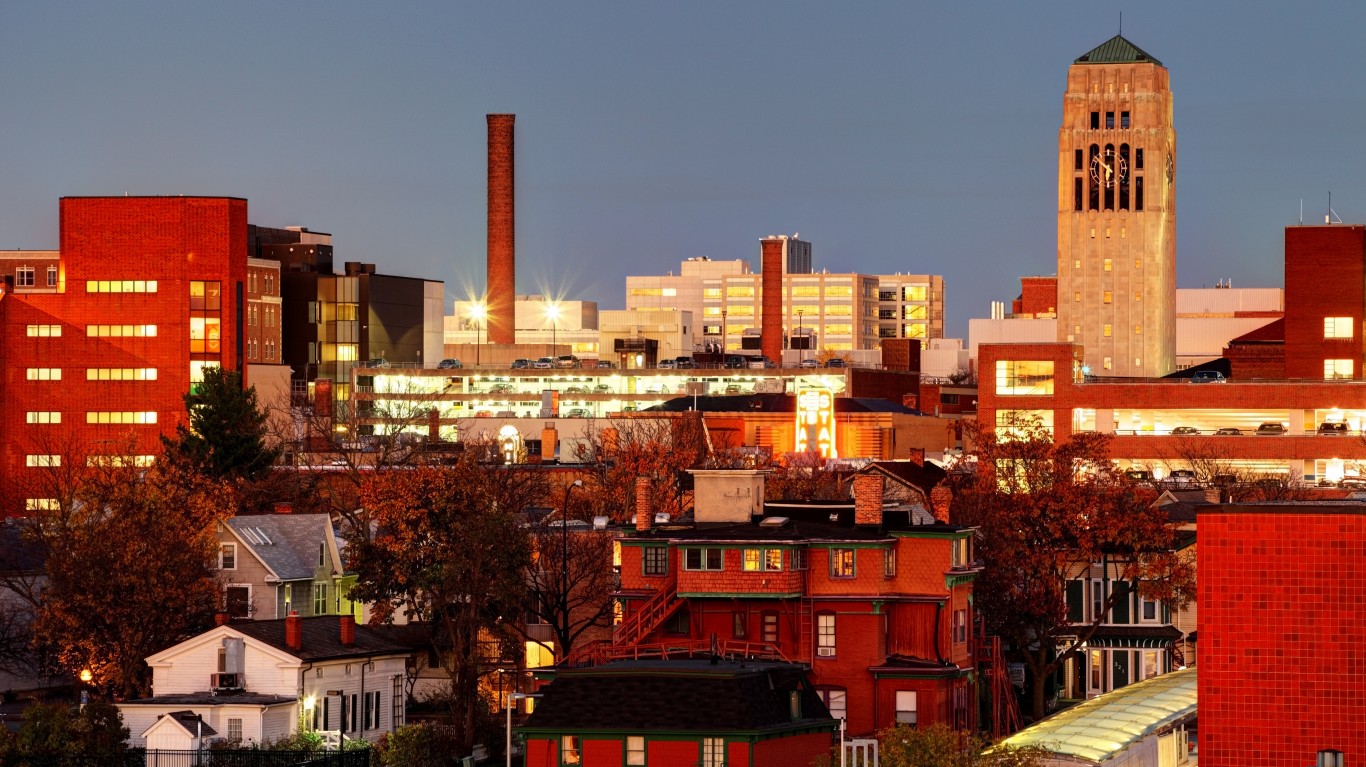
8. Ann Arbor, MI
> Commuters using public transit: 9.4%
> Ridership, all systems: 20.0 passengers per hour
> Avg. age of fleet: 3.6 years
> Modes of transit: Bus, commuter bus, demand response, vanpool
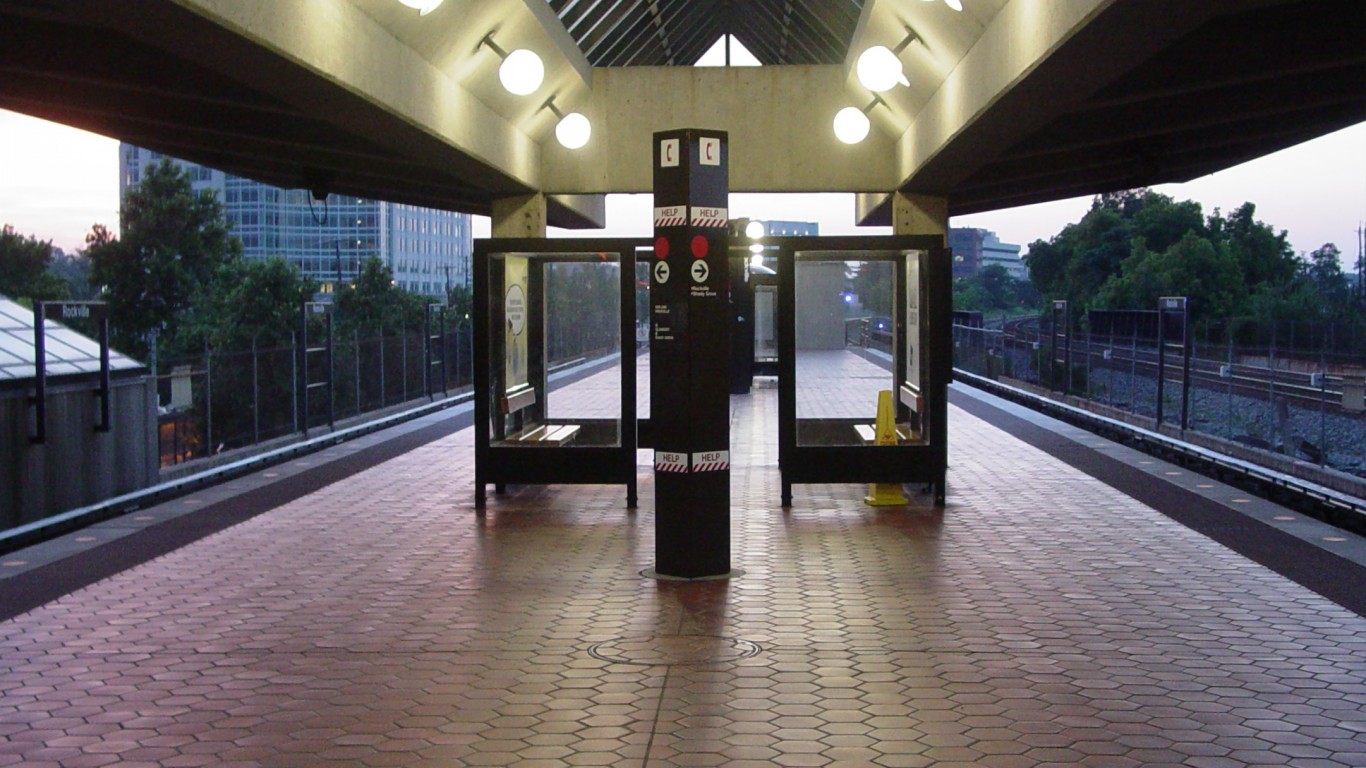
7. Rockville, MD
> Commuters using public transit: 17.3%
> Ridership, all systems: 18.4 passengers per hour
> Avg. age of fleet: 4.6 years
> Modes of transit: Bus, demand response
[in-text-ad-2]
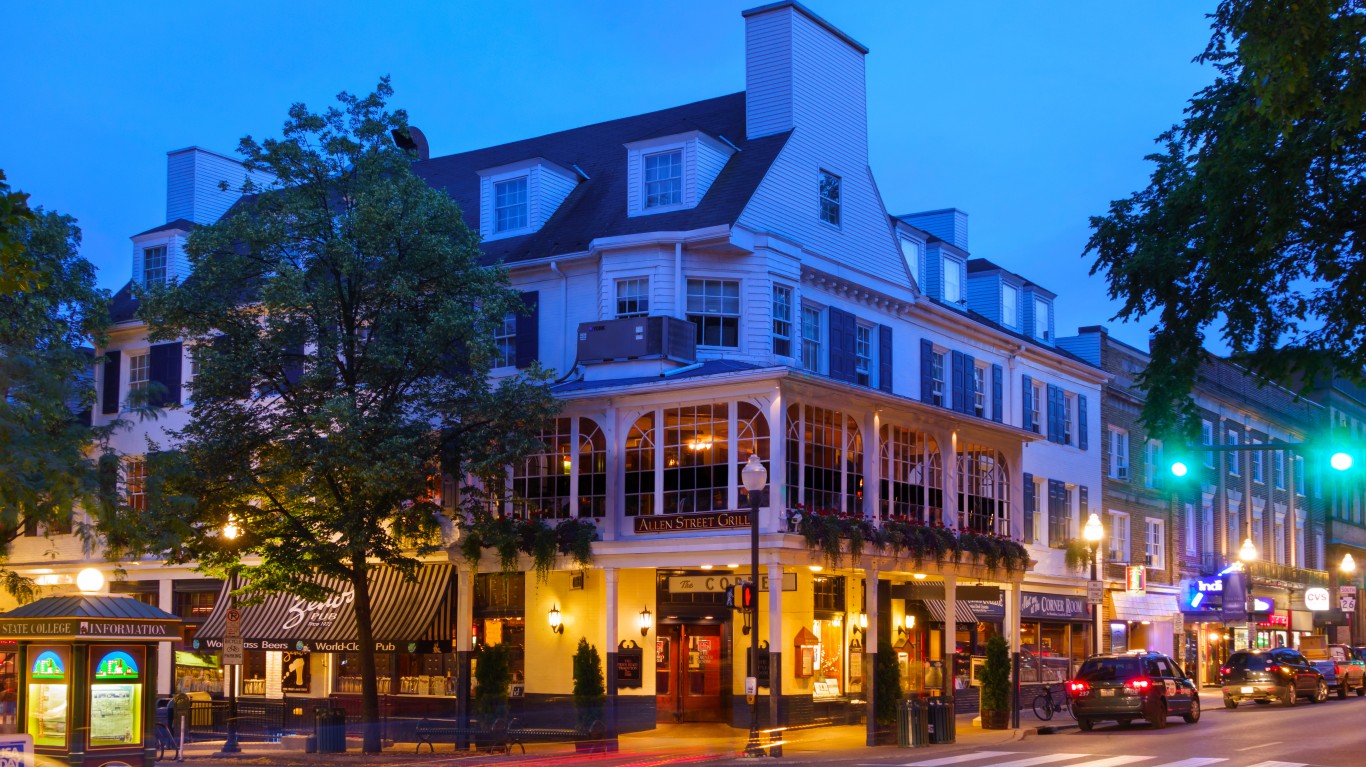
6. State College, PA
> Commuters using public transit: 12.2%
> Ridership, all systems: 32.6 passengers per hour
> Avg. age of fleet: 7.0 years
> Modes of transit: Bus, demand response, vanpool
5. Arlington, VA
> Commuters using public transit: 25.3%
> Ridership, all systems: 12.7 passengers per hour
> Avg. age of fleet: 6.6 years
> Modes of transit: Bus, demand response
[in-text-ad]

4. Richmond, VA
> Commuters using public transit: 5.0%
> Ridership, all systems: 13.1 passengers per hour
> Avg. age of fleet: 3.7 years
> Modes of transit: Bus, bus rapid transit, demand response, vanpool

3. Clemson, SC
> Commuters using public transit: 5.1%
> Ridership, all systems: 16.4 passengers per hour
> Avg. age of fleet: 6.7 years
> Modes of transit: Bus
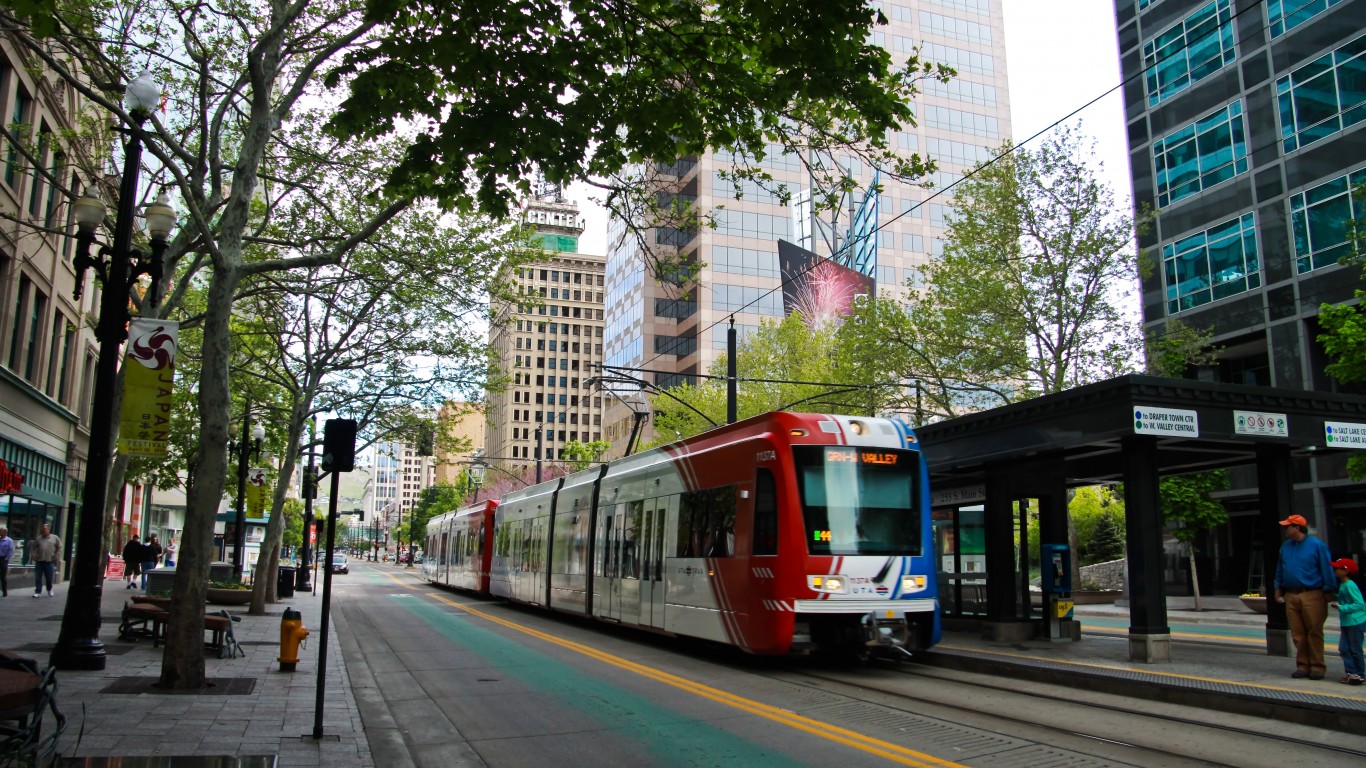
2. Salt Lake City, UT
> Commuters using public transit: 6.9%
> Ridership, all systems: 12.4 passengers per hour
> Avg. age of fleet: 5.2 years
> Modes of transit: Bus, commuter bus, commuter rail, demand response, light rail, vanpool
[in-text-ad-2]
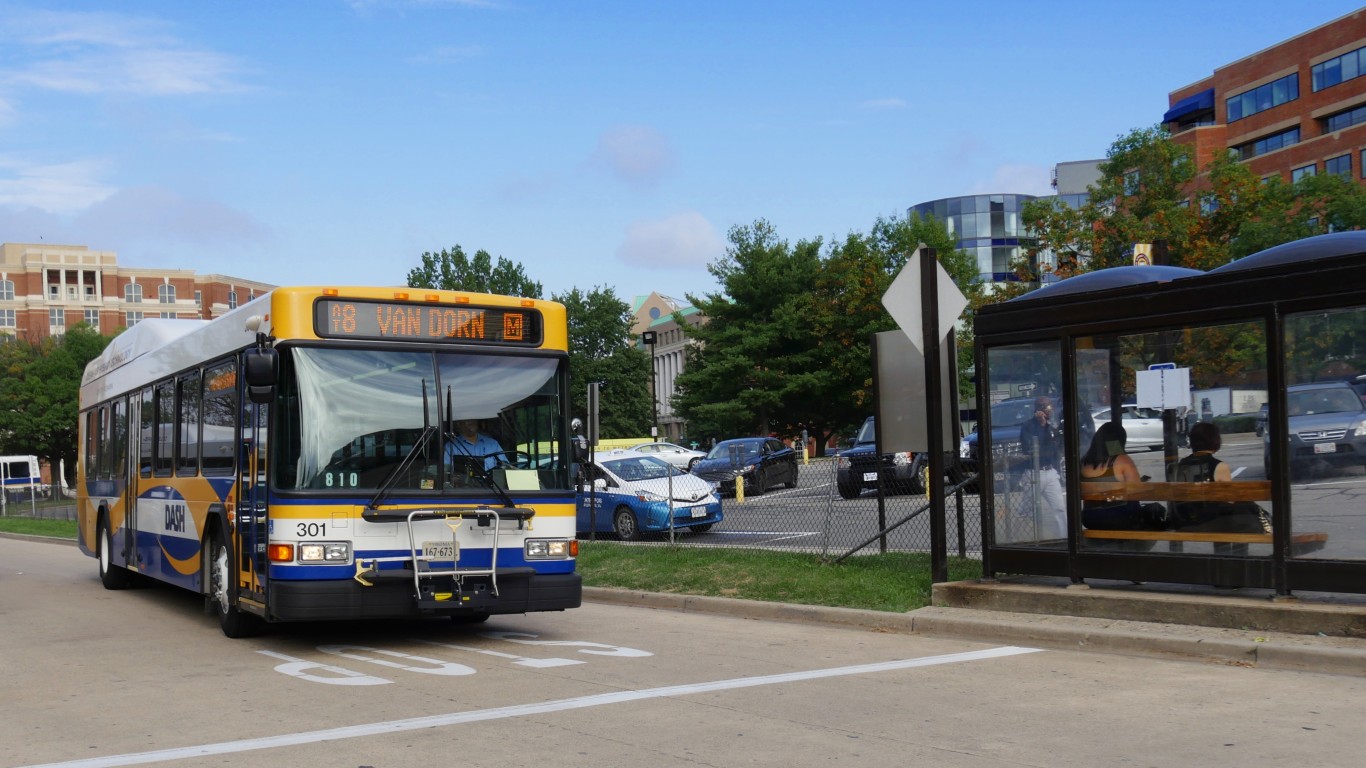
1. Alexandria, VA
> Commuters using public transit: 18.6%
> Ridership, all systems: 19.6 passengers per hour
> Avg. age of fleet: 7.5 years
> Modes of transit: Bus, commuter rail, demand response
Methodology
To determine the small cities with the best public transportation systems, 24/7 Wall St. reviewed data on ridership and performance for all U.S. transit systems from the Federal Transit Administration’s National Transit Database and the U.S. Census Bureau’s American Community Survey.
We constructed an index of 10 measures: the number of transit modes available; the number of passengers using the transit system per hour; the annual number of passenger trips per resident; the number of mechanical failures per 100,000 revenue miles; the average age of passenger fleet vehicles; the miles of roadway dedicated to Bus Rapid Transit; bus vehicle miles powered by electric battery as a percentage of all bus vehicle miles; the percentage of workers 16 years and over who commute using public transit; the percentage of workers 16 years and over with a vehicle at home who take public transit; and the Transit Connectivity Index.
Data on commuting characteristics for workers 16 years and over came from the ACS and are five-year estimates for 2020. The Transit Connectivity Index, a custom measure from transportation data provider AllTransit, measures the concentration of buses and trains within a municipality. All other data is from the FTA NTD and is for 2020.
Data was aggregated across all transportation systems within a municipality, and was weighted equally in the index. Only places with fewer than 250,000 residents where at least 5% of workers 16 years and over commute using public transportation were considered.
The Average American Is Losing Momentum On Their Savings Every Day (Sponsor)
If you’re like many Americans and keep your money ‘safe’ in a checking or savings account, think again. The average yield on a savings account is a paltry .4%1 today. Checking accounts are even worse.
But there is good news. To win qualified customers, some accounts are paying more than 7x the national average. That’s an incredible way to keep your money safe and earn more at the same time. Our top pick for high yield savings accounts includes other benefits as well. You can earn a $200 bonus and up to 7X the national average with qualifying deposits. Terms apply. Member, FDIC.
Click here to see how much more you could be earning on your savings today. It takes just a few minutes to open an account to make your money work for you.
Thank you for reading! Have some feedback for us?
Contact the 24/7 Wall St. editorial team.
