Rents across the country have gone through a period of historical growth in the past two years. According to real estate research firm CoStar Group, rents in the U.S. rose 11.3% last year. In contrast, over the previous five years, gross rents increased by 18.1%.
Rising rent prices are the result of soaring inflation and a squeeze on inventory. This lack of supply relative to demand comes as the number of people seeking to rent has increased substantially during the pandemic, while the number of available properties has been limited by shortages of building materials and other delays in construction resulting from the pandemic. This is the industry laying off the most Americans.
To determine the 50 towns with the highest rent, 24/7 Wall St. reviewed five-year estimates of median gross rent from the U.S. Census Bureau’s 2020 American Community Survey. The median gross rent across the United States is $1,096, and in these 50 towns, which we define as having populations between 1,000 and 25,000 residents, rents range from $2,467 to more than $3,500.
Of the 50 towns with the most expensive rent, California has by far the most, with 24, followed by Hawaii, with seven, and New York and New Jersey with six each. These are the states with the highest rent. Included are some of the highly affluent suburbs of the nation’s major cities such as Scarsdale, New York — one of the many wealthy New York City suburbs in Westchester County — and Topanga, California — a well-to-do, artist-friendly community on the outskirts of Los Angeles. These are the richest cities in America.
In some of the towns where rent costs are higher, a higher share of housing units are occupied by renters, rather than homeowners. Nationwide, 35.6% of homes are rental properties. In 12 of the towns on this list, that share is at least 60%. This is largely because these places have more expensive housing markets as a whole, meaning residents are priced out of the possibility of owning a home and are forced to rent. Nationwide, the median home value is $229,800. In all but four of the towns on this list with available data, the typical home is worth more than double this, and 18 towns on this list have a median home value in excess of $1 million.
While rents in these markets are much higher than the national figure, renting property is actually in many places relatively affordable after accounting for the typical resident’s income. In roughly two-thirds of the cities on this list, median gross rent accounts for more than 29.6% of the local median household income – the national figure of rent as a percentage of income.
Click here to see the towns with the most expensive rent
Click here to read our detailed methodology
50. Cresskill, New Jersey
> Median monthly rental cost: $2,467
> Share of income typically spent on rent: 40.7% — 263rd highest of 5,275 towns (tied)
> Rental occupied housing units: 19.2% — 343rd lowest of 5,275 towns
> Median home value: $680,500 — 154th highest of 5,198 towns (tied)
[in-text-ad]

49. Calabasas, California
> Median monthly rental cost: $2,476
> Share of income typically spent on rent: 40.3% — 289th highest of 5,275 towns (tied)
> Rental occupied housing units: 31.2% — 1,462nd lowest of 5,275 towns
> Median home value: $1,127,500 — 37th highest of 5,198 towns

48. Emeryville, California
> Median monthly rental cost: $2,497
> Share of income typically spent on rent: 28.8% — 2,537th lowest of 5,275 towns (tied)
> Rental occupied housing units: 70.1% — 161st highest of 5,275 towns
> Median home value: $538,300 — 302nd highest of 5,198 towns

47. Kalaeloa, Hawaii
> Median monthly rental cost: $2,506
> Share of income typically spent on rent: 34.6% — 859th highest of 5,275 towns (tied)
> Rental occupied housing units: 100.0% — the highest of 5,275 towns (tied)
> Median home value: N/A
[in-text-ad-2]
46. Bethpage, New York
> Median monthly rental cost: $2,509
> Share of income typically spent on rent: 50.0%+ — the highest of 5,275 towns (tied)
> Rental occupied housing units: 10.7% — 25th lowest of 5,275 towns
> Median home value: $497,400 — 360th highest of 5,198 towns
45. Nesconset, New York
> Median monthly rental cost: $2,511
> Share of income typically spent on rent: 32.9% — 1,233rd highest of 5,275 towns (tied)
> Rental occupied housing units: 15.0% — 139th lowest of 5,275 towns
> Median home value: $476,800 — 399th highest of 5,198 towns
[in-text-ad]

44. Sunset Hills, Missouri
> Median monthly rental cost: $2,514
> Share of income typically spent on rent: 48.9% — 77th highest of 5,275 towns (tied)
> Rental occupied housing units: 20.8% — 437th lowest of 5,275 towns
> Median home value: $416,300 — 553rd highest of 5,198 towns

43. Punta Rassa, Florida
> Median monthly rental cost: $2,520
> Share of income typically spent on rent: 46.7% — 98th highest of 5,275 towns (tied)
> Rental occupied housing units: 63.9% — 279th highest of 5,275 towns
> Median home value: $445,700 — 477th highest of 5,198 towns
42. Kentfield, California
> Median monthly rental cost: $2,523
> Share of income typically spent on rent: 21.7% — 252nd lowest of 5,275 towns (tied)
> Rental occupied housing units: 19.1% — 339th lowest of 5,275 towns
> Median home value: $1,971,300 — 7th highest of 5,198 towns
[in-text-ad-2]

41. Florham Park, New Jersey
> Median monthly rental cost: $2,524
> Share of income typically spent on rent: 28.1% — 2,188th lowest of 5,275 towns (tied)
> Rental occupied housing units: 28.5% — 1,144th lowest of 5,275 towns
> Median home value: $612,500 — 219th highest of 5,198 towns

40. Del Aire, California
> Median monthly rental cost: $2,529
> Share of income typically spent on rent: 28.8% — 2,537th lowest of 5,275 towns (tied)
> Rental occupied housing units: 33.1% — 1,731st lowest of 5,275 towns
> Median home value: $684,900 — 150th highest of 5,198 towns
[in-text-ad]

39. Tiburon, California
> Median monthly rental cost: $2,537
> Share of income typically spent on rent: 25.5% — 1,166th lowest of 5,275 towns (tied)
> Rental occupied housing units: 30.0% — 1,295th lowest of 5,275 towns
> Median home value: $2,000,000+ — the highest of 5,198 towns (tied)
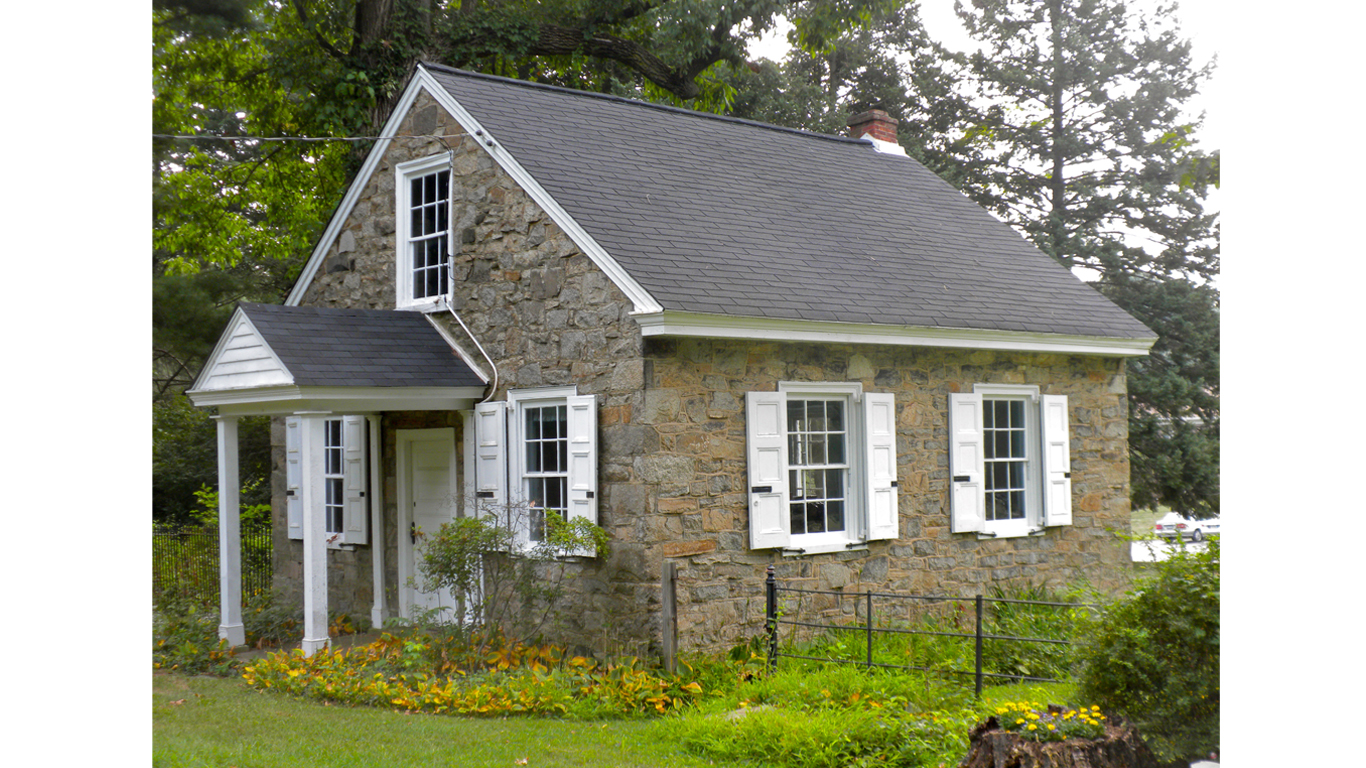
38. Lima, Pennsylvania
> Median monthly rental cost: $2,548
> Share of income typically spent on rent: 50.0%+ — the highest of 5,275 towns (tied)
> Rental occupied housing units: 59.8% — 423rd highest of 5,275 towns
> Median home value: $285,100 — 1,162nd highest of 5,198 towns
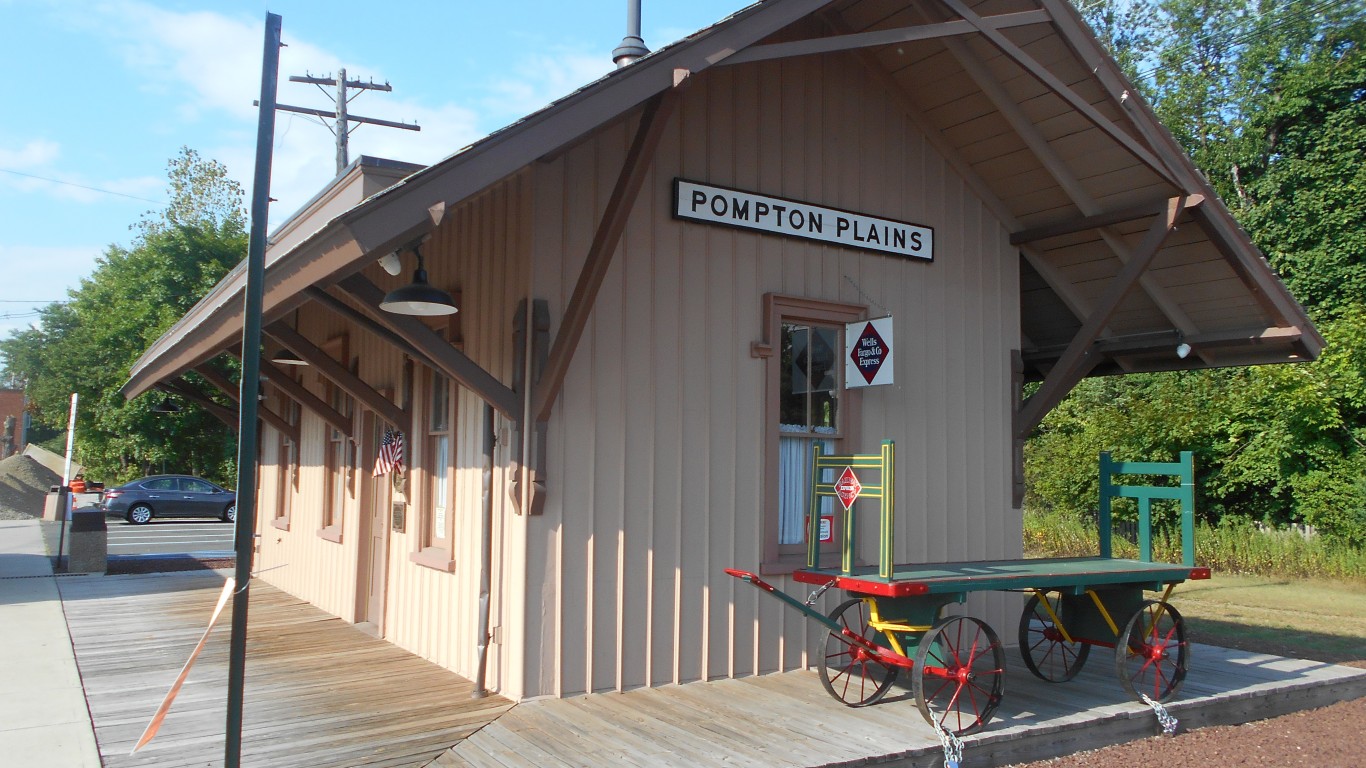
37. Pompton Plains, New Jersey
> Median monthly rental cost: $2,574
> Share of income typically spent on rent: 31.5% — 1,635th highest of 5,275 towns (tied)
> Rental occupied housing units: 19.0% — 334th lowest of 5,275 towns
> Median home value: $401,800 — 592nd highest of 5,198 towns
[in-text-ad-2]
36. Melville, New York
> Median monthly rental cost: $2,579
> Share of income typically spent on rent: 35.3% — 749th highest of 5,275 towns (tied)
> Rental occupied housing units: 14.1% — 103rd lowest of 5,275 towns
> Median home value: $650,300 — 181st highest of 5,198 towns

35. Key Biscayne, Florida
> Median monthly rental cost: $2,584
> Share of income typically spent on rent: 32.6% — 1,314th highest of 5,275 towns (tied)
> Rental occupied housing units: 30.7% — 1,388th lowest of 5,275 towns
> Median home value: $1,430,100 — 22nd highest of 5,198 towns
[in-text-ad]
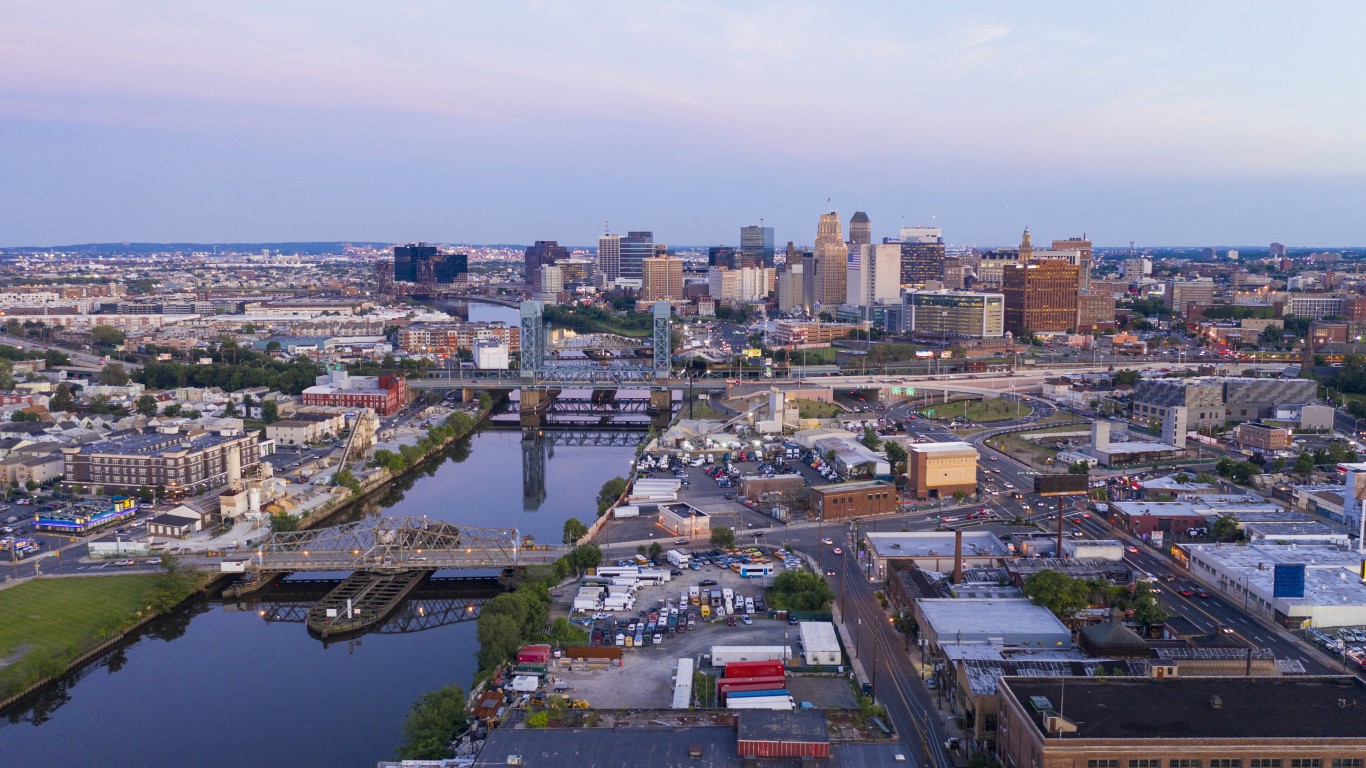
34. Roseland, New Jersey
> Median monthly rental cost: $2,594
> Share of income typically spent on rent: 27.7% — 2,028th lowest of 5,275 towns (tied)
> Rental occupied housing units: 23.3% — 613th lowest of 5,275 towns
> Median home value: $516,500 — 335th highest of 5,198 towns (tied)

33. Oak Park, California
> Median monthly rental cost: $2,618
> Share of income typically spent on rent: 31.1% — 1,774th highest of 5,275 towns (tied)
> Rental occupied housing units: 30.7% — 1,395th lowest of 5,275 towns
> Median home value: $806,700 — 97th highest of 5,198 towns

32. Discovery Bay, California
> Median monthly rental cost: $2,618
> Share of income typically spent on rent: 37.9% — 448th highest of 5,275 towns (tied)
> Rental occupied housing units: 14.6% — 125th lowest of 5,275 towns
> Median home value: $640,700 — 185th highest of 5,198 towns (tied)
[in-text-ad-2]

31. Coronado, California
> Median monthly rental cost: $2,621
> Share of income typically spent on rent: 33.3% — 1,125th highest of 5,275 towns (tied)
> Rental occupied housing units: 46.5% — 1,487th highest of 5,275 towns
> Median home value: $1,656,800 — 10th highest of 5,198 towns

30. Del Mar, California
> Median monthly rental cost: $2,622
> Share of income typically spent on rent: 24.1% — 734th lowest of 5,275 towns (tied)
> Rental occupied housing units: 47.9% — 1,307th highest of 5,275 towns
> Median home value: $2,000,000+ — the highest of 5,198 towns (tied)
[in-text-ad]

29. Cedar Knolls, New Jersey
> Median monthly rental cost: $2,633
> Share of income typically spent on rent: 25.8% — 1,257th lowest of 5,275 towns (tied)
> Rental occupied housing units: 41.9% — 2,182nd highest of 5,275 towns
> Median home value: $484,200 — 385th highest of 5,198 towns

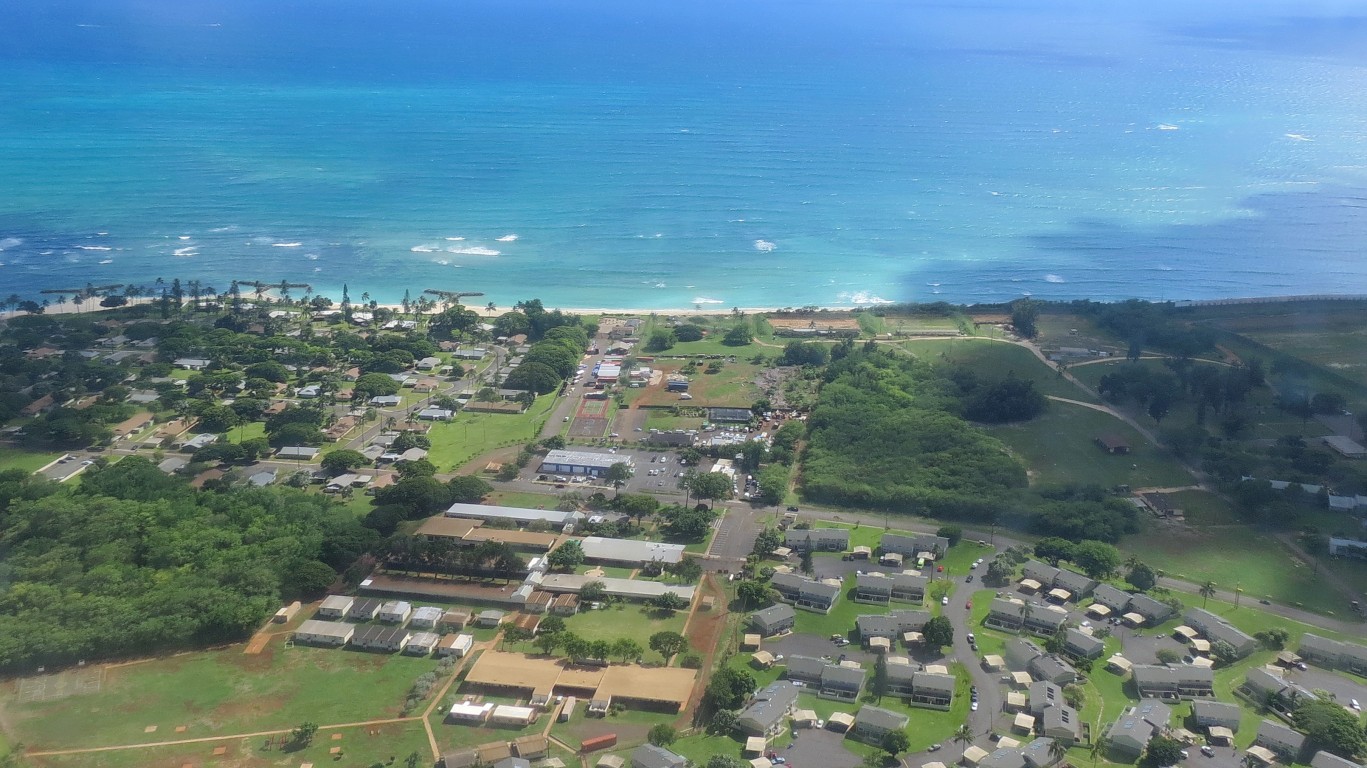
28. Wheeler AFB, Hawaii
> Median monthly rental cost: $2,635
> Share of income typically spent on rent: 46.7% — 98th highest of 5,275 towns (tied)
> Rental occupied housing units: 99.5% — 41st highest of 5,275 towns
> Median home value: N/A
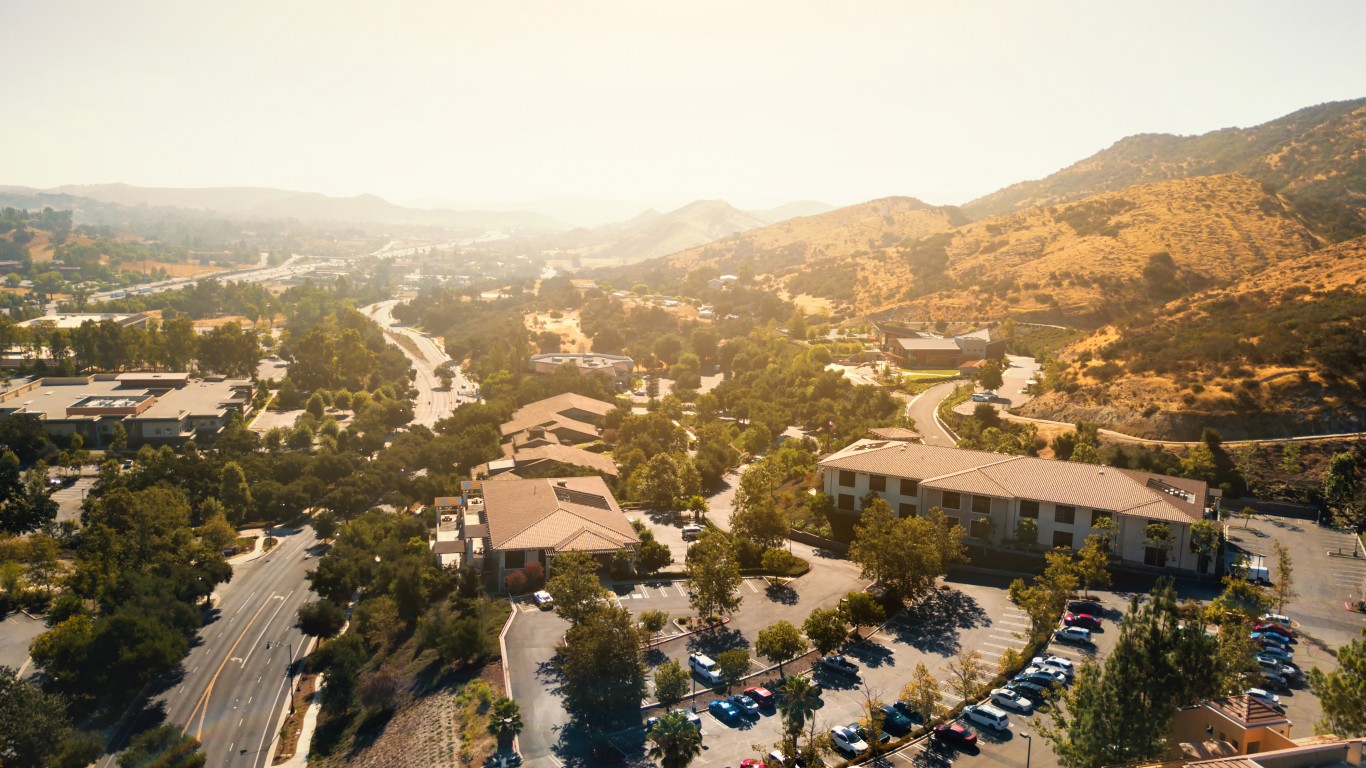
27. Agoura Hills, California
> Median monthly rental cost: $2,644
> Share of income typically spent on rent: 30.3% — 2,050th highest of 5,275 towns (tied)
> Rental occupied housing units: 21.1% — 465th lowest of 5,275 towns
> Median home value: $828,100 — 88th highest of 5,198 towns
[in-text-ad-2]

26. Tamalpais-Homestead Valley, California
> Median monthly rental cost: $2,678
> Share of income typically spent on rent: 23.0% — 438th lowest of 5,275 towns (tied)
> Rental occupied housing units: 20.9% — 448th lowest of 5,275 towns
> Median home value: $1,338,200 — 23rd highest of 5,198 towns

25. Mill Valley, California
> Median monthly rental cost: $2,694
> Share of income typically spent on rent: 27.2% — 1,789th lowest of 5,275 towns (tied)
> Rental occupied housing units: 34.1% — 1,873rd lowest of 5,275 towns
> Median home value: $1,625,400 — 13th highest of 5,198 towns
[in-text-ad]
24. Springs, New York
> Median monthly rental cost: $2,716
> Share of income typically spent on rent: 50.0%+ — the highest of 5,275 towns (tied)
> Rental occupied housing units: 24.0% — 677th lowest of 5,275 towns
> Median home value: $724,400 — 124th highest of 5,198 towns

23. Lincolnshire, Illinois
> Median monthly rental cost: $2,720
> Share of income typically spent on rent: 50.0%+ — the highest of 5,275 towns (tied)
> Rental occupied housing units: 16.7% — 207th lowest of 5,275 towns
> Median home value: $556,900 — 285th highest of 5,198 towns

22. Sausalito, California
> Median monthly rental cost: $2,721
> Share of income typically spent on rent: 24.5% — 863rd lowest of 5,275 towns (tied)
> Rental occupied housing units: 43.8% — 1,871st highest of 5,275 towns
> Median home value: $1,451,800 — 19th highest of 5,198 towns
[in-text-ad-2]
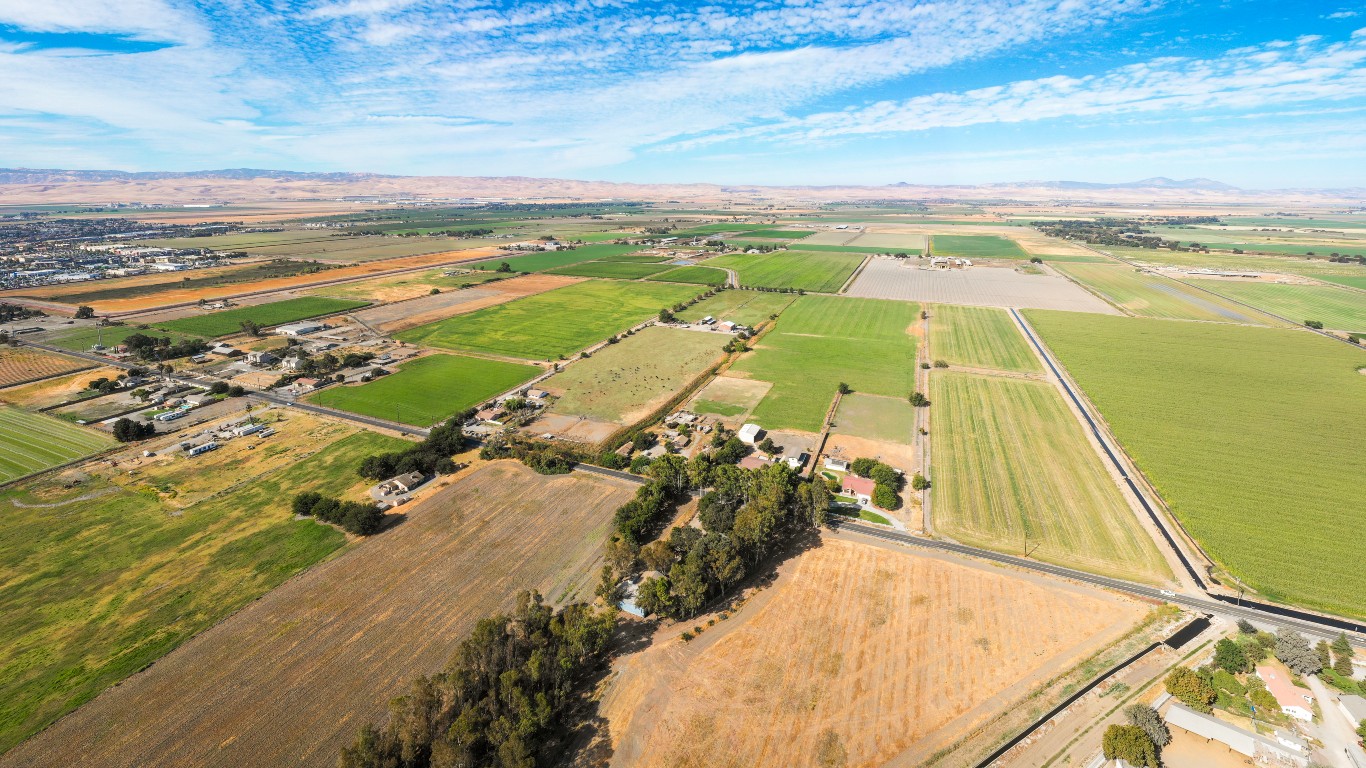
21. Mountain House, California
> Median monthly rental cost: $2,731
> Share of income typically spent on rent: 27.4% — 1,885th lowest of 5,275 towns (tied)
> Rental occupied housing units: 28.3% — 1,124th lowest of 5,275 towns
> Median home value: $629,600 — 200th highest of 5,198 towns

20. Malibu, California
> Median monthly rental cost: $2,743
> Share of income typically spent on rent: 21.5% — 224th lowest of 5,275 towns (tied)
> Rental occupied housing units: 21.7% — 510th lowest of 5,275 towns
> Median home value: $2,000,000+ — the highest of 5,198 towns (tied)
[in-text-ad]

19. Corte Madera, California
> Median monthly rental cost: $2,757
> Share of income typically spent on rent: 27.6% — 1,989th lowest of 5,275 towns (tied)
> Rental occupied housing units: 32.3% — 1,608th lowest of 5,275 towns
> Median home value: $1,290,100 — 26th highest of 5,198 towns

18. Fort Belvoir, Virginia
> Median monthly rental cost: $2,758
> Share of income typically spent on rent: 38.9% — 354th highest of 5,275 towns (tied)
> Rental occupied housing units: 98.3% — 59th highest of 5,275 towns
> Median home value: N/A

17. Rossmoor, California
> Median monthly rental cost: $2,777
> Share of income typically spent on rent: 30.6% — 1,962nd highest of 5,275 towns (tied)
> Rental occupied housing units: 13.7% — 89th lowest of 5,275 towns
> Median home value: $1,011,000 — 48th highest of 5,198 towns
[in-text-ad-2]

16. Palos Verdes Estates, California
> Median monthly rental cost: $2,787
> Share of income typically spent on rent: 26.6% — 1,560th lowest of 5,275 towns (tied)
> Rental occupied housing units: 12.1% — 51st lowest of 5,275 towns
> Median home value: $1,935,900 — 8th highest of 5,198 towns

15. Schofield Barracks, Hawaii
> Median monthly rental cost: $2,803
> Share of income typically spent on rent: 50.0%+ — the highest of 5,275 towns (tied)
> Rental occupied housing units: 99.4% — 43rd highest of 5,275 towns
> Median home value: N/A
[in-text-ad]
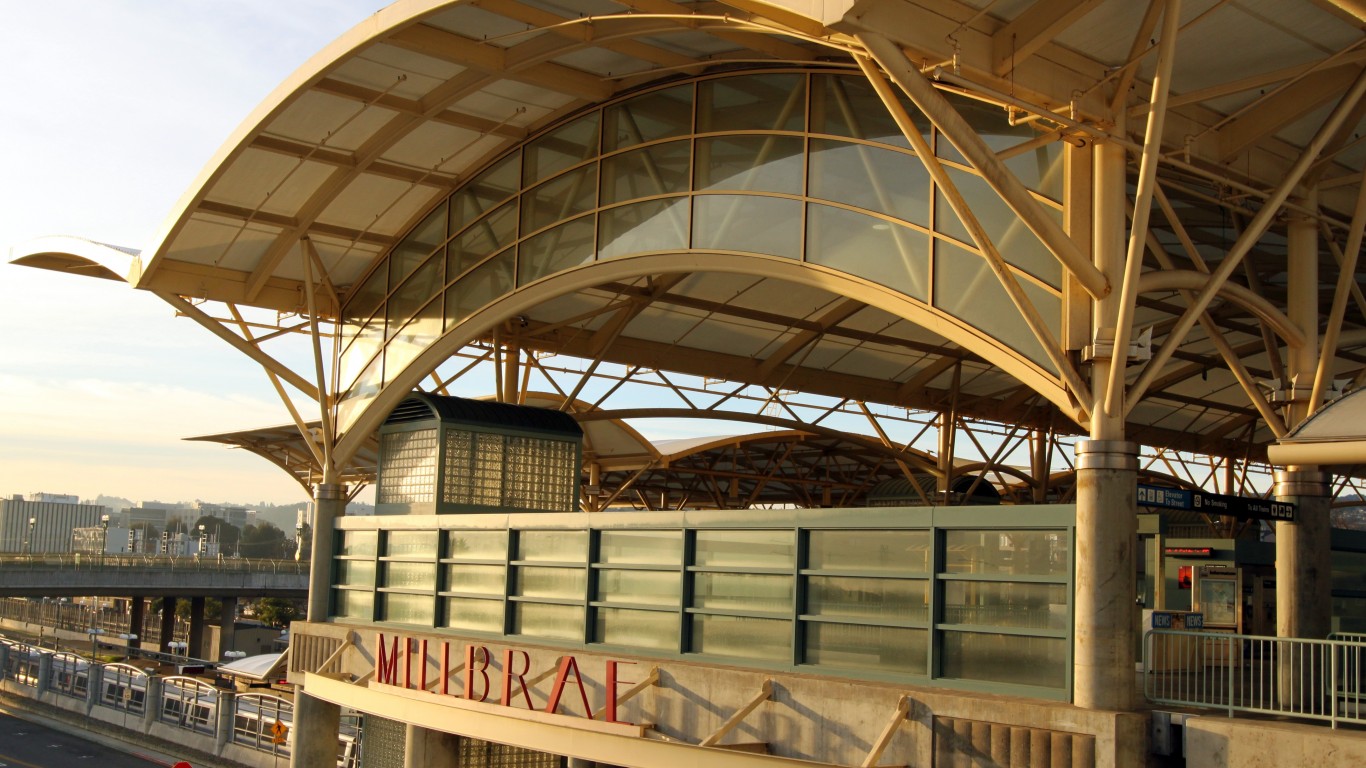
14. Millbrae, California
> Median monthly rental cost: $2,834
> Share of income typically spent on rent: 30.5% — 1,991st highest of 5,275 towns (tied)
> Rental occupied housing units: 36.8% — 2,297th lowest of 5,275 towns
> Median home value: $1,528,900 — 16th highest of 5,198 towns
13. Iroquois Point, Hawaii
> Median monthly rental cost: $2,912
> Share of income typically spent on rent: 37.7% — 462nd highest of 5,275 towns (tied)
> Rental occupied housing units: 100.0% — the highest of 5,275 towns (tied)
> Median home value: N/A
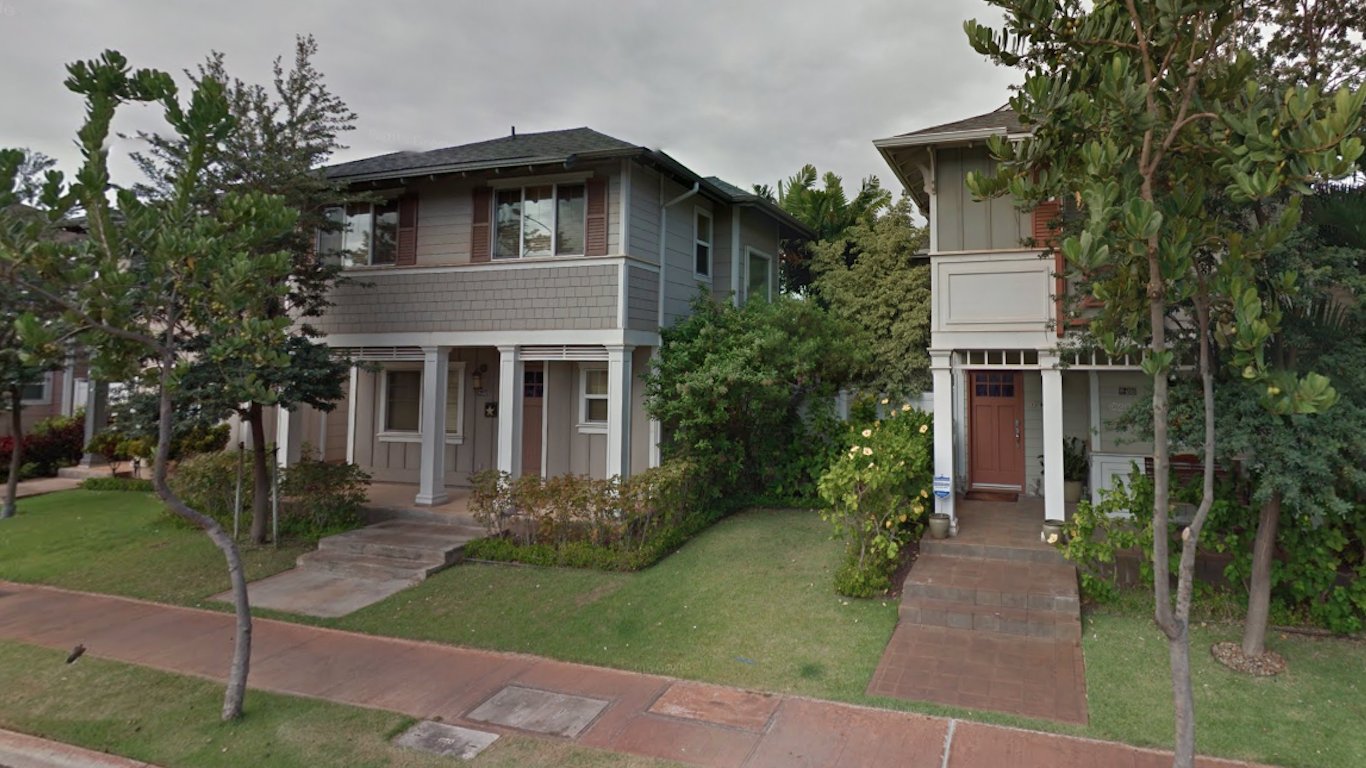
12. Ocean Pointe, Hawaii
> Median monthly rental cost: $2,987
> Share of income typically spent on rent: 36.4% — 609th highest of 5,275 towns (tied)
> Rental occupied housing units: 21.2% — 472nd lowest of 5,275 towns
> Median home value: $671,500 — 161st highest of 5,198 towns
[in-text-ad-2]

11. Kaneohe Base, Hawaii
> Median monthly rental cost: $3,027
> Share of income typically spent on rent: 50.0%+ — the highest of 5,275 towns (tied)
> Rental occupied housing units: 99.3% — 47th highest of 5,275 towns
> Median home value: N/A
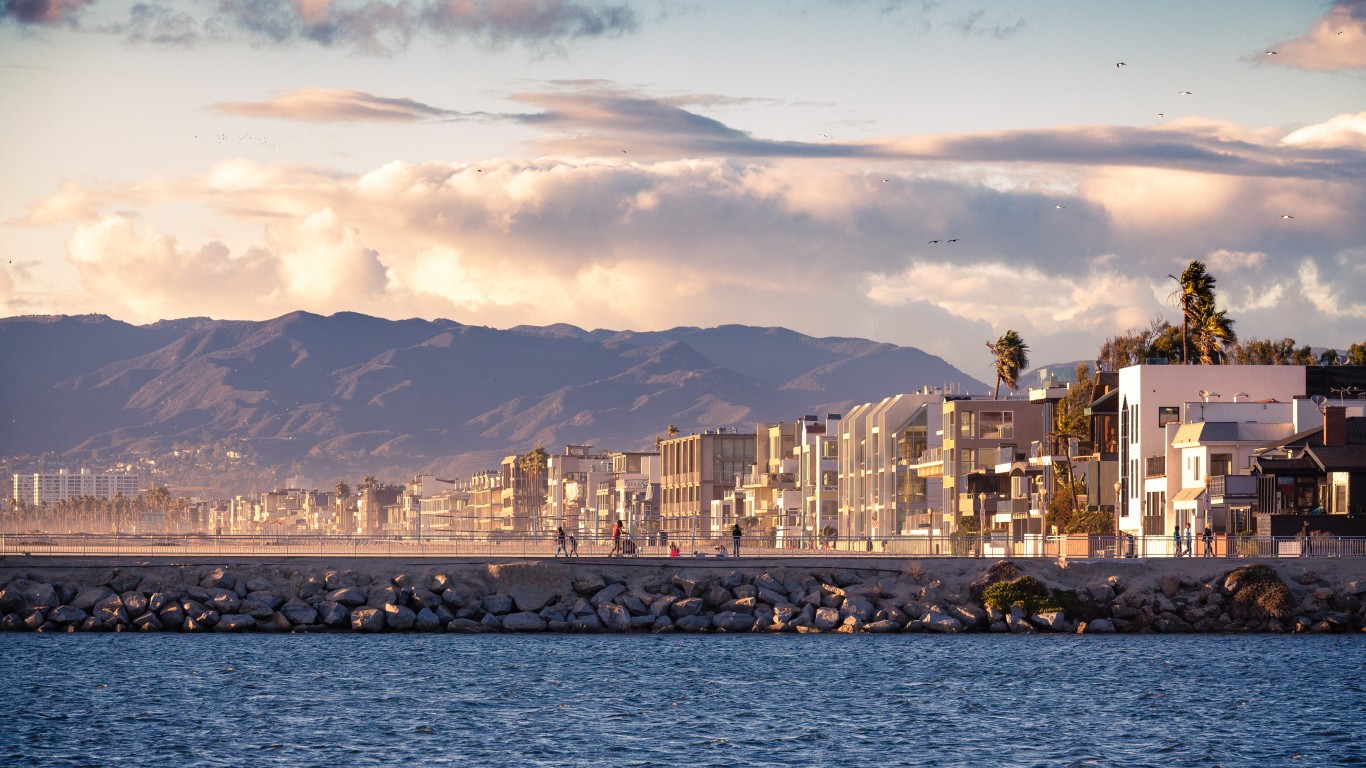
10. Marina del Rey, California
> Median monthly rental cost: $3,066
> Share of income typically spent on rent: 30.1% — 2,137th highest of 5,275 towns (tied)
> Rental occupied housing units: 95.7% — 69th highest of 5,275 towns
> Median home value: $893,100 — 64th highest of 5,198 towns
[in-text-ad]
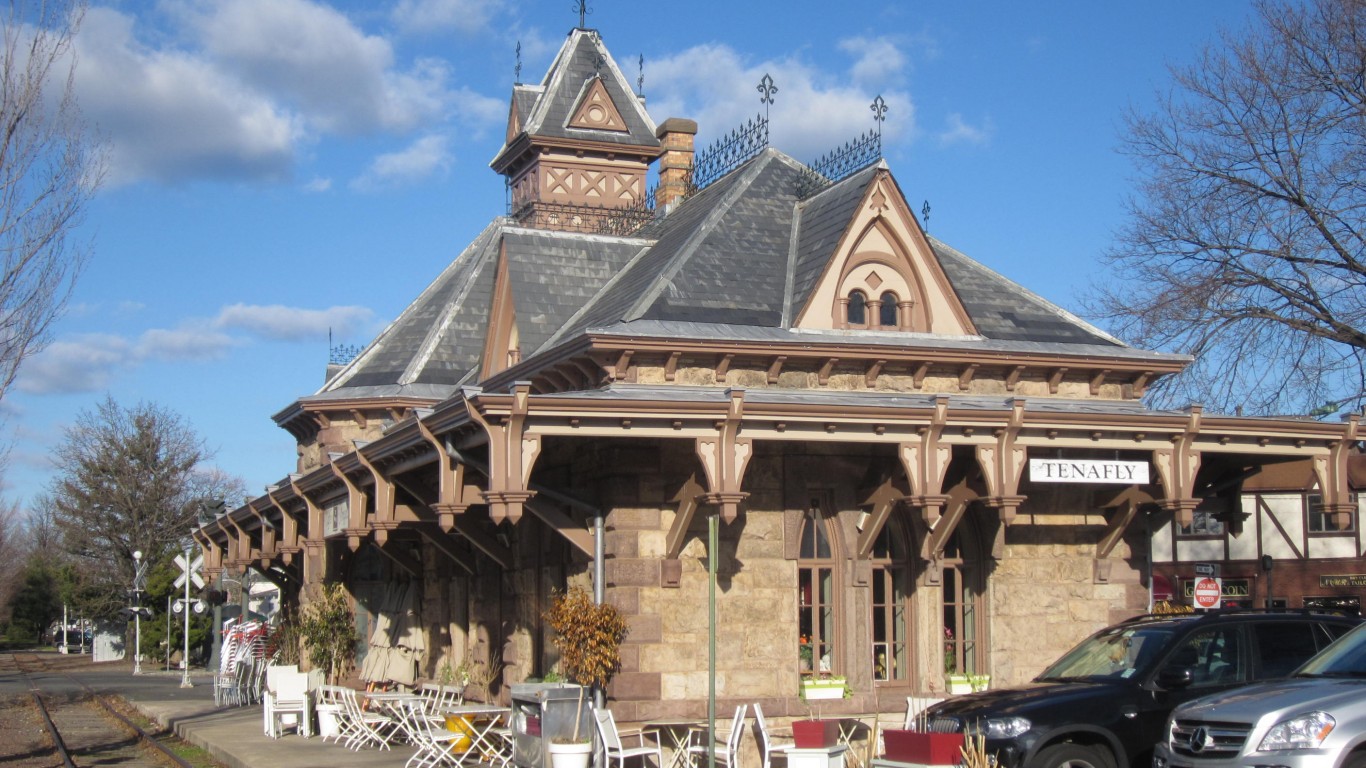
9. Tenafly, New Jersey
> Median monthly rental cost: $3,073
> Share of income typically spent on rent: 26.3% — 1,443rd lowest of 5,275 towns (tied)
> Rental occupied housing units: 21.3% — 481st lowest of 5,275 towns
> Median home value: $848,600 — 77th highest of 5,198 towns

8. West Point, New York
> Median monthly rental cost: $3,096
> Share of income typically spent on rent: 32.9% — 1,233rd highest of 5,275 towns (tied)
> Rental occupied housing units: 99.5% — 42nd highest of 5,275 towns
> Median home value: N/A
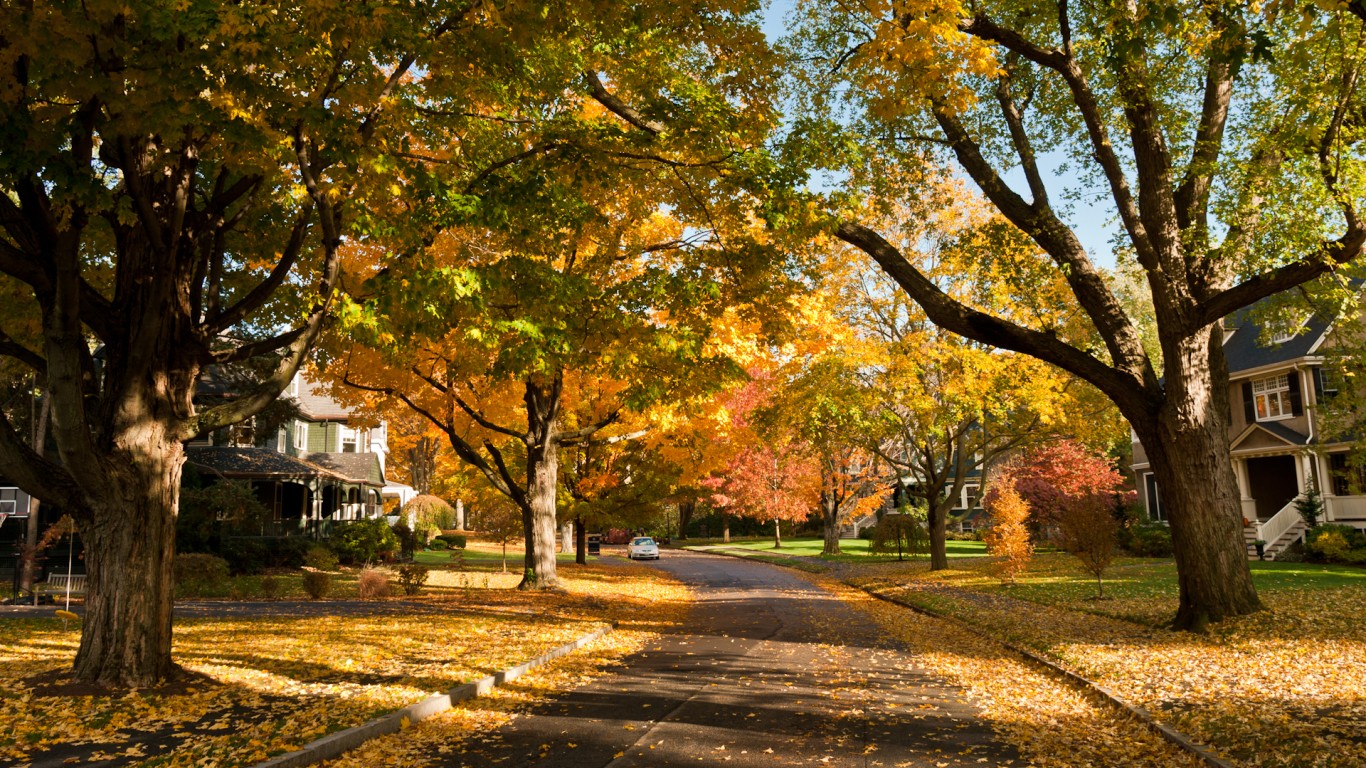
7. Hanscom AFB, Massachusetts
> Median monthly rental cost: $3,135
> Share of income typically spent on rent: 32.8% — 1,261st highest of 5,275 towns (tied)
> Rental occupied housing units: 100.0% — the highest of 5,275 towns (tied)
> Median home value: N/A
[in-text-ad-2]
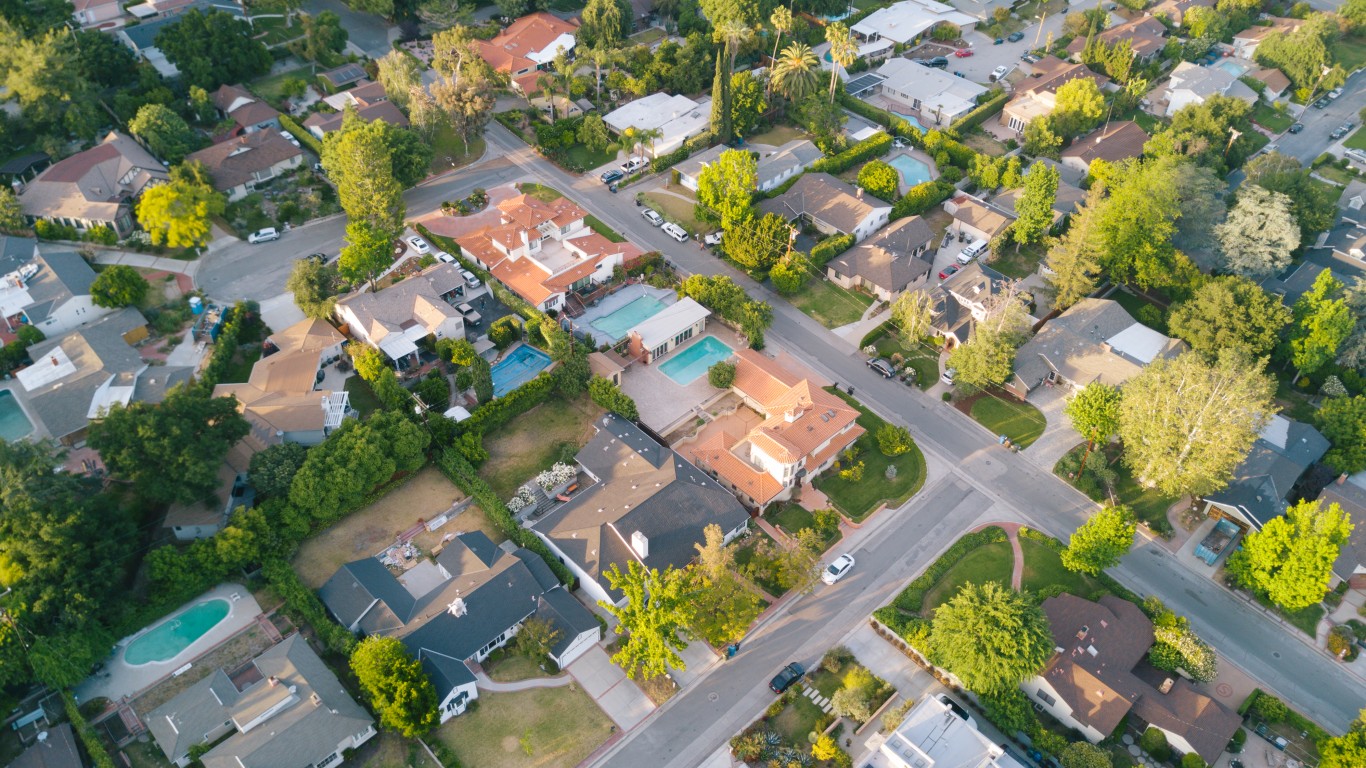
6. La Cañada Flintridge, California
> Median monthly rental cost: $3,186
> Share of income typically spent on rent: 32.9% — 1,233rd highest of 5,275 towns (tied)
> Rental occupied housing units: 11.9% — 46th lowest of 5,275 towns
> Median home value: $1,643,400 — 12th highest of 5,198 towns

5. Westlake Village, California
> Median monthly rental cost: $3,226
> Share of income typically spent on rent: 29.2% — 2,511th highest of 5,275 towns (tied)
> Rental occupied housing units: 20.0% — 389th lowest of 5,275 towns
> Median home value: $974,800 — 51st highest of 5,198 towns
[in-text-ad]

4. Hickam Housing, Hawaii
> Median monthly rental cost: $3,251
> Share of income typically spent on rent: 46.2% — 105th highest of 5,275 towns (tied)
> Rental occupied housing units: 100.0% — the highest of 5,275 towns (tied)
> Median home value: N/A

3. San Marino, California
> Median monthly rental cost: $3,500+
> Share of income typically spent on rent: 19.5% — 82nd lowest of 5,275 towns (tied)
> Rental occupied housing units: 15.5% — 157th lowest of 5,275 towns
> Median home value: $2,000,000+ — the highest of 5,198 towns (tied)
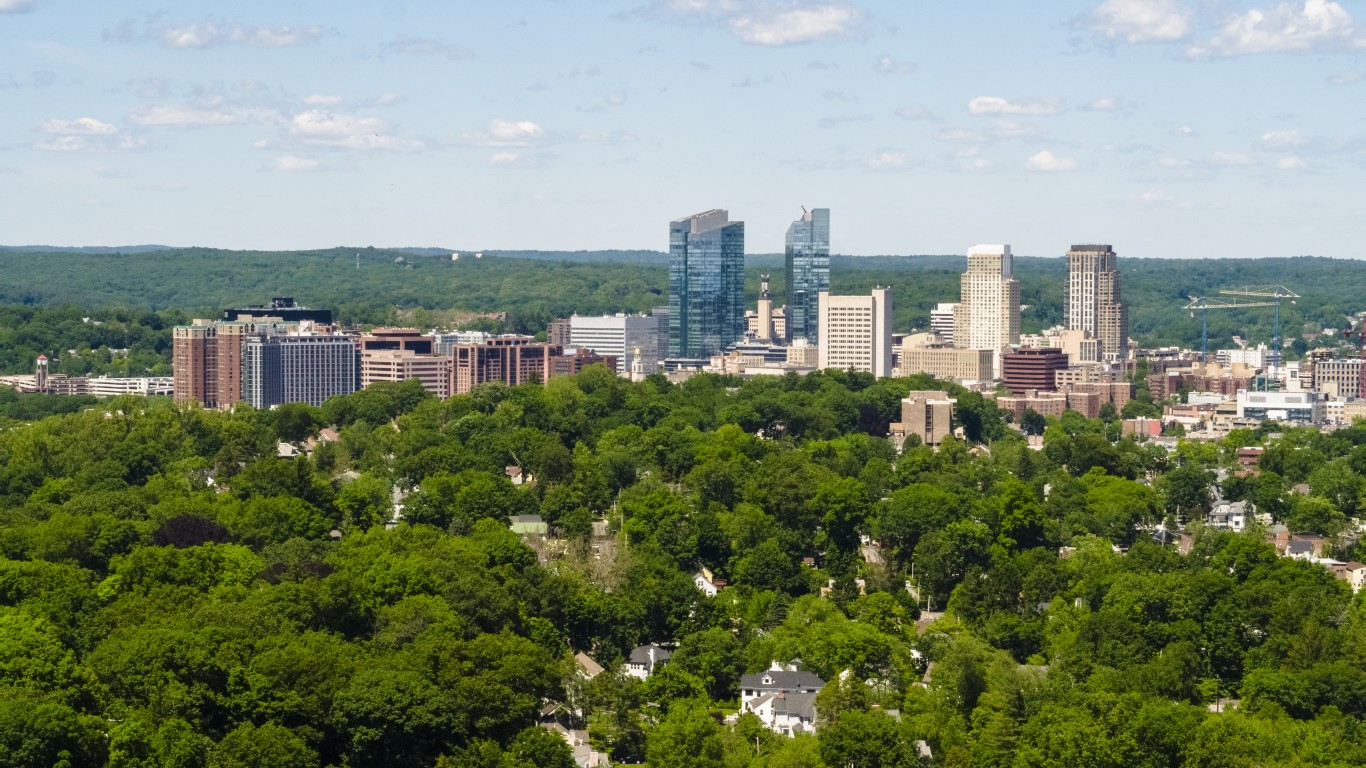
2. Scarsdale, New York
> Median monthly rental cost: $3,500+
> Share of income typically spent on rent: 25.7% — 1,225th lowest of 5,275 towns (tied)
> Rental occupied housing units: 13.4% — 82nd lowest of 5,275 towns
> Median home value: $1,473,200 — 18th highest of 5,198 towns
[in-text-ad-2]
1. Topanga, California
> Median monthly rental cost: $3,500+
> Share of income typically spent on rent: 36.3% — 623rd highest of 5,275 towns (tied)
> Rental occupied housing units: 25.1% — 785th lowest of 5,275 towns
> Median home value: $1,124,200 — 38th highest of 5,198 towns
Methodology
To determine the towns with the highest rent, 24/7 Wall St. reviewed five-year estimates of median gross rent from the U.S. Census Bureau’s 2020 American Community Survey.
We used census “place” geographies — a category that includes incorporated legal entities and census-designated statistical entities. We defined towns based on population thresholds — having at least 1,000 people and less than 25,000 people.
Towns were excluded if median gross rent was not available in the 2020 ACS, if there were fewer than 500 renter-occupied housing units, or if the sampling error associated with a town’s data was deemed too high.
The sampling error was defined as too high if the coefficient of variation — a statistical assessment of how reliable an estimate is — for a town’s median gross rent was above 15% and greater than two standard deviations above the mean CV for all towns’ median gross rents. We similarly excluded towns that had a sampling error too high for their population, using the same definition.
Towns were ranked based on the median gross rent. To break ties, we used the median gross rent as a share of household income.
Additional information on median gross rent as a share of household income, share of households occupied by renters, and median home value are also five-year estimates from the 2020 ACS.
Are You Ahead, or Behind on Retirement? (sponsor)
If you’re one of the over 4 Million Americans set to retire this year, you may want to pay attention.
Finding a financial advisor who puts your interest first can be the difference between a rich retirement and barely getting by, and today it’s easier than ever. SmartAsset’s free tool matches you with up to three fiduciary financial advisors that serve your area in minutes. Each advisor has been carefully vetted, and must act in your best interests. Start your search now.
Don’t waste another minute; get started right here and help your retirement dreams become a retirement reality.
Thank you for reading! Have some feedback for us?
Contact the 24/7 Wall St. editorial team.

 24/7 Wall St.
 24/7 Wall St.
 24/7 Wall St.