Special Report
States Where the Most People Don't Have Reliable Access to Food
Published:

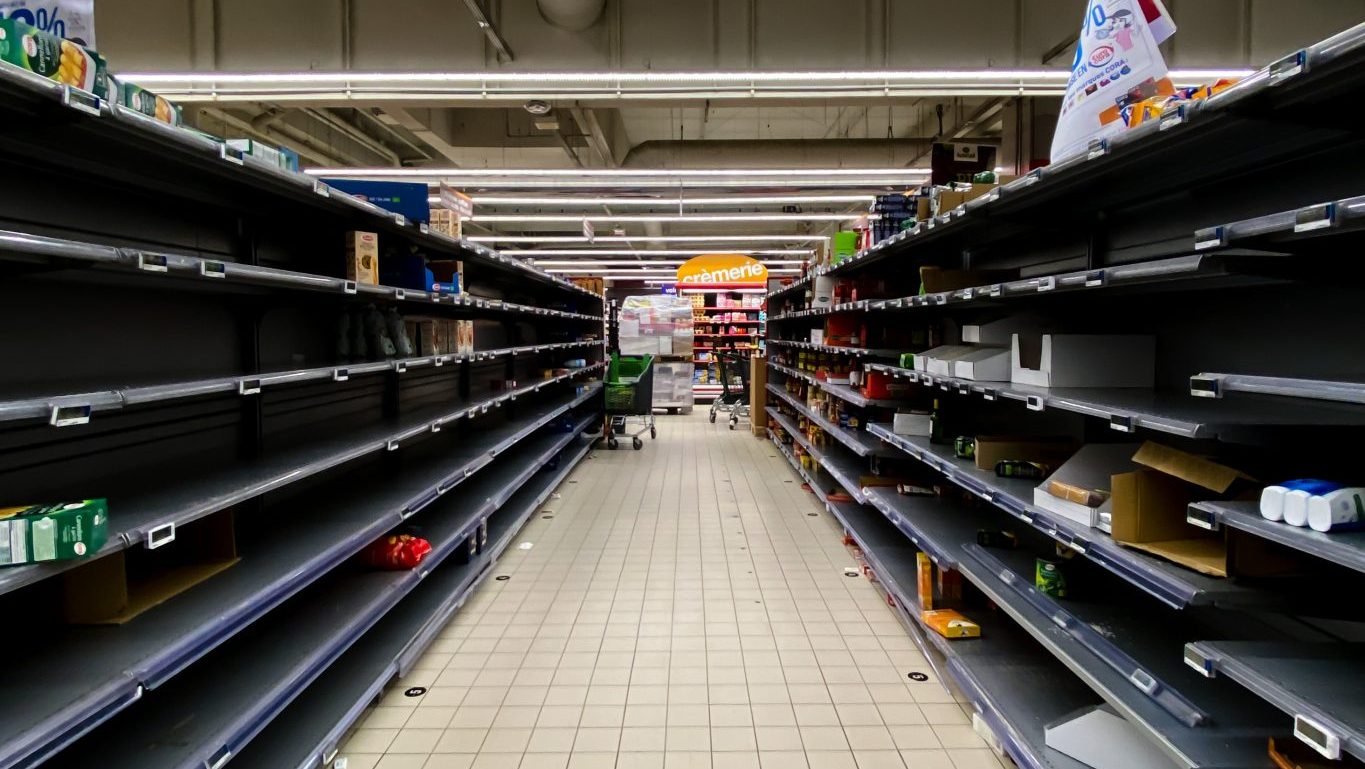
Food insecurity, defined by the USDA as the lack of consistent access to enough food to lead a healthy, active life, is a major issue facing America today. In fact, food insecurity is present in every community of every state in America, and there may be a lot more food insecure people in your state than you might realize. (These are the states with the most unreliable access to healthy food.)
According to Feeding America, in 2020, one in eight Americans, or about 38 million people, faced food insecurity. As opposed to hunger, which is the physical feeling of being hungry, food insecurity refers to the lack of means to access food at a household level, usually by way of poverty or living far away from the nearest grocery store.
To identify the states where the most people lack reliable access to food, 24/7 Wall St. reviewed data from State Level Estimates of Low Income and Low Access Populations for 2019, the most recent year for which data is available, published by the U.S. Department of Agriculture. We looked at the population in each state that is more than one mile away from a grocery store in an urban area and more than 20 miles away in a rural area. We looked at counties with populations greater than 10,000. Data was originally at the census tract level, then aggregated up to the county level. Low income population, number of housing units without a vehicle, and total population come from the USDA report. The poverty rate comes from the United States Census Bureau American Community Survey 2020 5-year estimates.
Perhaps surprisingly, food insecurity isn’t necessarily tied to poverty; people living above the poverty line may experience food insecurity while some living below it may not. Instead, there are many overlapping issues that can result in food insecurity, including social isolation, lack of affordable housing, structural racism, health issues, low wages, and high medical costs. (This is how much your state spends on your health.)
Click here to see the states where the most people don’t have reliable access to food

50. Vermont
> Low access pop.: 9.1% (56,917 total)
> Low income pop.: 166,113 residents, or 26.5% – 10th lowest
> Housing units without a vehicle: 17,260 households, or 6.7% – 25th lowest
> Poverty rate: 10.8% – 16th lowest
> Population: 625,741 – 2nd lowest
[in-text-ad]

49. Maine
> Low access pop.: 11.3% (150,558 total)
> Low income pop.: 393,885 residents, or 29.7% – 22nd lowest
> Housing units without a vehicle: 40,732 households, or 7.3% – 20th highest
> Poverty rate: 11.1% – 18th lowest
> Population: 1,328,361 – 10th lowest

48. New York
> Low access pop.: 11.6% (2,246,050 total)
> Low income pop.: 5,876,077 residents, or 30.3% – 24th lowest
> Housing units without a vehicle: 2,125,407 households, or 29.0% – the highest
> Poverty rate: 13.6% – 17th highest
> Population: 19,378,102 – 3rd highest

47. California
> Low access pop.: 12.9% (4,800,691 total)
> Low income pop.: 12,496,818 residents, or 33.5% – 20th highest
> Housing units without a vehicle: 939,034 households, or 7.5% – 18th highest
> Poverty rate: 12.6% – 24th highest
> Population: 37,253,956 – the highest
[in-text-ad-2]
46. Iowa
> Low access pop.: 14.8% (450,659 total)
> Low income pop.: 869,006 residents, or 28.5% – 17th lowest
> Housing units without a vehicle: 71,845 households, or 5.9% – 14th lowest
> Poverty rate: 11.1% – 19th lowest
> Population: 3,046,355 – 21st lowest

45. Oregon
> Low access pop.: 15.4% (591,783 total)
> Low income pop.: 1,302,201 residents, or 34.0% – 19th highest
> Housing units without a vehicle: 119,031 households, or 7.8% – 16th highest
> Poverty rate: 12.4% – 25th highest
> Population: 3,831,074 – 24th lowest
[in-text-ad]

44. Nebraska
> Low access pop.: 15.6% (285,014 total)
> Low income pop.: 540,602 residents, or 29.6% – 21st lowest
> Housing units without a vehicle: 40,465 households, or 5.6% – 9th lowest
> Poverty rate: 10.4% – 13th lowest
> Population: 1,826,341 – 13th lowest
43. Montana
> Low access pop.: 15.6% (154,449 total)
> Low income pop.: 341,224 residents, or 34.5% – 18th highest
> Housing units without a vehicle: 21,492 households, or 5.2% – 4th lowest
> Poverty rate: 12.8% – 22nd highest
> Population: 989,415 – 7th lowest

42. North Dakota
> Low access pop.: 17.0% (114,057 total)
> Low income pop.: 186,311 residents, or 27.7% – 13th lowest
> Housing units without a vehicle: 15,942 households, or 5.7% – 11th lowest
> Poverty rate: 10.5% – 14th lowest
> Population: 672,591 – 3rd lowest
[in-text-ad-2]

41. West Virginia
> Low access pop.: 17.6% (325,390 total)
> Low income pop.: 691,610 residents, or 37.3% – 13th highest
> Housing units without a vehicle: 63,583 households, or 8.3% – 11th highest
> Poverty rate: 17.1% – 4th highest
> Population: 1,852,994 – 14th lowest

40. Kentucky
> Low access pop.: 17.7% (766,759 total)
> Low income pop.: 1,621,650 residents, or 37.4% – 12th highest
> Housing units without a vehicle: 128,588 households, or 7.5% – 17th highest
> Poverty rate: 16.6% – 5th highest
> Population: 4,339,367 – 25th lowest
[in-text-ad]

39. South Dakota
> Low access pop.: 18.2% (148,460 total)
> Low income pop.: 247,813 residents, or 30.4% – 25th lowest
> Housing units without a vehicle: 17,251 households, or 5.4% – 6th lowest
> Poverty rate: 12.8% – 21st highest
> Population: 814,180 – 5th lowest

38. Illinois
> Low access pop.: 18.9% (2,421,121 total)
> Low income pop.: 3,684,930 residents, or 28.7% – 20th lowest
> Housing units without a vehicle: 522,807 households, or 10.8% – 5th highest
> Poverty rate: 12.0% – 25th lowest
> Population: 12,830,632 – 5th highest

37. Virginia
> Low access pop.: 18.9% (1,511,865 total)
> Low income pop.: 2,079,830 residents, or 26.0% – 9th lowest
> Housing units without a vehicle: 194,930 households, or 6.4% – 19th lowest
> Poverty rate: 10.0% – 10th lowest
> Population: 8,001,024 – 12th highest
[in-text-ad-2]
36. Wisconsin
> Low access pop.: 19.0% (1,081,548 total)
> Low income pop.: 1,592,396 residents, or 28.0% – 15th lowest
> Housing units without a vehicle: 158,139 households, or 6.9% – 23rd highest
> Poverty rate: 11.0% – 17th lowest
> Population: 5,686,986 – 20th highest

35. Arkansas
> Low access pop.: 19.1% (556,923 total)
> Low income pop.: 1,173,490 residents, or 40.2% – 3rd highest
> Housing units without a vehicle: 73,619 households, or 6.4% – 20th lowest
> Poverty rate: 16.1% – 6th highest
> Population: 2,915,918 – 19th lowest
[in-text-ad]

34. Colorado
> Low access pop.: 19.7% (992,490 total)
> Low income pop.: 1,435,234 residents, or 28.5% – 18th lowest
> Housing units without a vehicle: 108,846 households, or 5.5% – 8th lowest
> Poverty rate: 9.8% – 7th lowest
> Population: 5,029,196 – 22nd highest

33. Mississippi
> Low access pop.: 19.9% (591,661 total)
> Low income pop.: 1,245,447 residents, or 42.0% – the highest
> Housing units without a vehicle: 71,851 households, or 6.4% – 21st lowest
> Poverty rate: 19.6% – the highest
> Population: 2,967,297 – 20th lowest

32. Oklahoma
> Low access pop.: 20.2% (758,133 total)
> Low income pop.: 1,405,560 residents, or 37.5% – 11th highest
> Housing units without a vehicle: 82,050 households, or 5.6% – 10th lowest
> Poverty rate: 15.3% – 8th highest
> Population: 3,751,351 – 23rd lowest
[in-text-ad-2]

31. Pennsylvania
> Low access pop.: 20.9% (2,655,938 total)
> Low income pop.: 3,591,839 residents, or 28.3% – 16th lowest
> Housing units without a vehicle: 552,690 households, or 11.0% – 4th highest
> Poverty rate: 12.0% – 24th lowest
> Population: 12,702,379 – 6th highest

30. Kansas
> Low access pop.: 21.1% (600,805 total)
> Low income pop.: 864,616 residents, or 30.3% – 23rd lowest
> Housing units without a vehicle: 60,736 households, or 5.5% – 7th lowest
> Poverty rate: 11.4% – 21st lowest
> Population: 2,853,118 – 18th lowest
[in-text-ad]

29. Washington
> Low access pop.: 21.9% (1,470,790 total)
> Low income pop.: 1,923,530 residents, or 28.6% – 19th lowest
> Housing units without a vehicle: 192,165 households, or 7.3% – 19th highest
> Poverty rate: 10.2% – 11th lowest
> Population: 6,724,540 – 13th highest

28. Missouri
> Low access pop.: 21.9% (1,312,874 total)
> Low income pop.: 1,947,248 residents, or 32.5% – 21st highest
> Housing units without a vehicle: 167,384 households, or 7.0% – 22nd highest
> Poverty rate: 13.0% – 19th highest
> Population: 5,988,927 – 18th highest
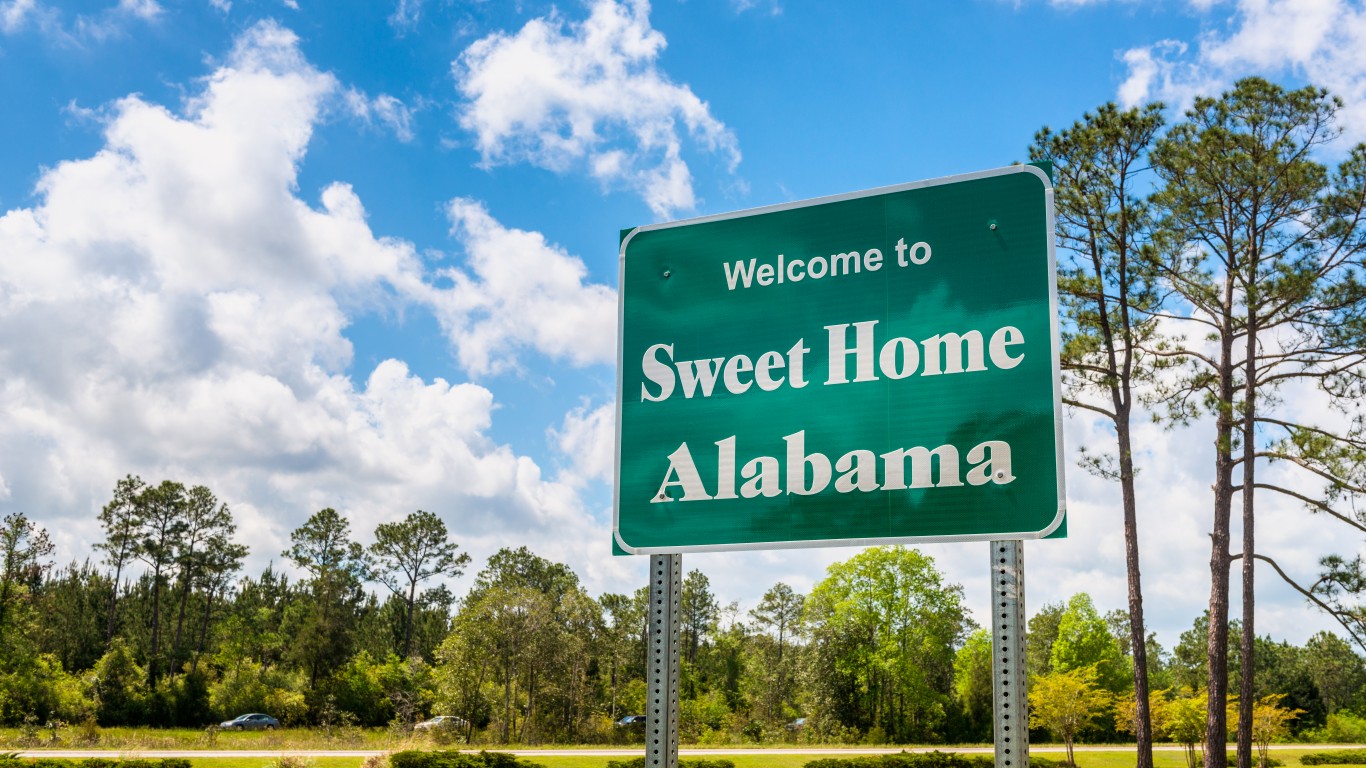
27. Alabama
> Low access pop.: 21.9% (1,048,926 total)
> Low income pop.: 1,792,925 residents, or 37.5% – 10th highest
> Housing units without a vehicle: 115,360 households, or 6.1% – 16th lowest
> Poverty rate: 16.0% – 7th highest
> Population: 4,779,736 – 23rd highest
[in-text-ad-2]

26. Nevada
> Low access pop.: 22.1% (596,478 total)
> Low income pop.: 967,592 residents, or 35.8% – 17th highest
> Housing units without a vehicle: 81,930 households, or 8.1% – 14th highest
> Poverty rate: 12.8% – 23rd highest
> Population: 2,700,551 – 16th lowest

25. North Carolina
> Low access pop.: 22.1% (2,110,561 total)
> Low income pop.: 3,513,670 residents, or 36.8% – 15th highest
> Housing units without a vehicle: 231,826 households, or 6.2% – 17th lowest
> Poverty rate: 14.0% – 14th highest
> Population: 9,535,483 – 10th highest
[in-text-ad]
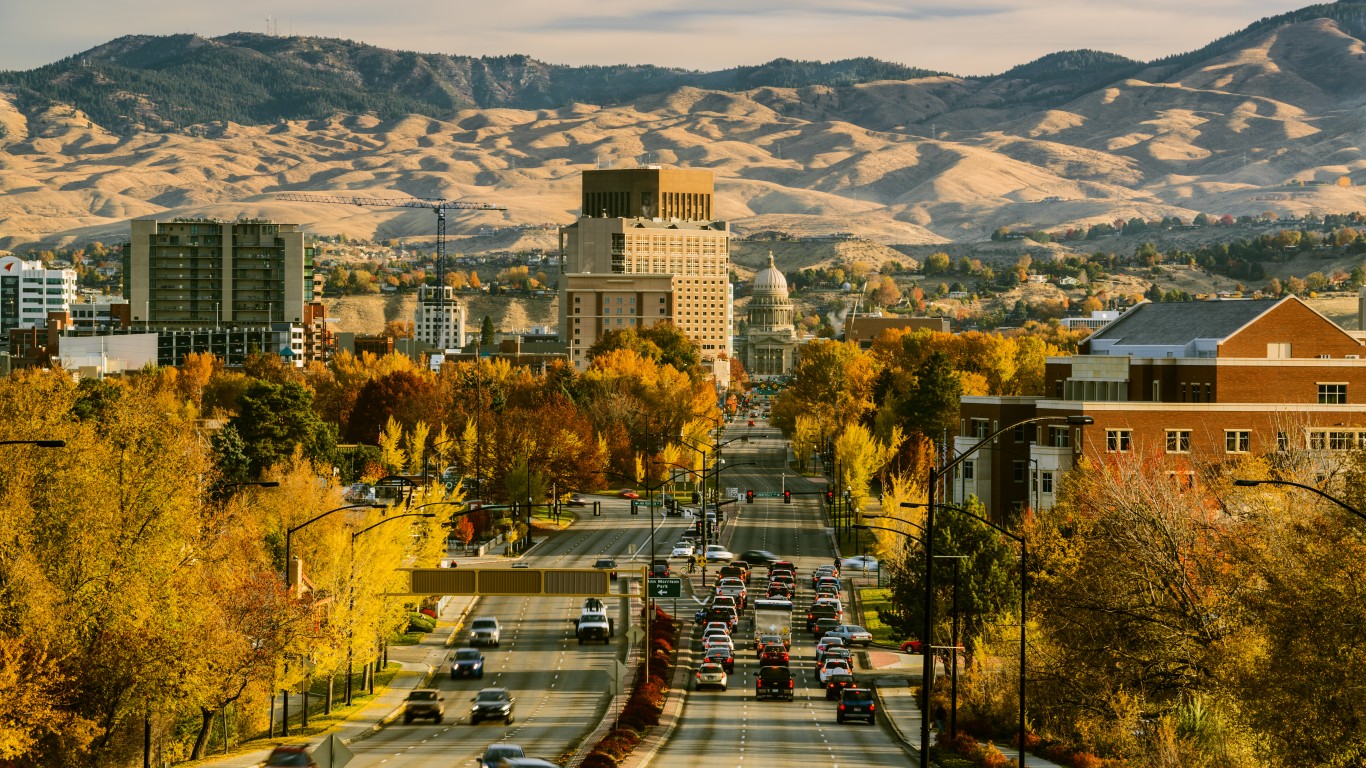
24. Idaho
> Low access pop.: 22.3% (350,213 total)
> Low income pop.: 588,678 residents, or 37.6% – 9th highest
> Housing units without a vehicle: 24,389 households, or 4.2% – 2nd lowest
> Poverty rate: 11.9% – 23rd lowest
> Population: 1,567,582 – 12th lowest

23. Michigan
> Low access pop.: 22.5% (2,221,200 total)
> Low income pop.: 3,177,868 residents, or 32.2% – 23rd highest
> Housing units without a vehicle: 305,124 households, or 7.9% – 15th highest
> Poverty rate: 13.7% – 15th highest
> Population: 9,883,640 – 8th highest

22. Maryland
> Low access pop.: 22.6% (1,305,275 total)
> Low income pop.: 1,305,796 residents, or 22.6% – 3rd lowest
> Housing units without a vehicle: 196,253 households, or 9.1% – 7th highest
> Poverty rate: 9.0% – 2nd lowest
> Population: 5,773,552 – 19th highest
[in-text-ad-2]

21. Utah
> Low access pop.: 22.9% (632,616 total)
> Low income pop.: 843,500 residents, or 30.5% – 25th highest
> Housing units without a vehicle: 39,488 households, or 4.5% – 3rd lowest
> Poverty rate: 9.1% – 3rd lowest
> Population: 2,763,885 – 17th lowest

20. Texas
> Low access pop.: 23.3% (5,847,089 total)
> Low income pop.: 9,642,118 residents, or 38.3% – 5th highest
> Housing units without a vehicle: 512,772 households, or 5.7% – 13th lowest
> Poverty rate: 14.2% – 12th highest
> Population: 25,145,561 – 2nd highest
[in-text-ad]

19. Louisiana
> Low access pop.: 23.3% (1,056,783 total)
> Low income pop.: 1,789,526 residents, or 39.5% – 4th highest
> Housing units without a vehicle: 145,898 households, or 8.4% – 10th highest
> Poverty rate: 18.6% – 2nd highest
> Population: 4,533,372 – 25th highest

18. Rhode Island
> Low access pop.: 23.5% (247,593 total)
> Low income pop.: 288,025 residents, or 27.4% – 11th lowest
> Housing units without a vehicle: 39,631 households, or 9.6% – 6th highest
> Poverty rate: 11.6% – 22nd lowest
> Population: 1,052,567 – 8th lowest

17. Minnesota
> Low access pop.: 23.6% (1,251,793 total)
> Low income pop.: 1,329,035 residents, or 25.1% – 8th lowest
> Housing units without a vehicle: 148,982 households, or 7.1% – 21st highest
> Poverty rate: 9.3% – 5th lowest
> Population: 5,303,925 – 21st highest
[in-text-ad-2]

16. New Jersey
> Low access pop.: 23.7% (2,083,396 total)
> Low income pop.: 2,055,593 residents, or 23.4% – 5th lowest
> Housing units without a vehicle: 367,761 households, or 11.4% – 3rd highest
> Poverty rate: 9.7% – 6th lowest
> Population: 8,791,894 – 11th highest
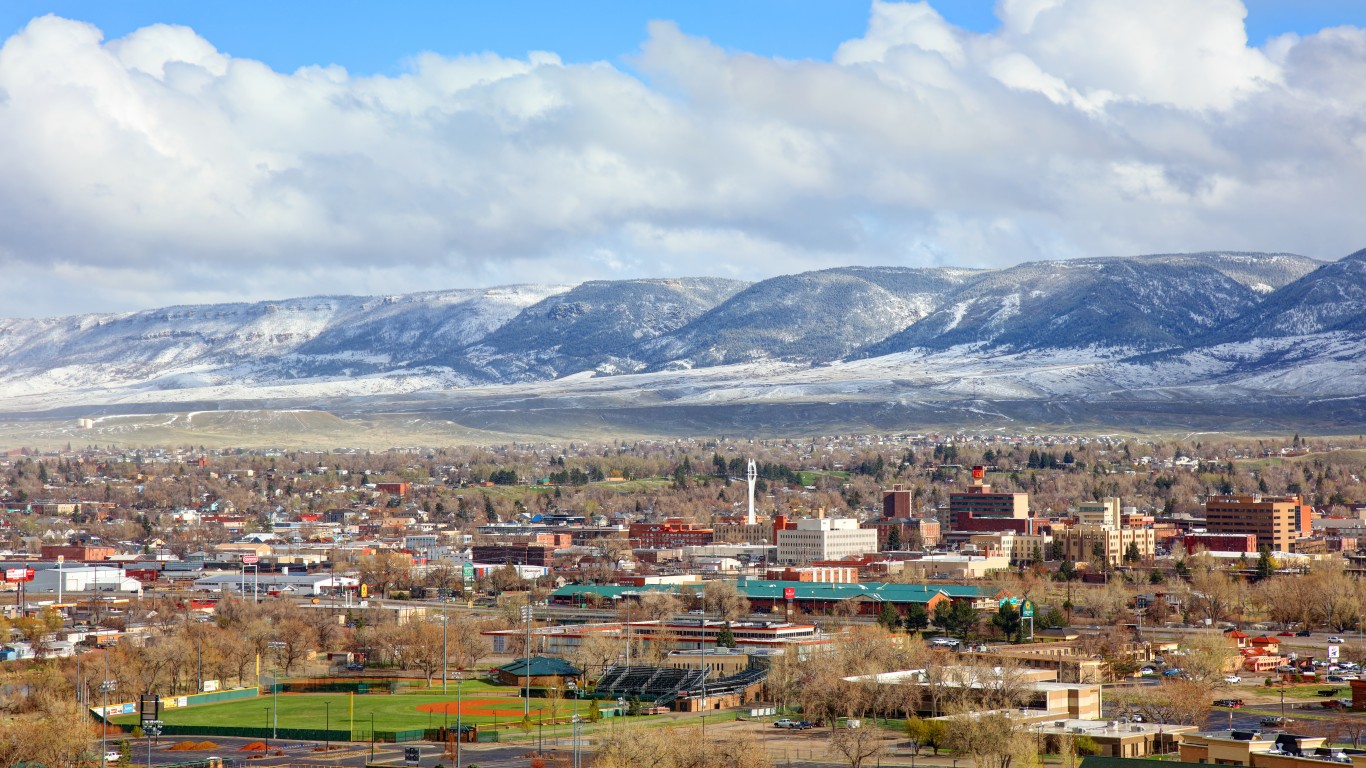
15. Wyoming
> Low access pop.: 23.9% (134,470 total)
> Low income pop.: 156,554 residents, or 27.8% – 14th lowest
> Housing units without a vehicle: 8,873 households, or 3.9% – the lowest
> Poverty rate: 10.8% – 15th lowest
> Population: 563,626 – the lowest
[in-text-ad]

14. Florida
> Low access pop.: 24.4% (4,594,571 total)
> Low income pop.: 7,137,086 residents, or 38.0% – 7th highest
> Housing units without a vehicle: 493,915 households, or 6.7% – 23rd lowest
> Poverty rate: 13.3% – 18th highest
> Population: 18,801,310 – 4th highest
13. Arizona
> Low access pop.: 24.5% (1,568,594 total)
> Low income pop.: 2,435,260 residents, or 38.1% – 6th highest
> Housing units without a vehicle: 160,011 households, or 6.7% – 24th lowest
> Poverty rate: 14.1% – 13th highest
> Population: 6,392,017 – 16th highest

12. Ohio
> Low access pop.: 24.6% (2,832,680 total)
> Low income pop.: 3,617,825 residents, or 31.4% – 24th highest
> Housing units without a vehicle: 380,845 households, or 8.3% – 12th highest
> Poverty rate: 13.6% – 16th highest
> Population: 11,536,504 – 7th highest
[in-text-ad-2]
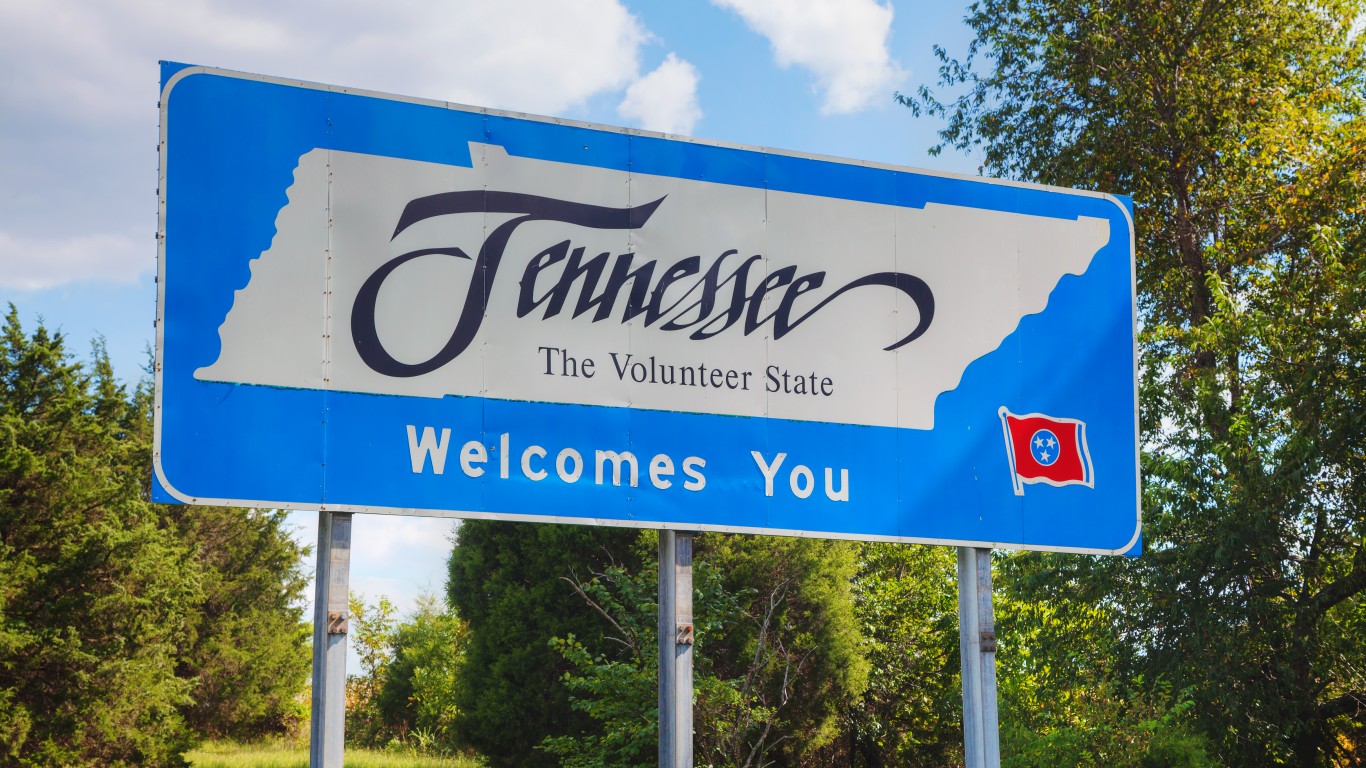
11. Tennessee
> Low access pop.: 25.9% (1,642,693 total)
> Low income pop.: 2,360,988 residents, or 37.2% – 14th highest
> Housing units without a vehicle: 151,711 households, or 6.1% – 15th lowest
> Poverty rate: 14.6% – 10th highest
> Population: 6,346,105 – 17th highest

10. Hawaii
> Low access pop.: 25.9% (352,168 total)
> Low income pop.: 318,168 residents, or 23.4% – 6th lowest
> Housing units without a vehicle: 37,579 households, or 8.3% – 13th highest
> Poverty rate: 9.3% – 4th lowest
> Population: 1,360,301 – 11th lowest
[in-text-ad]

9. New Hampshire
> Low access pop.: 26.7% (351,370 total)
> Low income pop.: 261,057 residents, or 19.8% – the lowest
> Housing units without a vehicle: 27,300 households, or 5.3% – 5th lowest
> Poverty rate: 7.4% – the lowest
> Population: 1,316,470 – 9th lowest
8. South Carolina
> Low access pop.: 27.1% (1,251,577 total)
> Low income pop.: 1,754,091 residents, or 37.9% – 8th highest
> Housing units without a vehicle: 122,421 households, or 6.8% – 25th highest
> Poverty rate: 14.7% – 9th highest
> Population: 4,625,364 – 24th highest

7. New Mexico
> Low access pop.: 27.2% (560,505 total)
> Low income pop.: 839,986 residents, or 40.8% – 2nd highest
> Housing units without a vehicle: 45,052 households, or 5.7% – 12th lowest
> Poverty rate: 18.6% – 3rd highest
> Population: 2,059,179 – 15th lowest
[in-text-ad-2]

6. Delaware
> Low access pop.: 27.3% (245,116 total)
> Low income pop.: 246,724 residents, or 27.5% – 12th lowest
> Housing units without a vehicle: 21,698 households, or 6.3% – 18th lowest
> Poverty rate: 11.4% – 20th lowest
> Population: 897,934 – 6th lowest

5. Indiana
> Low access pop.: 27.6% (1,790,458 total)
> Low income pop.: 2,096,089 residents, or 32.3% – 22nd highest
> Housing units without a vehicle: 166,509 households, or 6.7% – 22nd lowest
> Poverty rate: 12.9% – 20th highest
> Population: 6,483,802 – 15th highest
[in-text-ad]

4. Massachusetts
> Low access pop.: 27.7% (1,813,321 total)
> Low income pop.: 1,526,696 residents, or 23.3% – 4th lowest
> Housing units without a vehicle: 323,287 households, or 12.7% – 2nd highest
> Poverty rate: 9.8% – 9th lowest
> Population: 6,547,629 – 14th highest
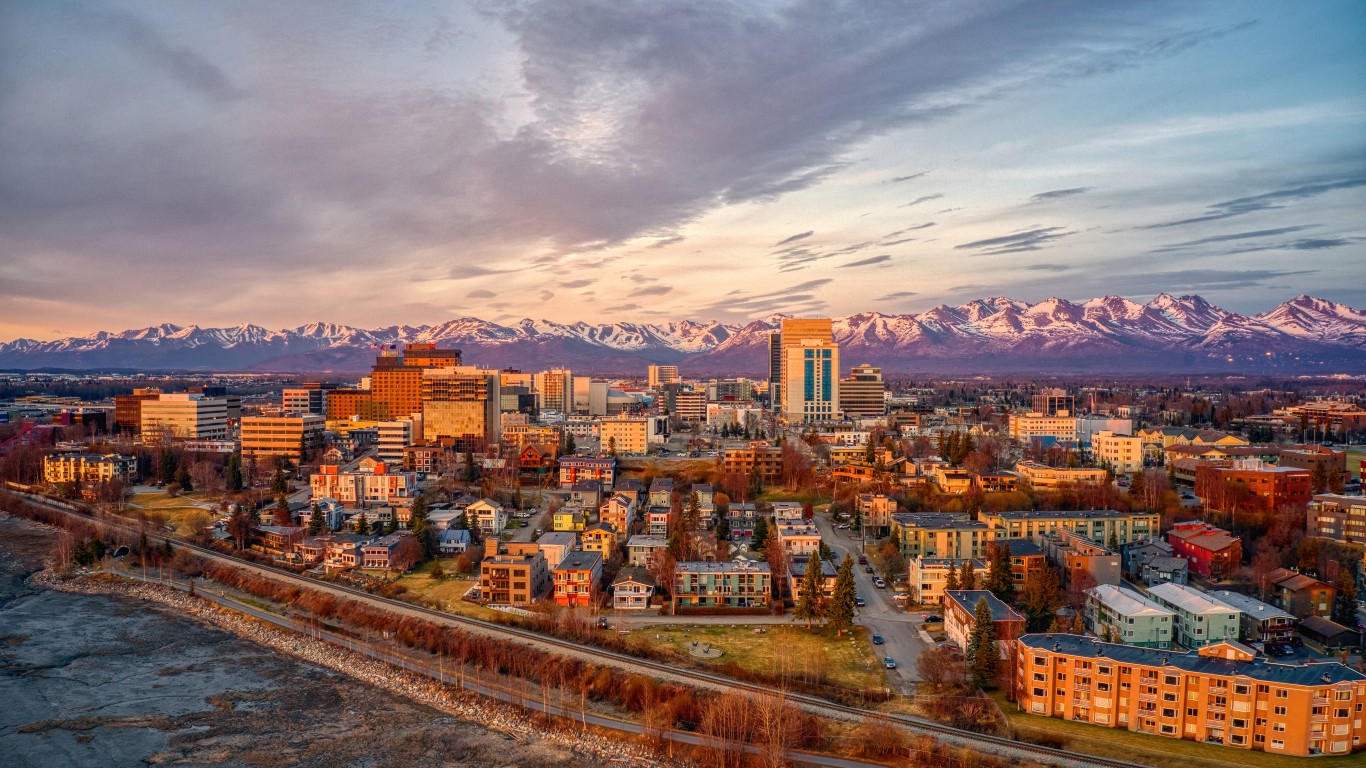
3. Alaska
> Low access pop.: 28.0% (198,821 total)
> Low income pop.: 176,953 residents, or 24.9% – 7th lowest
> Housing units without a vehicle: 22,474 households, or 8.7% – 9th highest
> Poverty rate: 10.3% – 12th lowest
> Population: 710,231 – 4th lowest

2. Connecticut
> Low access pop.: 29.3% (1,045,982 total)
> Low income pop.: 796,272 residents, or 22.3% – 2nd lowest
> Housing units without a vehicle: 121,241 households, or 8.8% – 8th highest
> Poverty rate: 9.8% – 8th lowest
> Population: 3,574,097 – 22nd lowest
[in-text-ad-2]

1. Georgia
> Low access pop.: 29.8% (2,889,295 total)
> Low income pop.: 3,568,179 residents, or 36.8% – 16th highest
> Housing units without a vehicle: 245,022 households, or 6.8% – 24th highest
> Poverty rate: 14.3% – 11th highest
> Population: 9,687,653 – 9th highest
Credit card companies are at war, handing out free rewards and benefits to win the best customers. A good cash back card can be worth thousands of dollars a year in free money, not to mention other perks like travel, insurance, and access to fancy lounges. See our top picks for the best credit cards today. You won’t want to miss some of these offers.
Flywheel Publishing has partnered with CardRatings for our coverage of credit card products. Flywheel Publishing and CardRatings may receive a commission from card issuers.
Thank you for reading! Have some feedback for us?
Contact the 24/7 Wall St. editorial team.