The United States is one of the few countries in the world that does not guarantee the right to a public education. In the absence of comprehensive federal legislation, school policy – including budgetary considerations – is largely set at the state and local levels.
This system has resulted in significant disparities in public education spending. While some states invest an average of $20,000 or more per pupil annually, others spend as little $8,000 per student.
Using data from the U.S. Department of Education’s National Center for Education Statistics for the 2018-2019 school year, 24/7 Wall St. reviewed average per pupil spending in each state.
States with the highest per pupil spending are concentrated in the Northeast, while those with the lowest per pupil spending are disproportionately concentrated in the South and West. The link between per pupil spending and school quality is complicated, but while there are some notable exceptions, many of the states spending the most on their public schools also have some best student outcomes and highest quality schools in the country. Here is a look at the state with the best schools.
It is important to note that even within states, per pupil spending can vary considerably from district to district. These disparities within a state can result from several factors, including the presence of special needs and English-language learning classrooms, which require higher spending, and perhaps most importantly, geography and student body size. Larger urban districts generally benefit from an economy of scale, while smaller, often rural districts have fewer students over which to spread the cost of infrastructure, instruction, and transportation. Here is a look at the states that pay their teachers the least.
School spending at the district level is also impacted by local economic factors. Because public school districts are funded largely by property taxes, school systems in lower-income areas have a weaker tax base to draw from. Still, every state takes measures to offset these disparities and equalize funding to some degree.
Click to see the states spending the most on education
Click here to read our detailed methodology
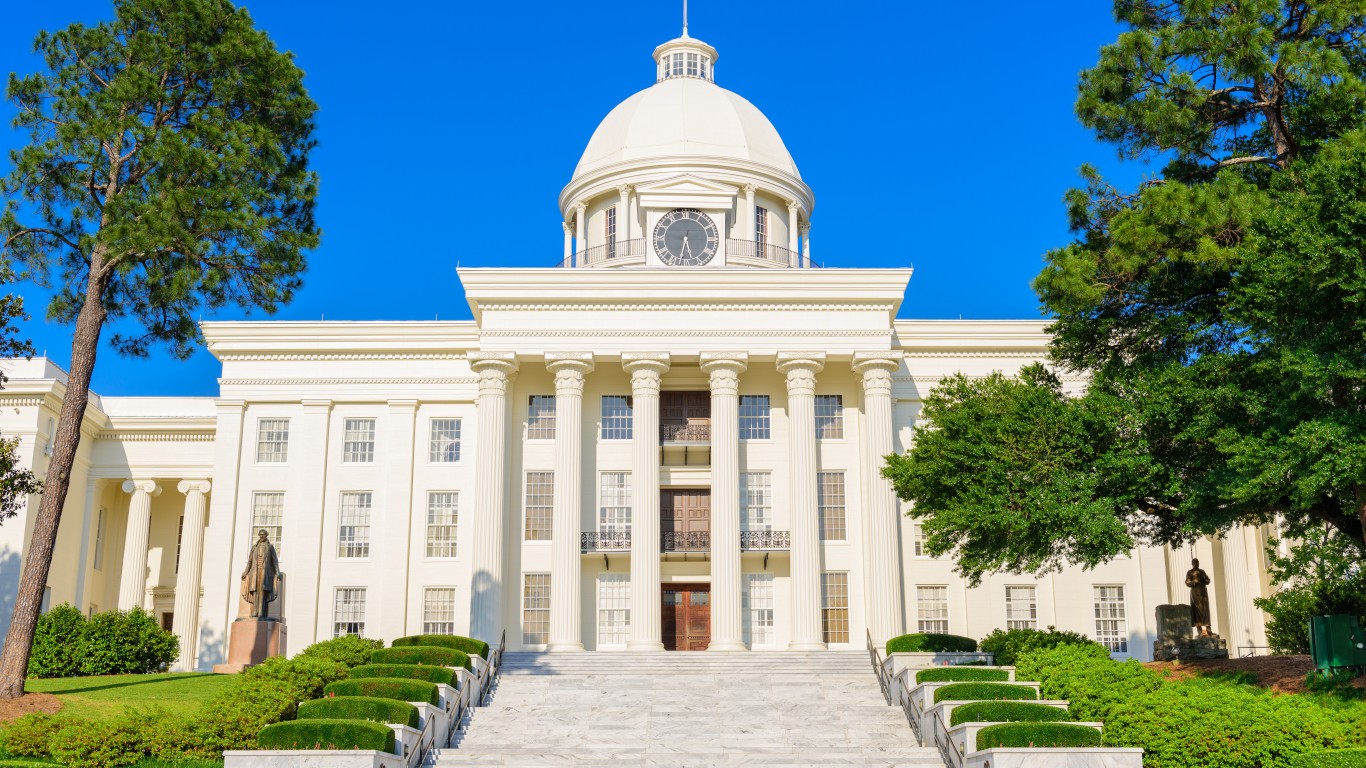
Alabama
> Average statewide spending (2018-2019 school year): $10,077 per pupil (12th lowest)
> Top spending district: Lowndes County ($15,440 per pupil)
> Lowest spending district: Eufaula City ($5,298 per pupil)
[in-text-ad]
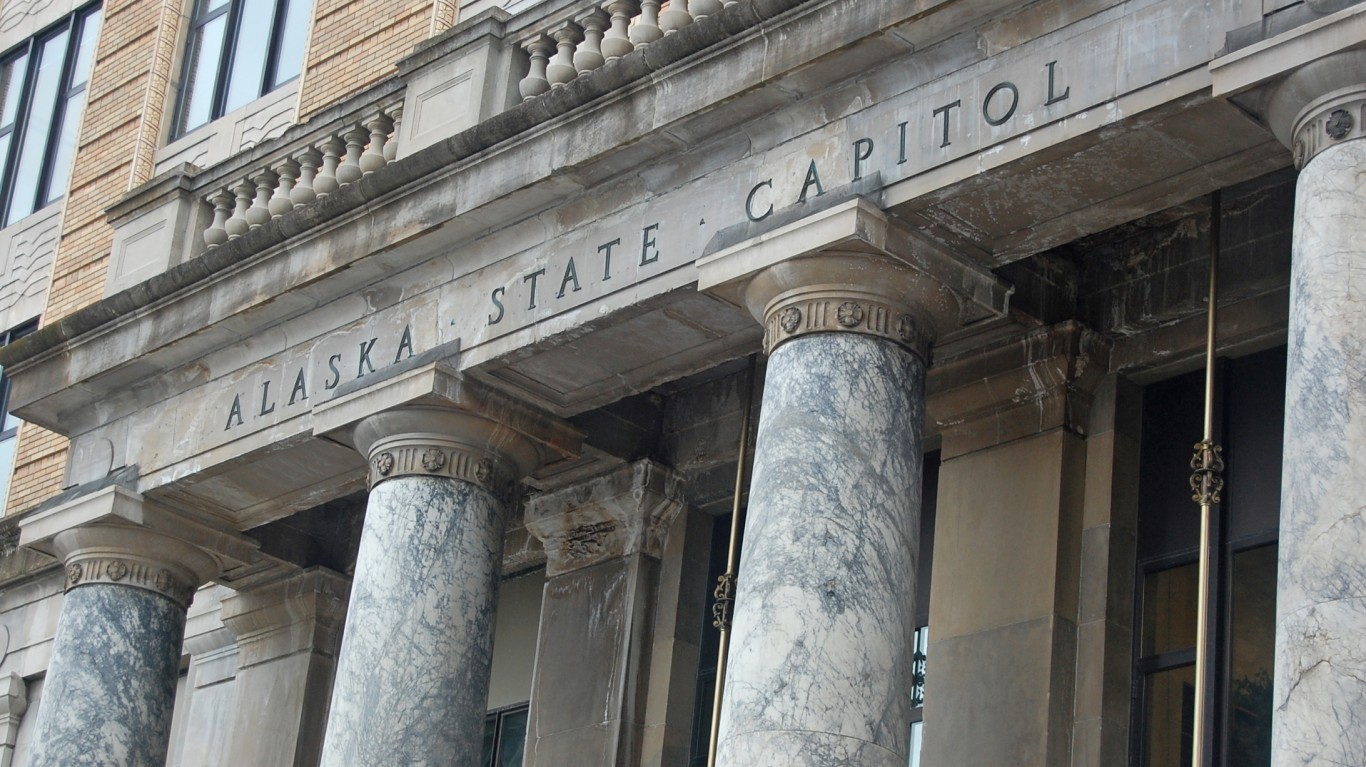
Alaska
> Average statewide spending (2018-2019 school year): $18,172 per pupil (4th highest)
> Top spending district: Yukon Flats School District ($52,189 per pupil)
> Lowest spending district: Galena City School District ($6,621 per pupil)
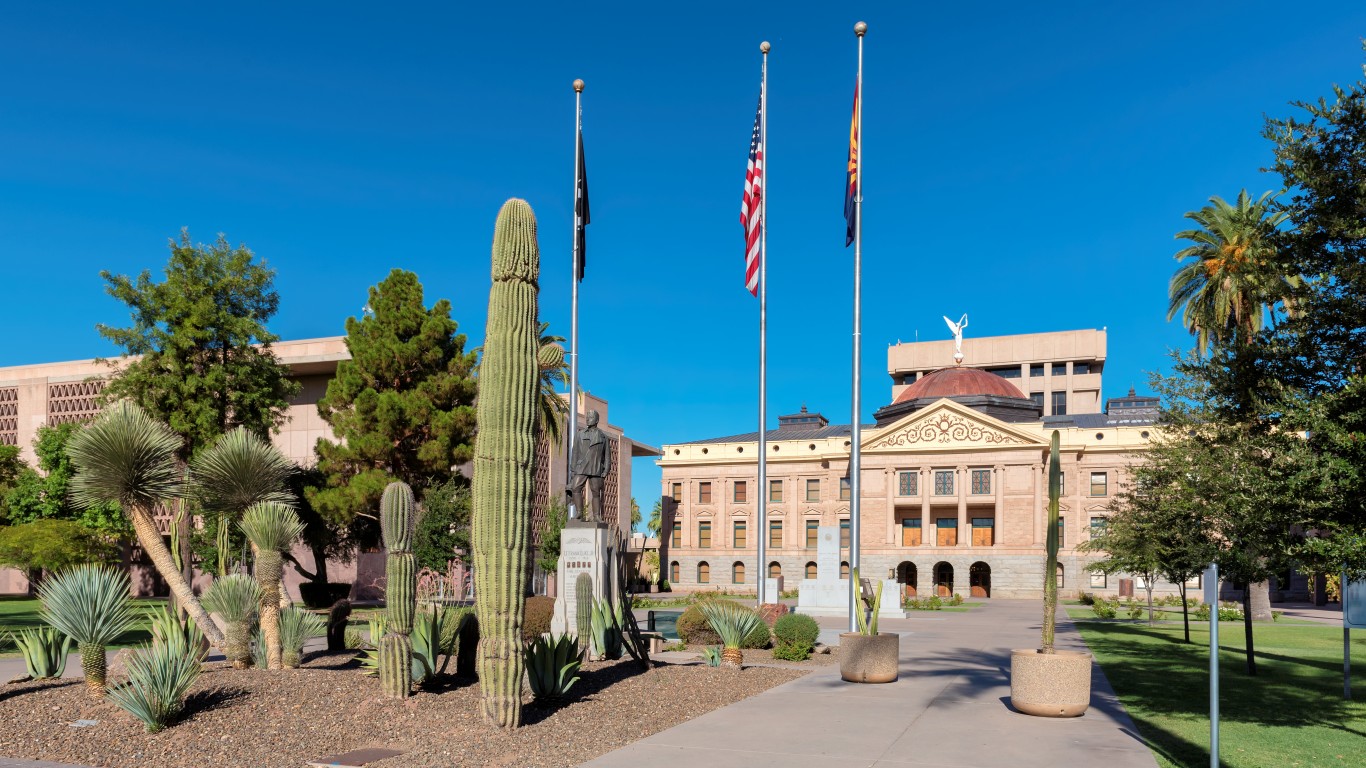
Arizona
> Average statewide spending (2018-2019 school year): $8,701 per pupil (3rd lowest)
> Top spending district: Mary C O’Brien Accommodation District (4435) ($22,336 per pupil)
> Lowest spending district: Thatcher Unified District (4219) ($6,623 per pupil)
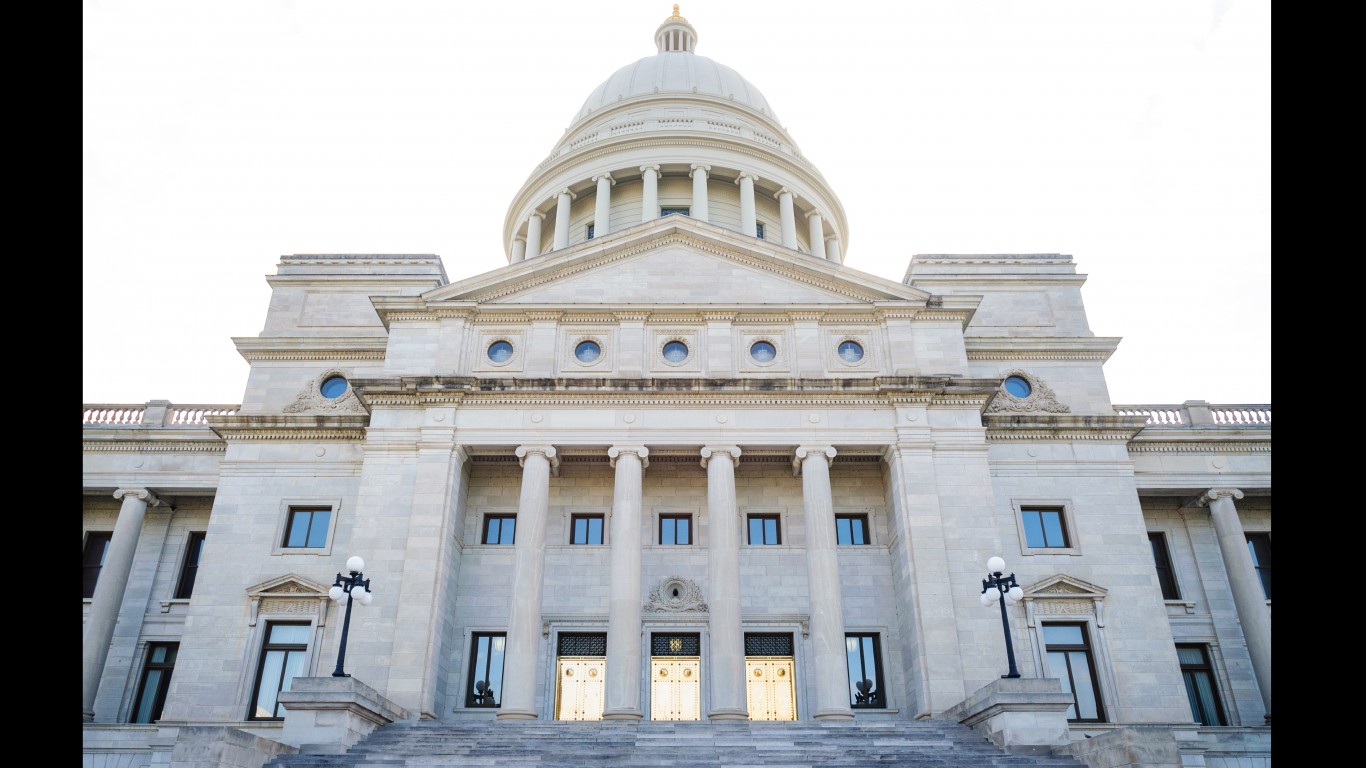
Arkansas
> Average statewide spending (2018-2019 school year): $10,138 per pupil (14th lowest)
> Top spending district: Mineral Springs School District ($18,832 per pupil)
> Lowest spending district: Benton School District ($7,753 per pupil)
[in-text-ad-2]
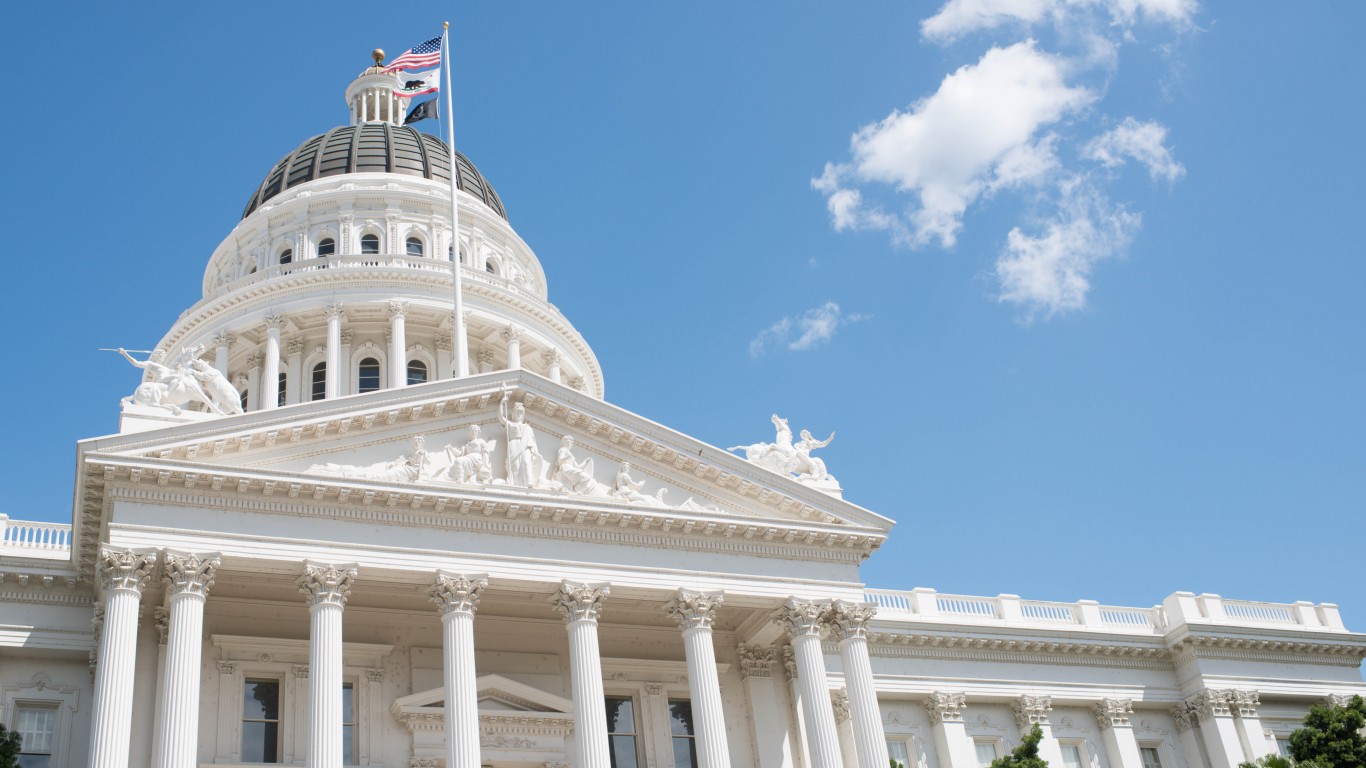
California
> Average statewide spending (2018-2019 school year): $13,444 per pupil (17th highest)
> Top spending district: Montecito Union Elementary ($30,213 per pupil)
> Lowest spending district: Liberty Elementary ($8,032 per pupil)
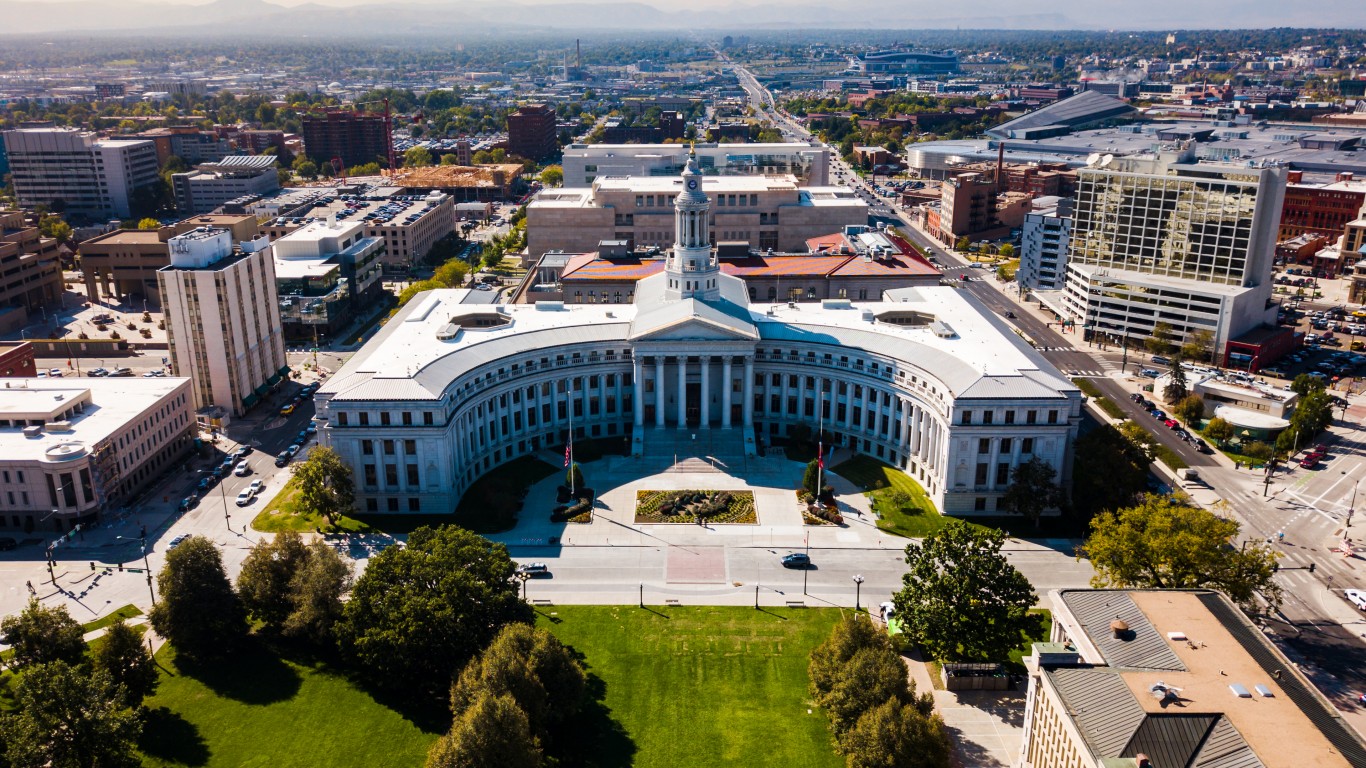
Colorado
> Average statewide spending (2018-2019 school year): $10,907 per pupil (17th lowest)
> Top spending district: Aspen School District No. 1 ($19,901 per pupil)
> Lowest spending district: Julesburg School District No. Re1 ($7,792 per pupil)
[in-text-ad]
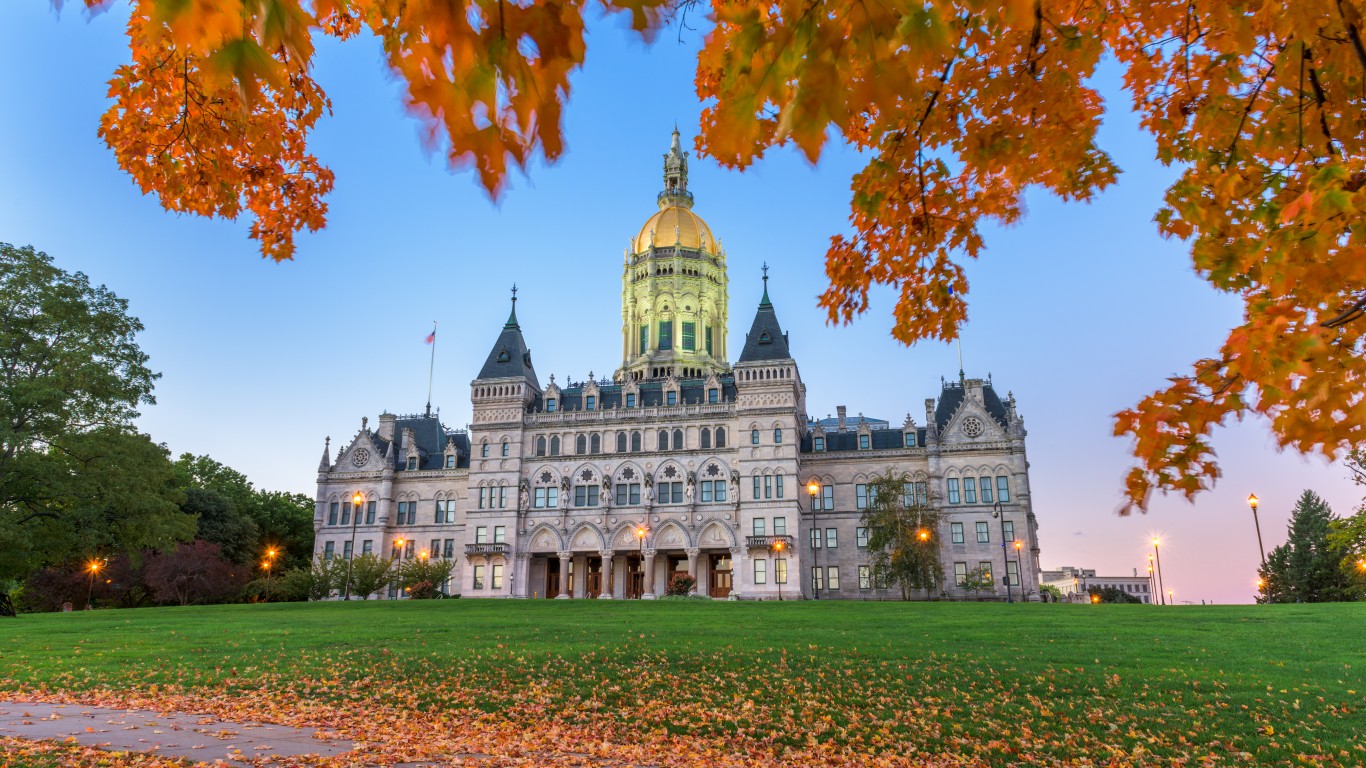
Connecticut
> Average statewide spending (2018-2019 school year): $20,387 per pupil (2nd highest)
> Top spending district: Regional School District 12 ($35,082 per pupil)
> Lowest spending district: Woodstock Academy ($5,464 per pupil)
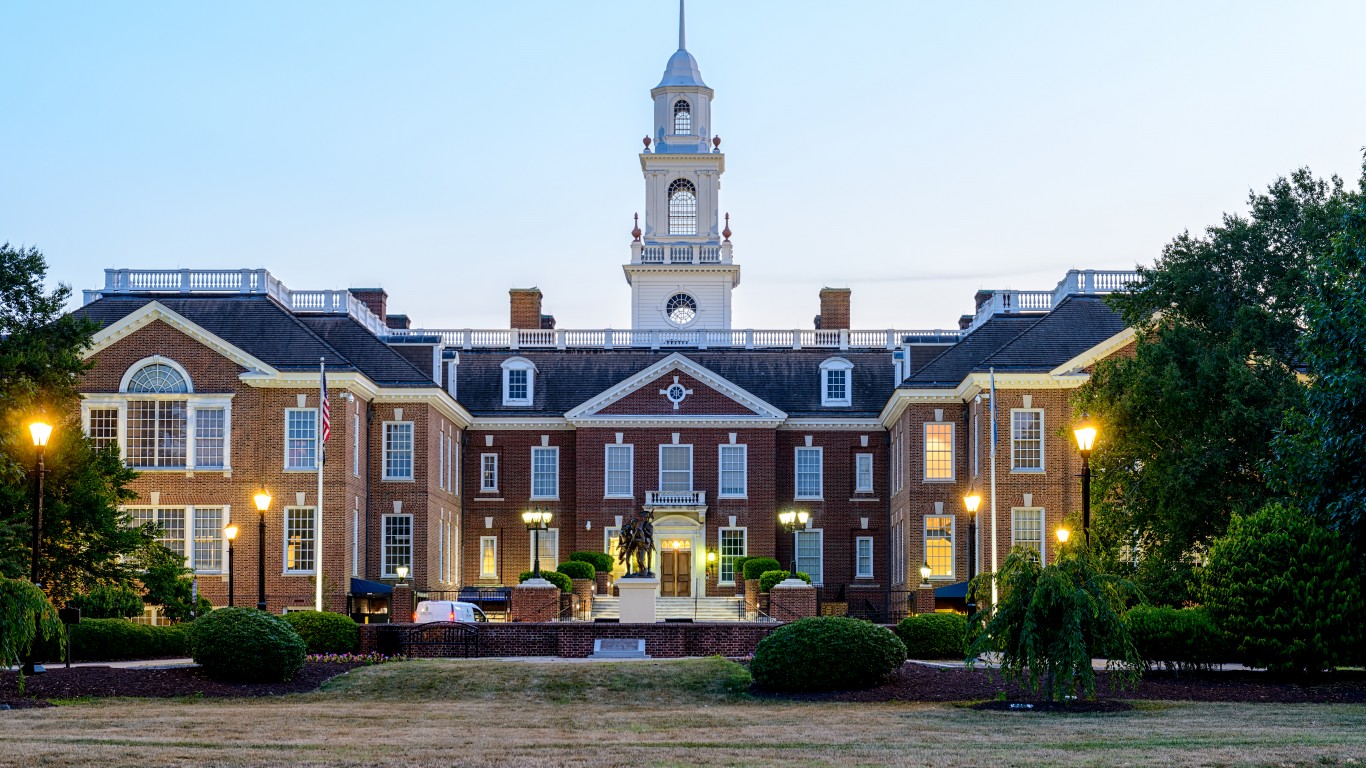
Delaware
> Average statewide spending (2018-2019 school year): $16,186 per pupil (10th highest)
> Top spending district: Christina School District ($22,578 per pupil)
> Lowest spending district: Delmar School District ($10,726 per pupil)
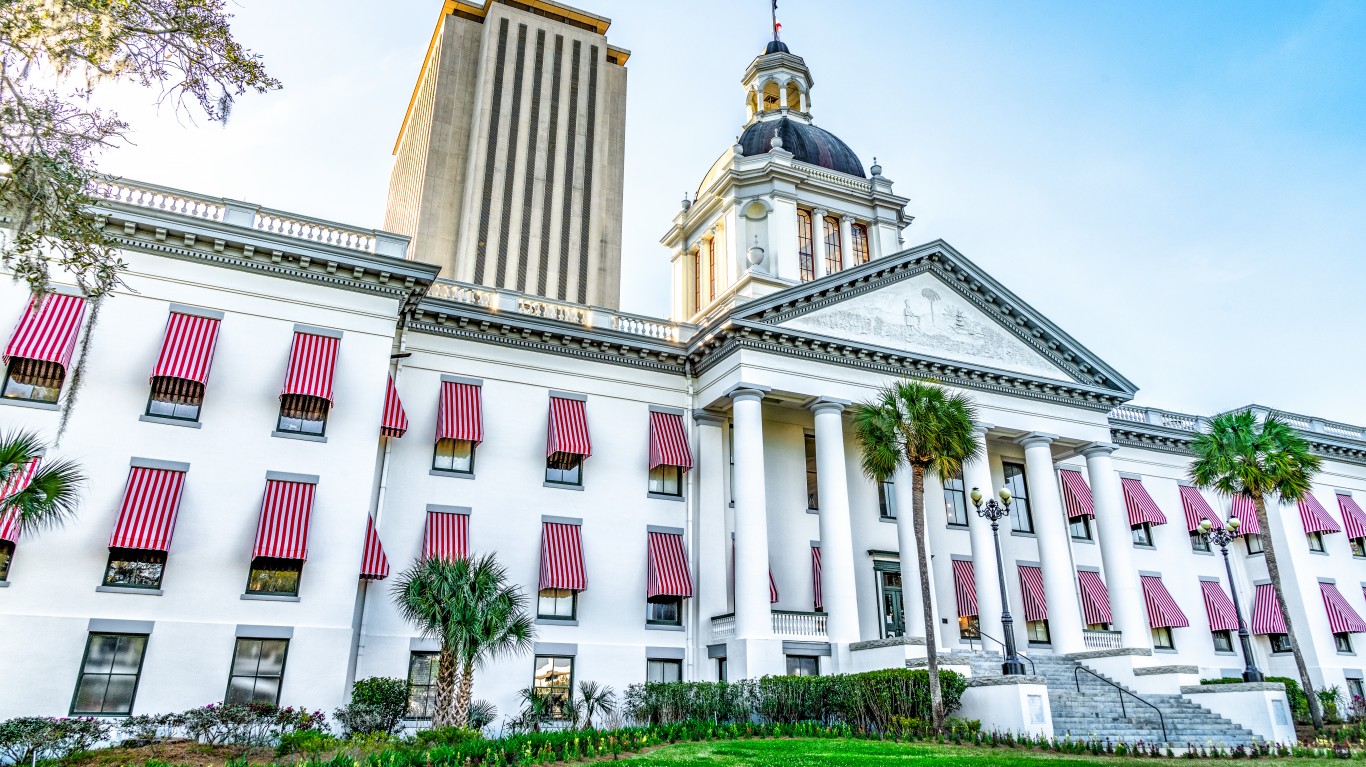
Florida
> Average statewide spending (2018-2019 school year): $9,645 per pupil (7th lowest)
> Top spending district: Gulf County ($14,445 per pupil)
> Lowest spending district: Clay County ($8,396 per pupil)
[in-text-ad-2]
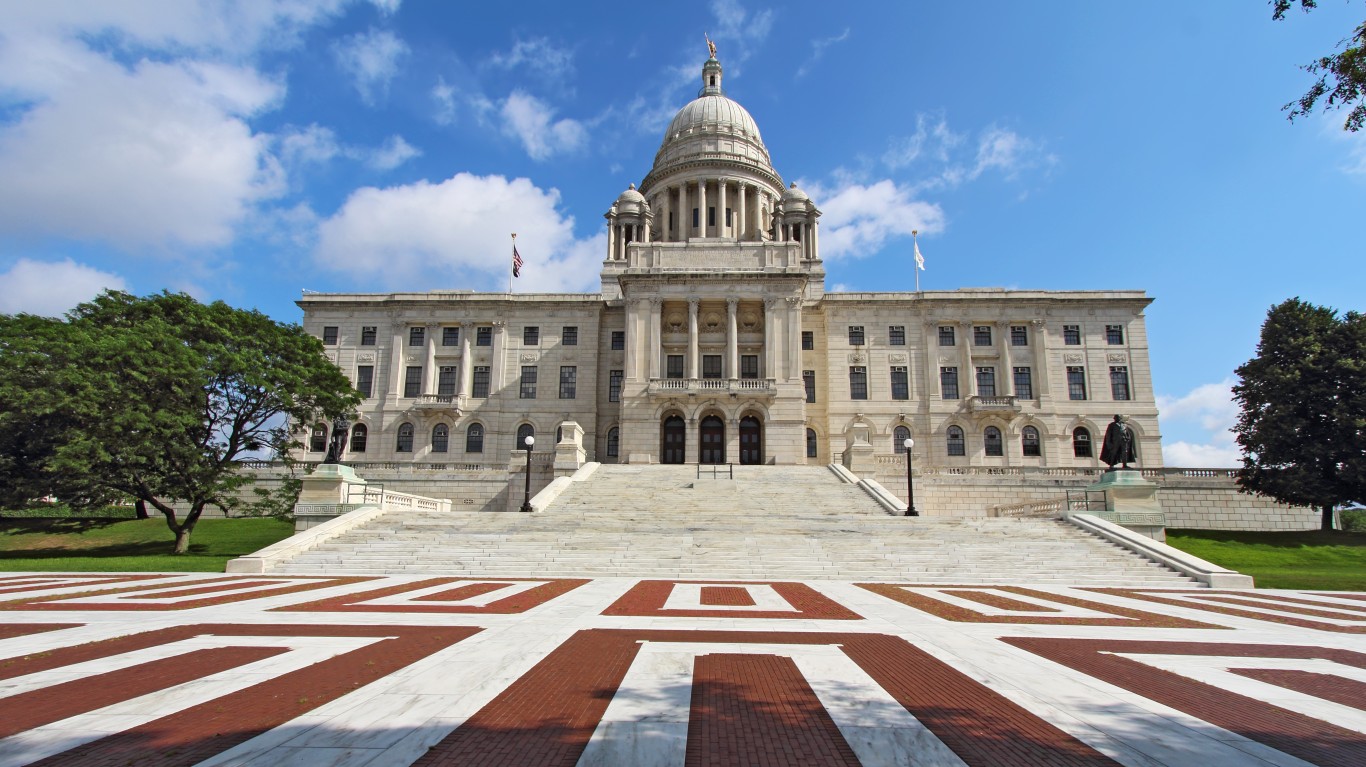
Georgia
> Average statewide spending (2018-2019 school year): $11,170 per pupil (20th lowest)
> Top spending district: Clay County ($19,866 per pupil)
> Lowest spending district: Calhoun City ($8,972 per pupil)
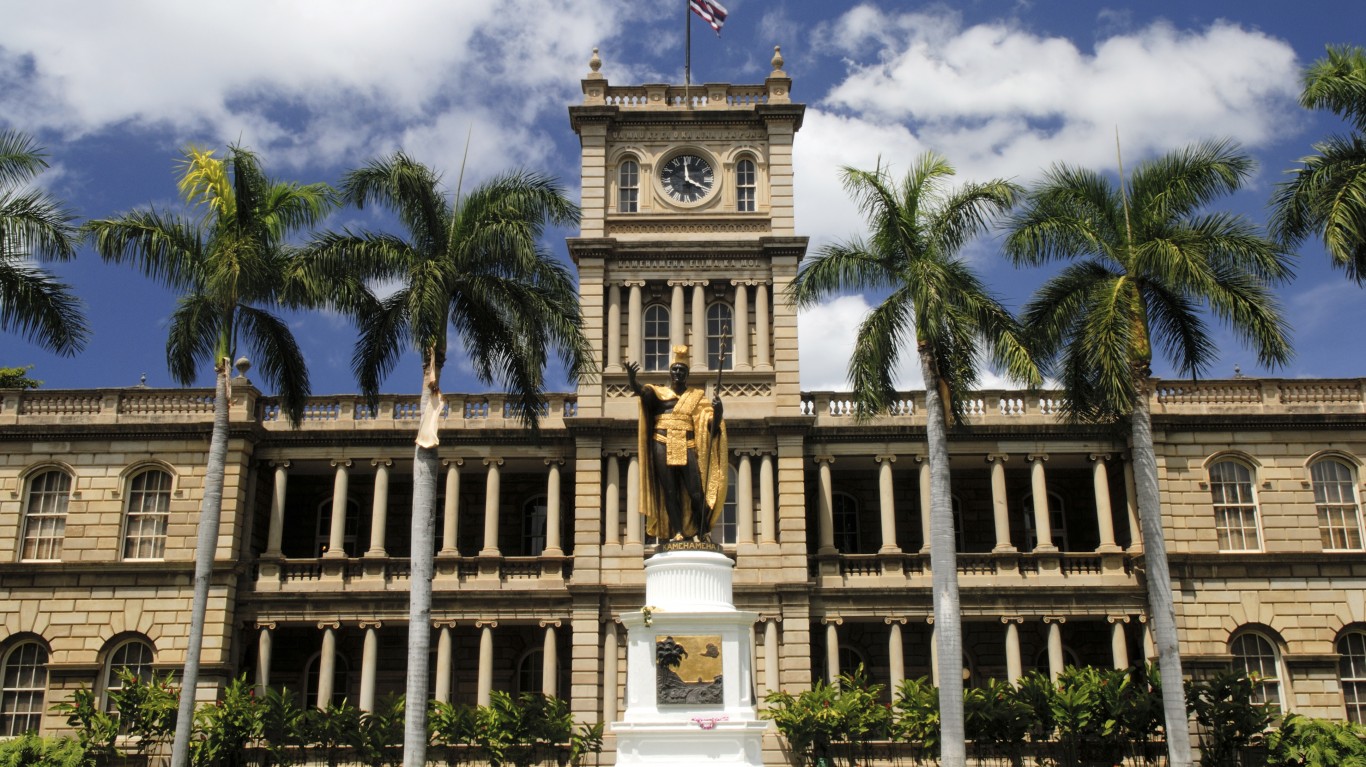
Hawaii
> Average statewide spending (2018-2019 school year): $16,132 per pupil (11th highest)
> Top spending district: Hawaii Department of Education ($16,132 per pupil)
> Lowest spending district: Hawaii Department of Education ($16,132 per pupil)
[in-text-ad]
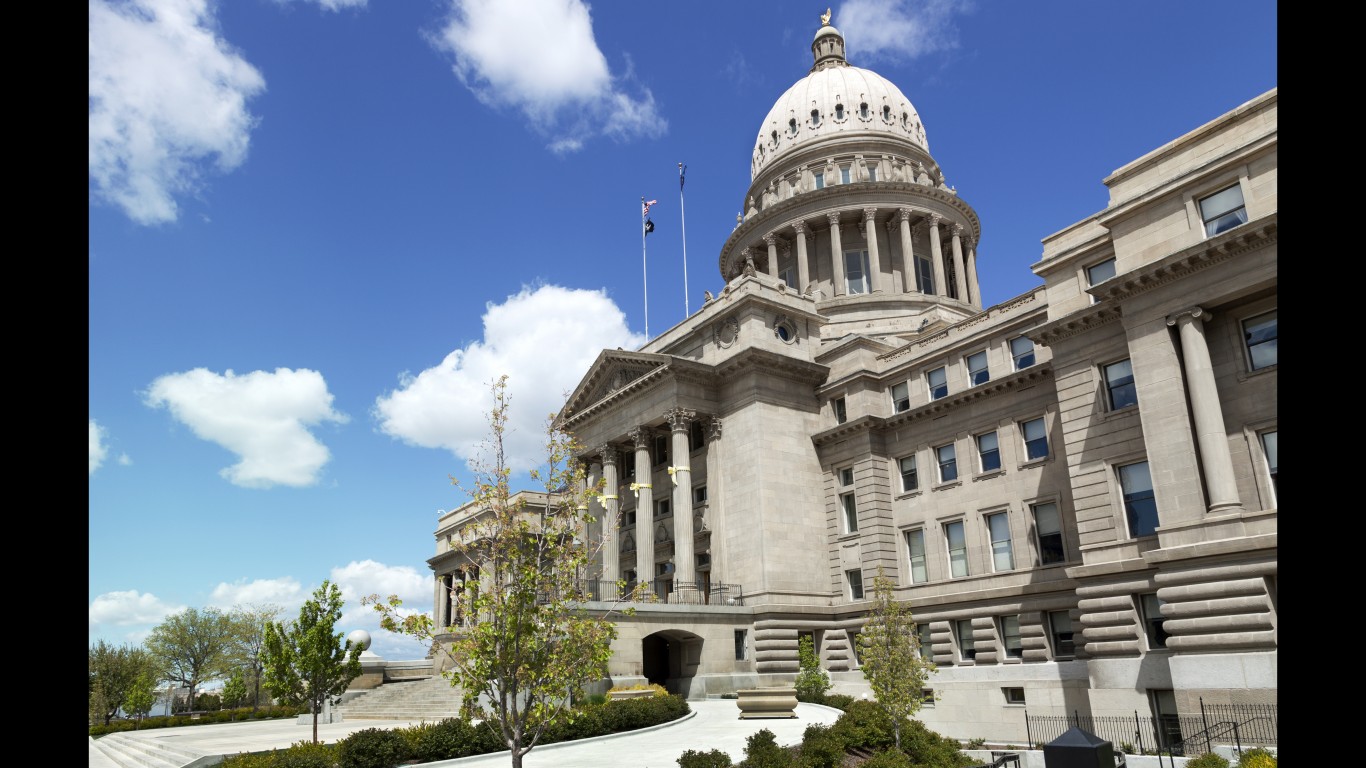
Idaho
> Average statewide spending (2018-2019 school year): $7,916 per pupil (the lowest)
> Top spending district: Blaine County District ($15,661 per pupil)
> Lowest spending district: Oneida County District ($5,345 per pupil)
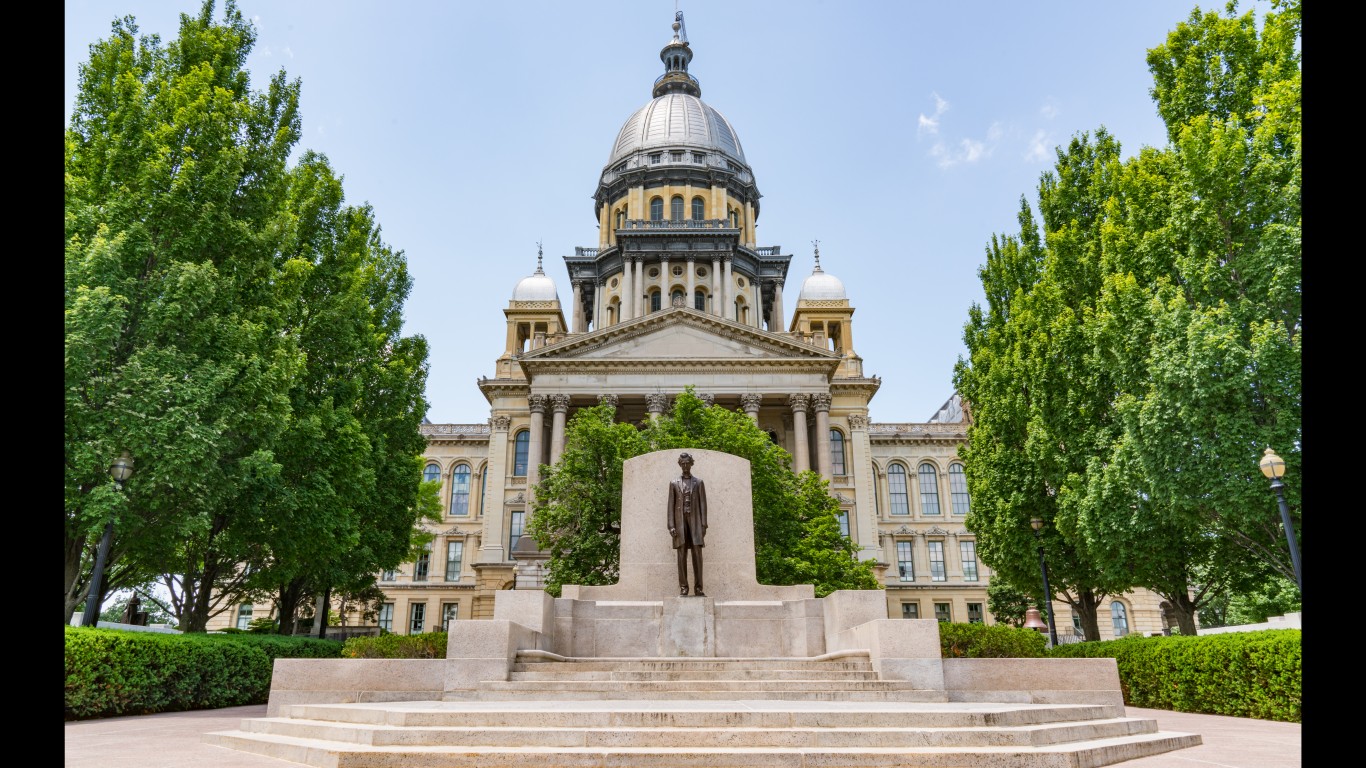
Illinois
> Average statewide spending (2018-2019 school year): $15,830 per pupil (12th highest)
> Top spending district: Madison CUSD 12 ($83,114 per pupil)
> Lowest spending district: Boone/Winnebago ROE ($2,602 per pupil)
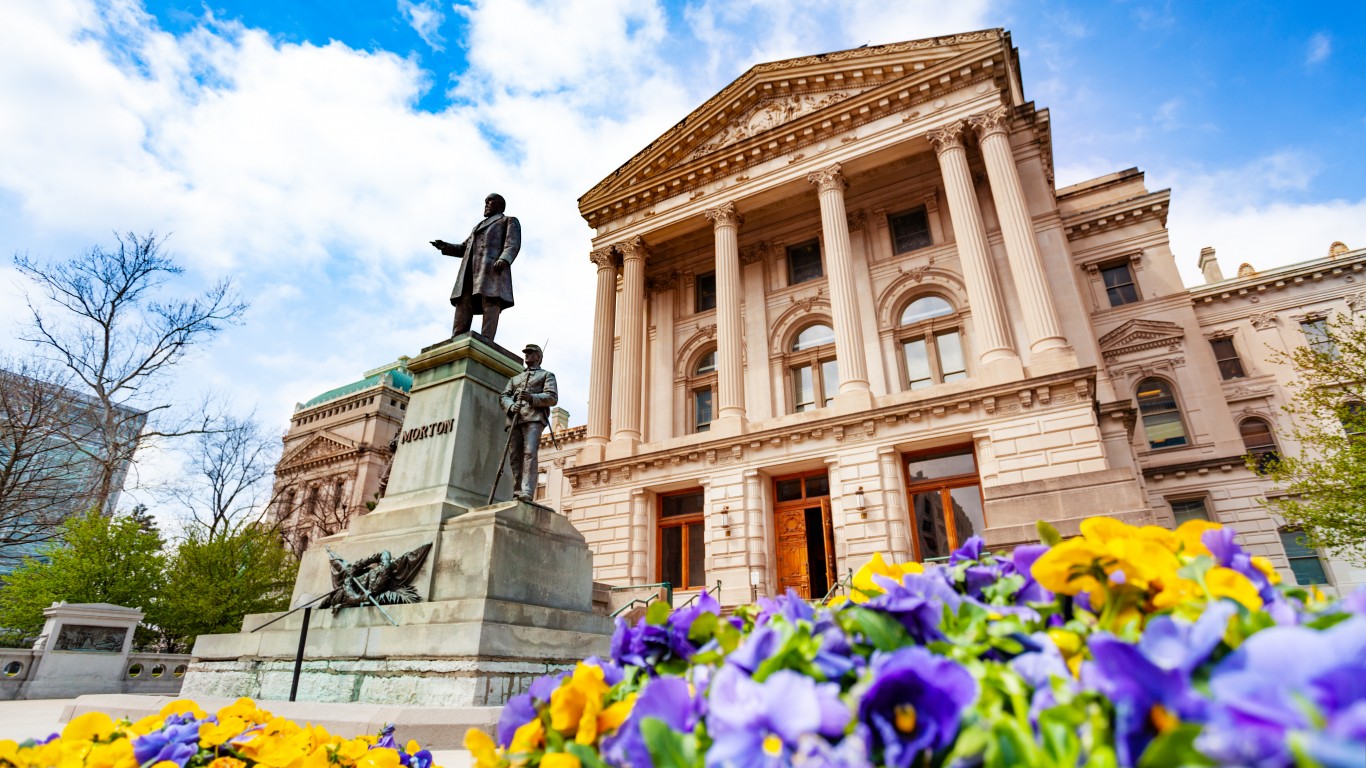
Indiana
> Average statewide spending (2018-2019 school year): $10,289 per pupil (15th lowest)
> Top spending district: DeKalb County Eastern Community School District ($23,899 per pupil)
> Lowest spending district: Union School Corporation ($4,188 per pupil)
[in-text-ad-2]
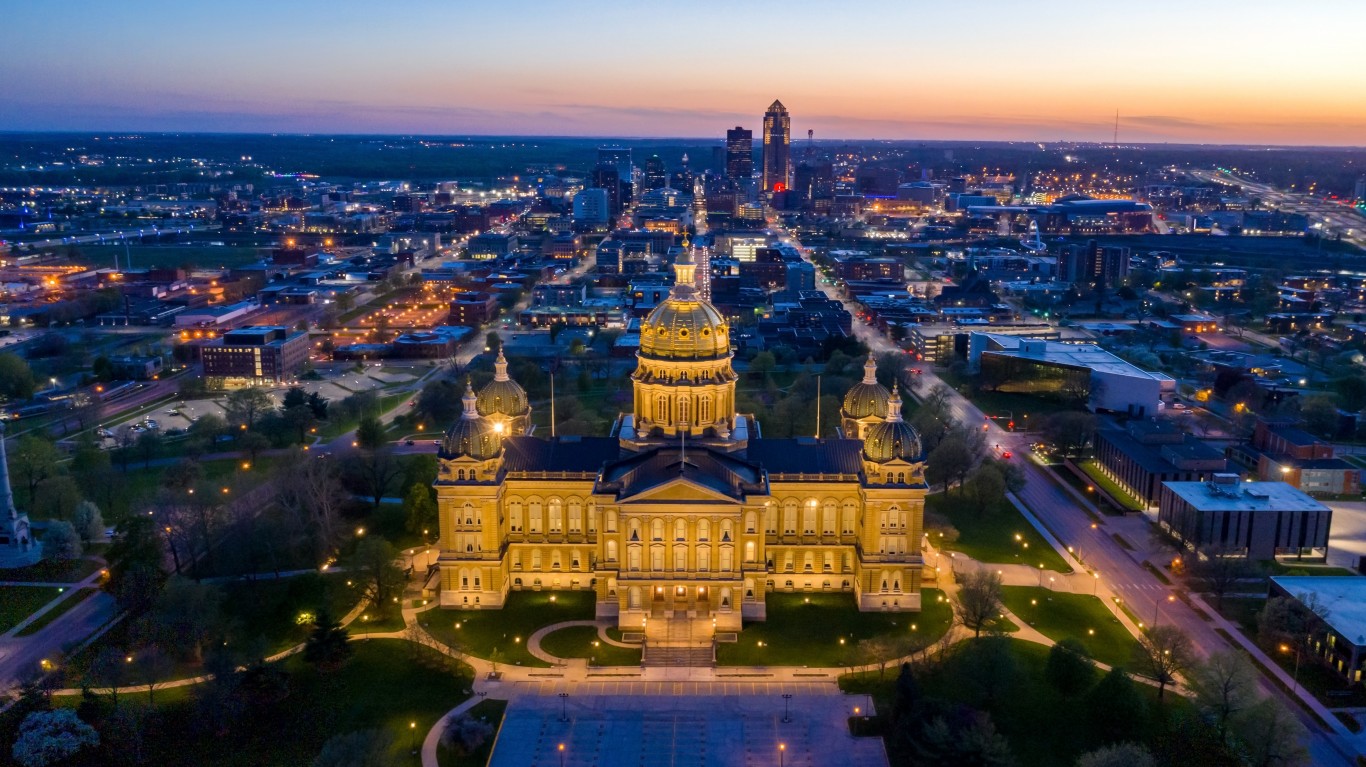
Iowa
> Average statewide spending (2018-2019 school year): $11,251 per pupil (21st lowest)
> Top spending district: Clay Central-Everly Comm School District ($16,018 per pupil)
> Lowest spending district: CAM Community School District ($8,645 per pupil)
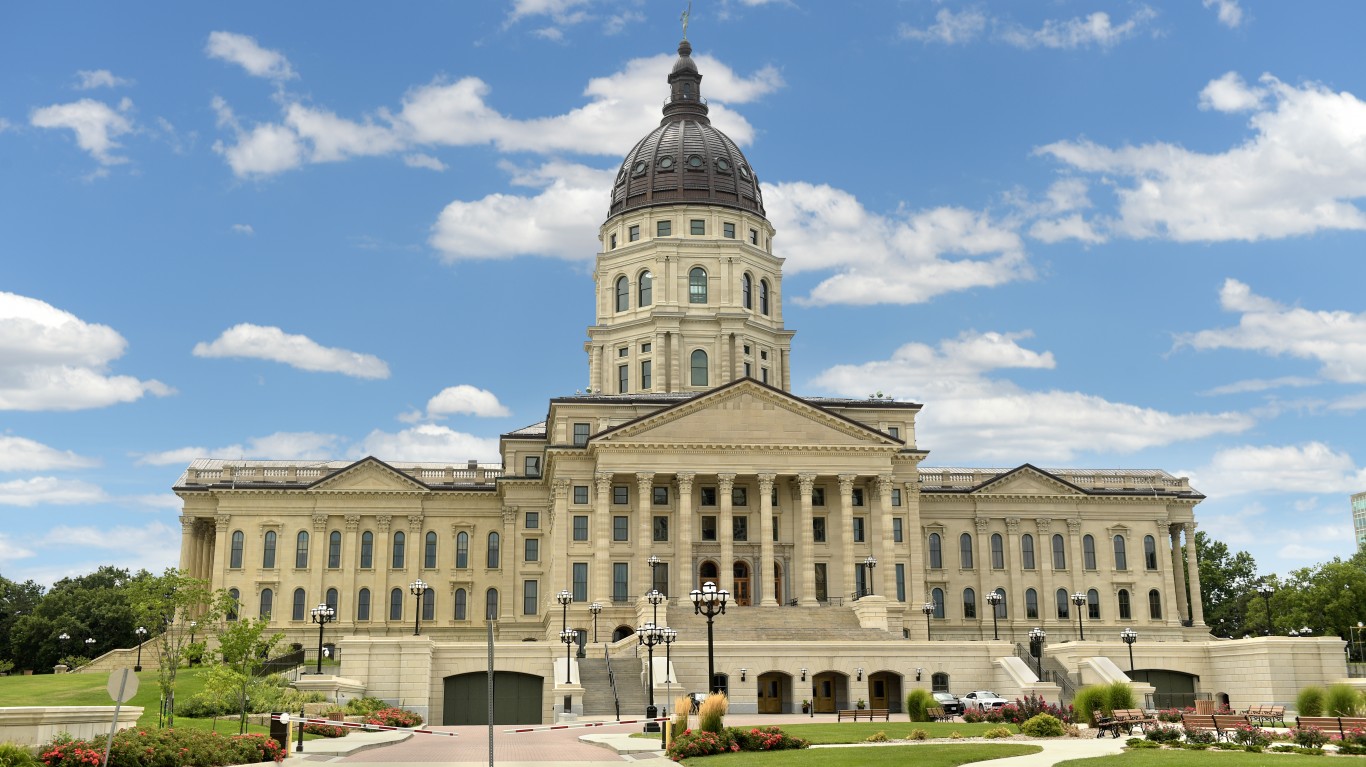
Kansas
> Average statewide spending (2018-2019 school year): $11,319 per pupil (23rd lowest)
> Top spending district: West Elk ($21,592 per pupil)
> Lowest spending district: Andover ($5,807 per pupil)
[in-text-ad]
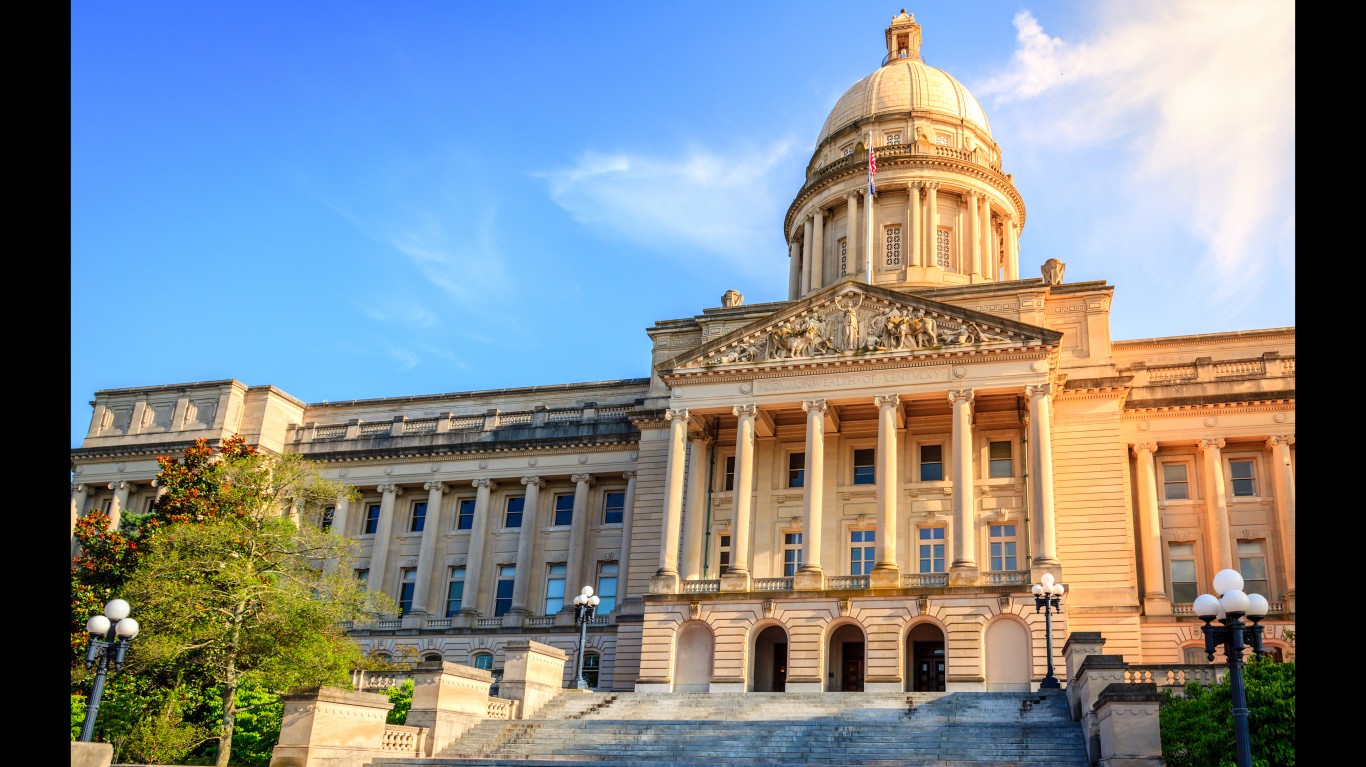
Kentucky
> Average statewide spending (2018-2019 school year): $11,289 per pupil (22nd lowest)
> Top spending district: Anchorage Independent ($21,431 per pupil)
> Lowest spending district: East Bernstadt Independent ($8,698 per pupil)

Louisiana
> Average statewide spending (2018-2019 school year): $11,762 per pupil (25th highest)
> Top spending district: Louisiana School for Math Science & the Arts ($24,769 per pupil)
> Lowest spending district: Acadia Parish ($9,512 per pupil)
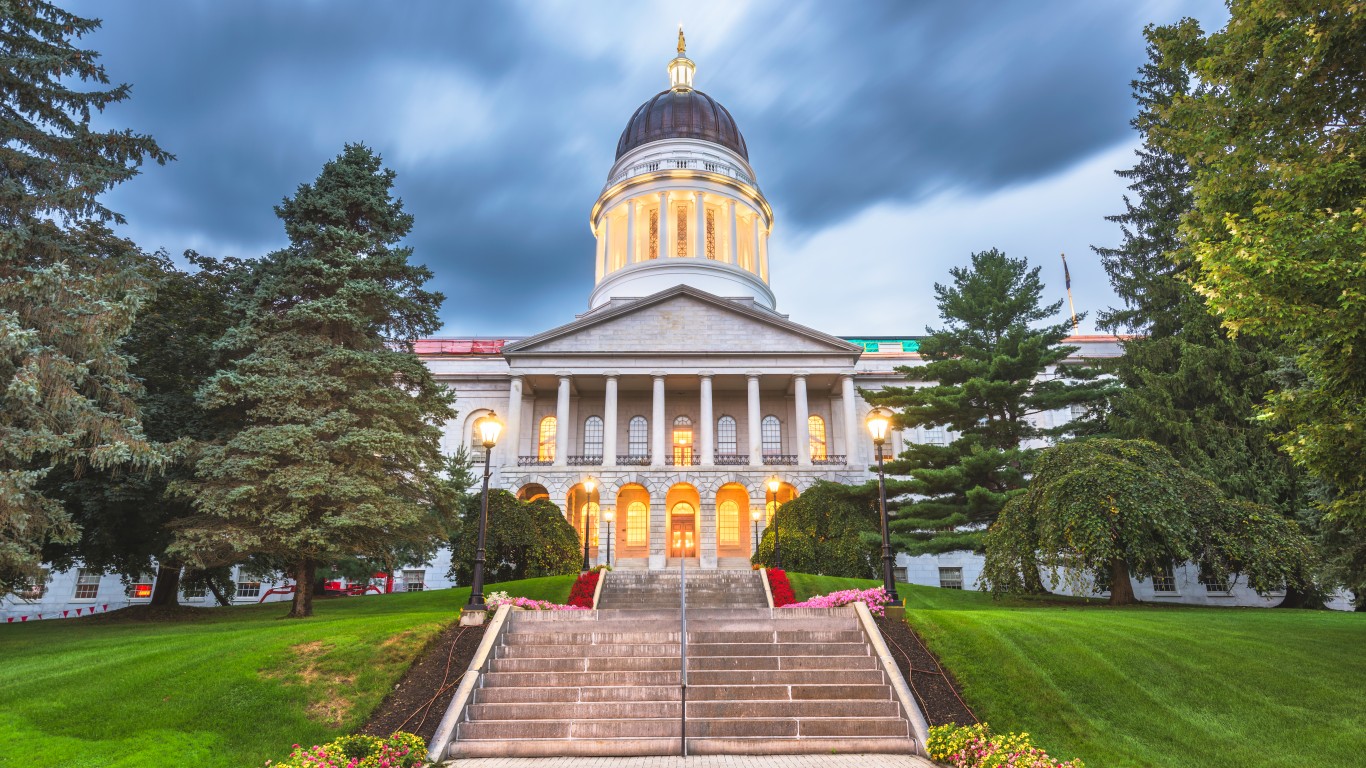
Maine
> Average statewide spending (2018-2019 school year): $14,610 per pupil (15th highest)
> Top spending district: Deer Isle-Stonington CSD ($21,971 per pupil)
> Lowest spending district: Dayton Public Schools ($7,709 per pupil)
[in-text-ad-2]
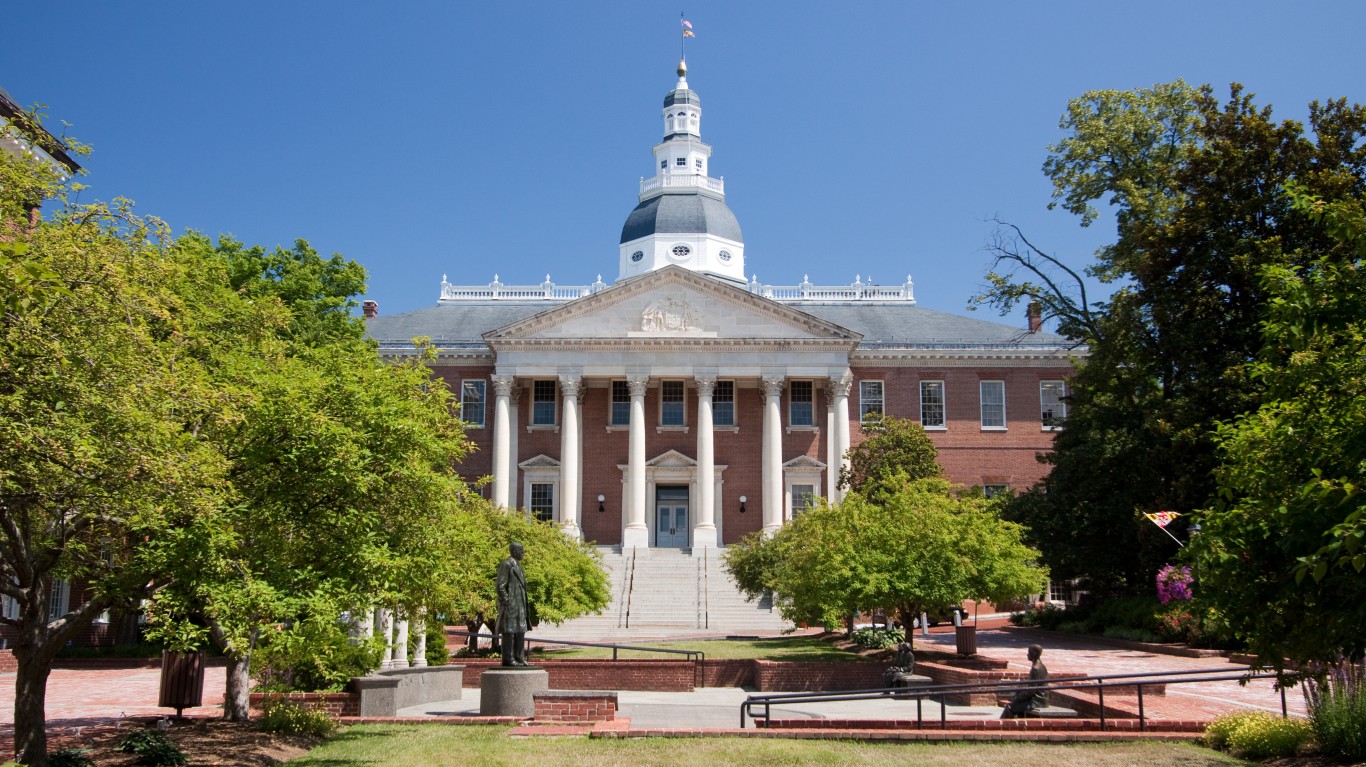
Maryland
> Average statewide spending (2018-2019 school year): $15,148 per pupil (14th highest)
> Top spending district: Worcester County Public Schools ($18,015 per pupil)
> Lowest spending district: Frederick County Public Schools ($13,434 per pupil)
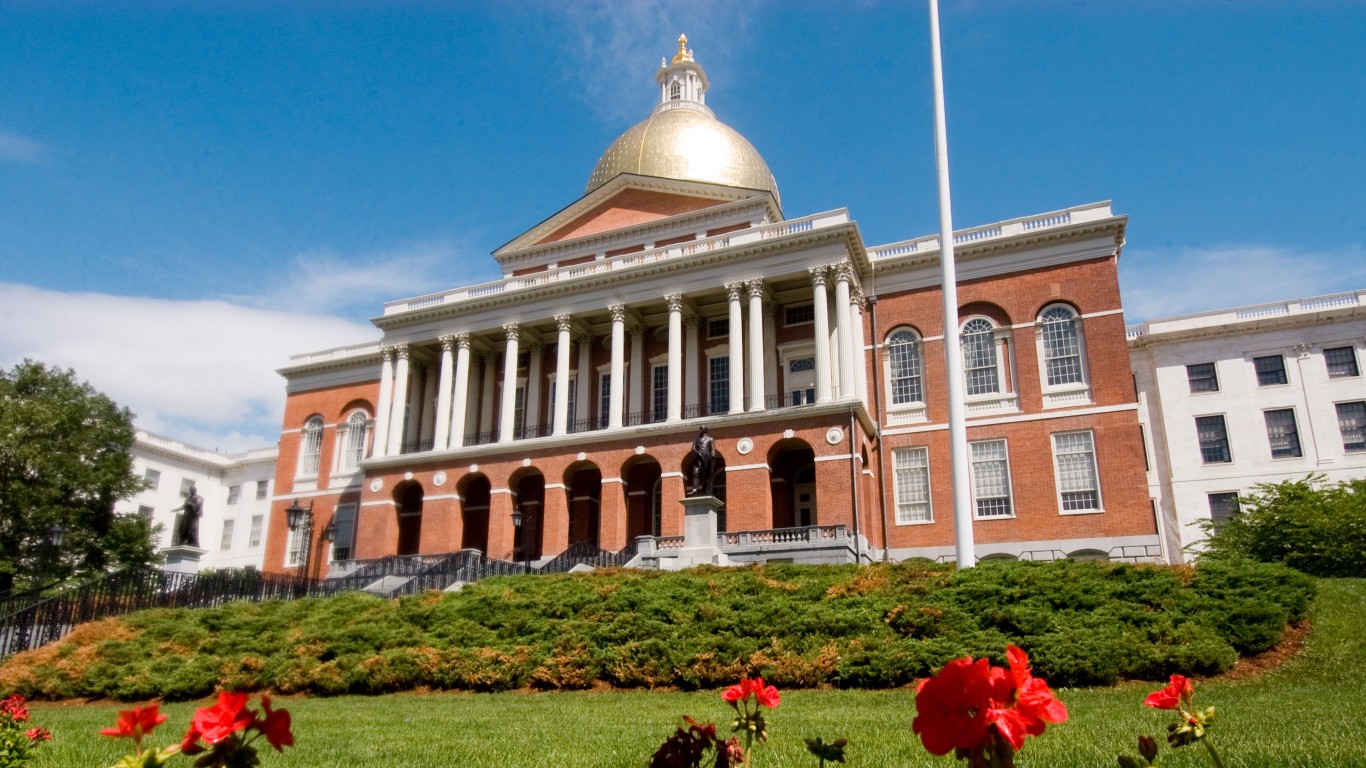
Massachusetts
> Average statewide spending (2018-2019 school year): $17,718 per pupil (5th highest)
> Top spending district: Martha’s Vineyard ($35,026 per pupil)
> Lowest spending district: TEC Connections Academy Commonwealth Virtual School District ($9,125 per pupil)
[in-text-ad]
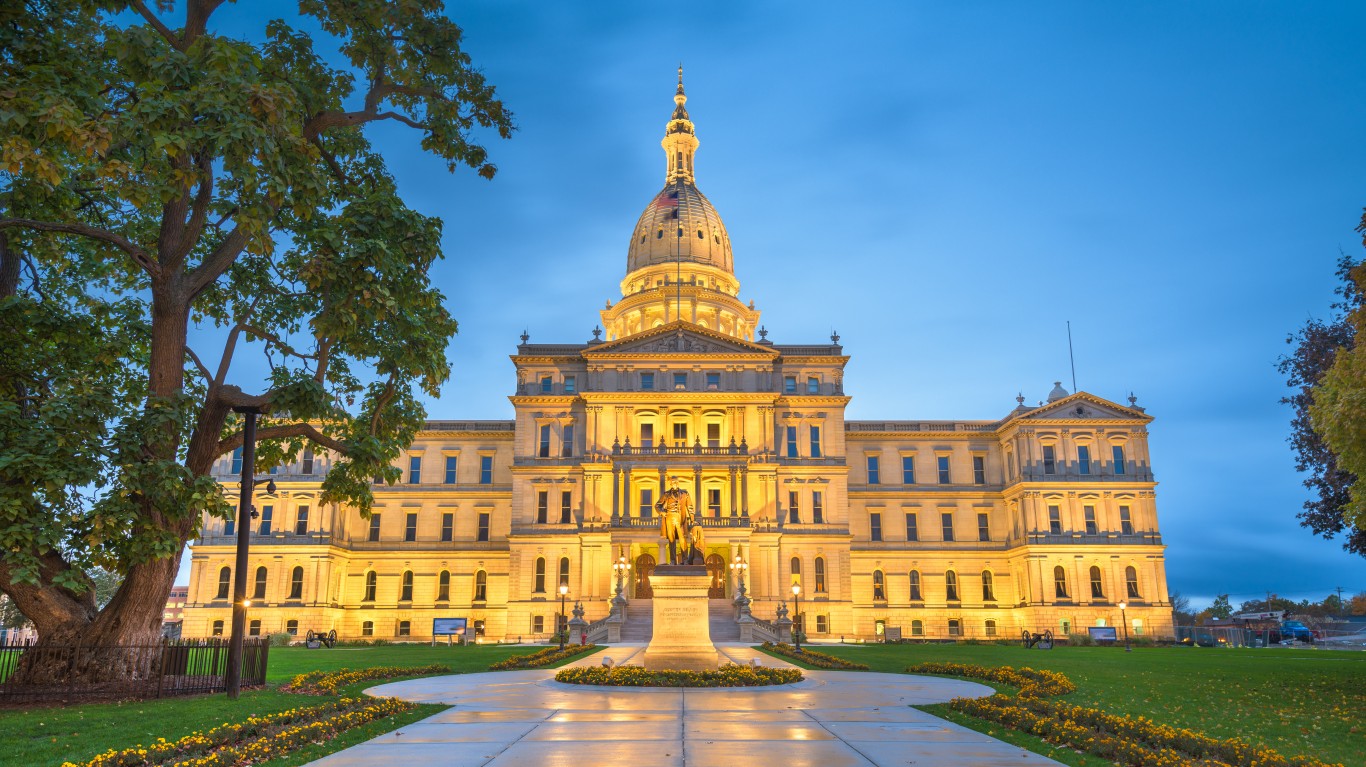
Michigan
> Average statewide spending (2018-2019 school year): $11,375 per pupil (24th lowest)
> Top spending district: New Buffalo Area Schools ($26,312 per pupil)
> Lowest spending district: Swan Valley School District ($8,475 per pupil)
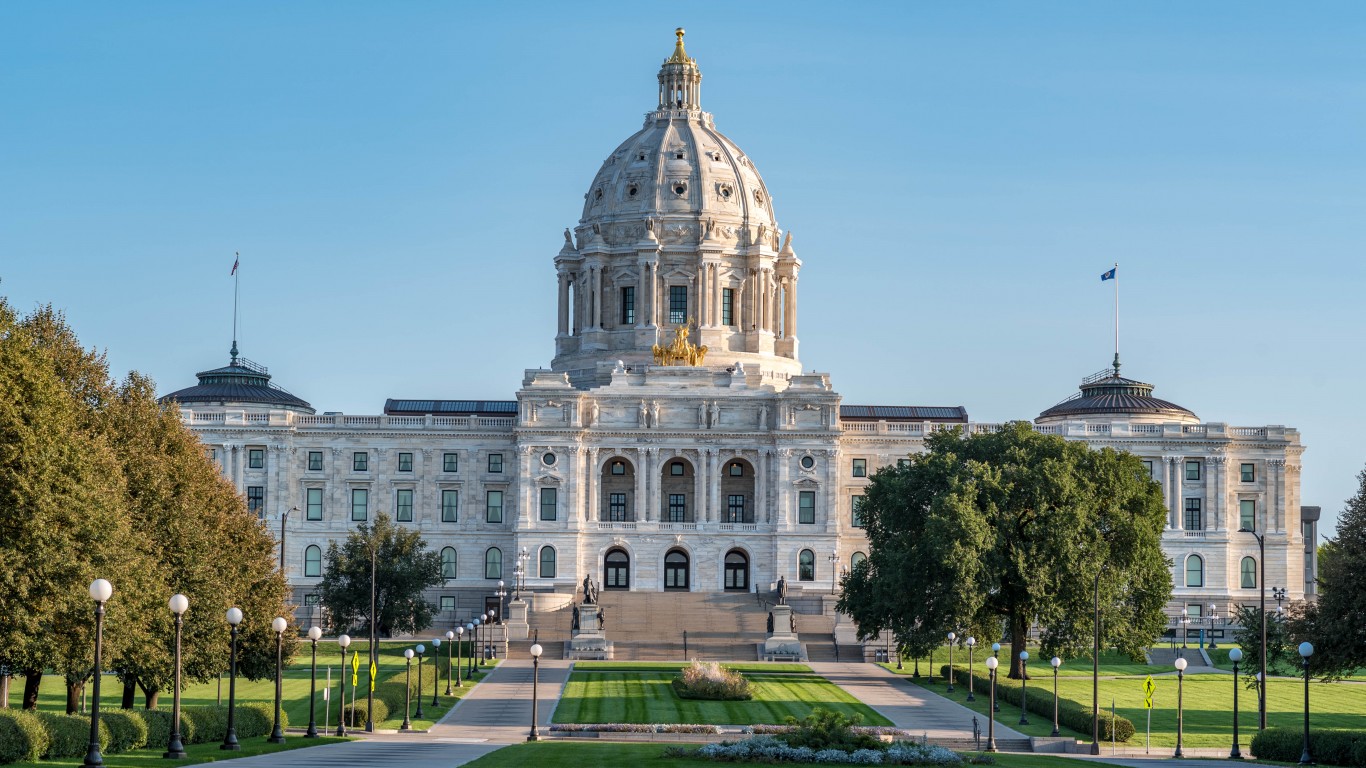
Minnesota
> Average statewide spending (2018-2019 school year): $12,630 per pupil (20th highest)
> Top spending district: Red Lake Public School District ($22,886 per pupil)
> Lowest spending district: Round Lake-Brewster Public Schools ($9,105 per pupil)
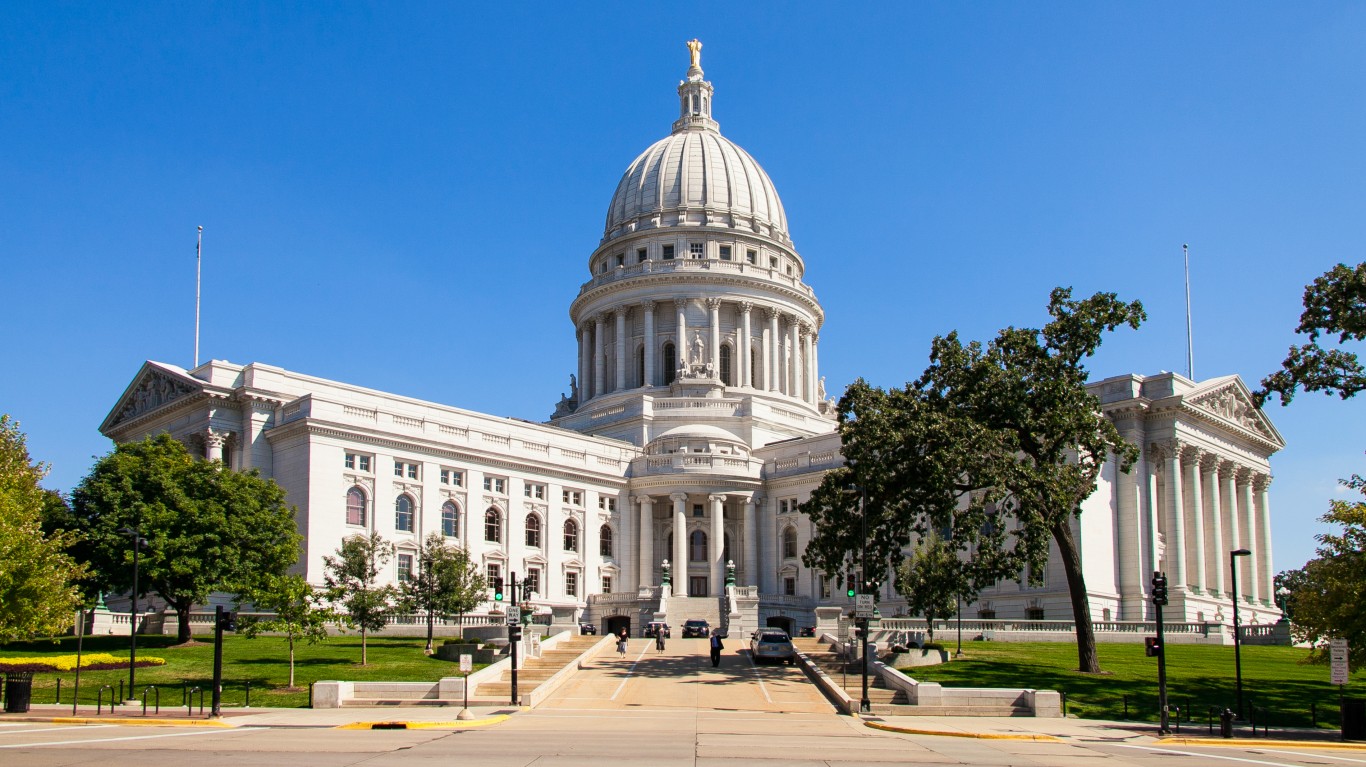
Mississippi
> Average statewide spending (2018-2019 school year): $9,284 per pupil (5th lowest)
> Top spending district: Amite County School District ($16,719 per pupil)
> Lowest spending district: Lincoln County School District ($7,422 per pupil)
[in-text-ad-2]
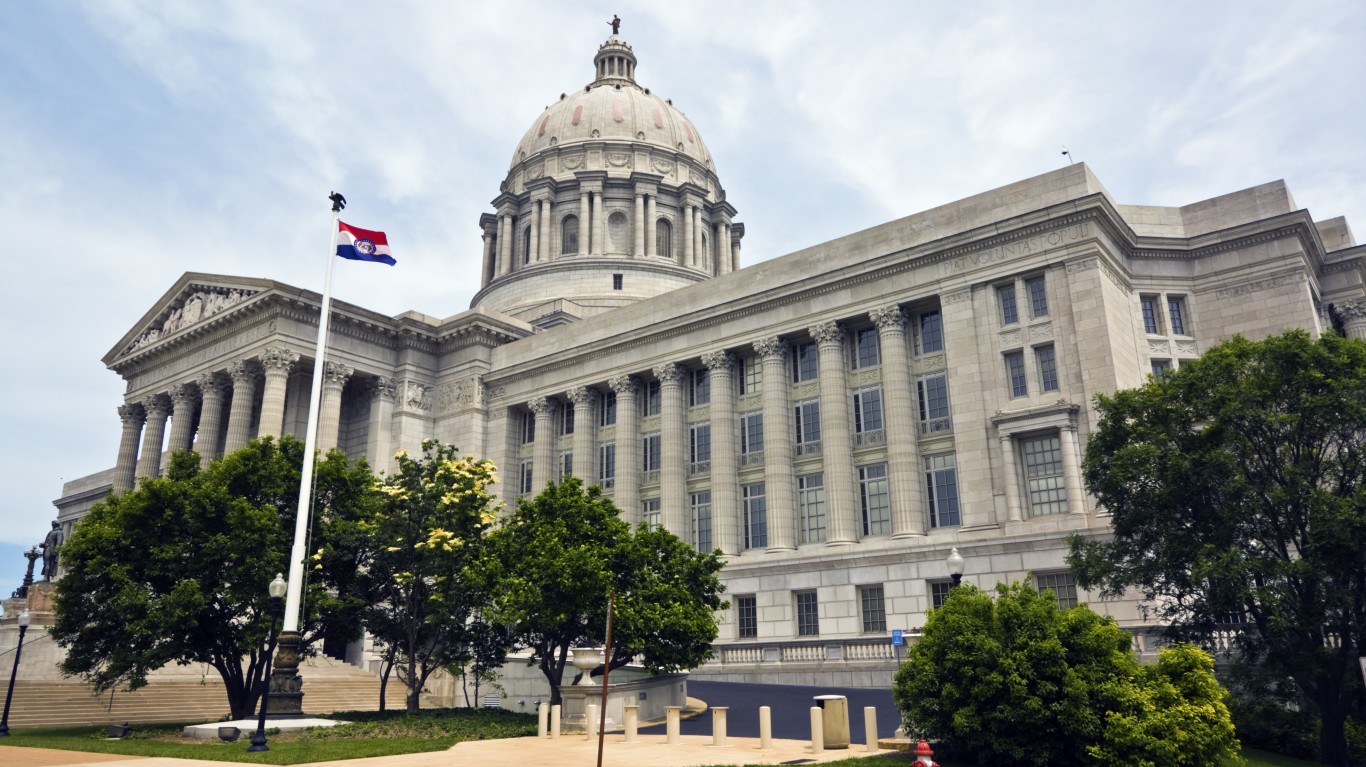
Missouri
> Average statewide spending (2018-2019 school year): $10,737 per pupil (16th lowest)
> Top spending district: Brentwood ($20,121 per pupil)
> Lowest spending district: Fair Grove R-X ($7,691 per pupil)

Montana
> Average statewide spending (2018-2019 school year): $11,113 per pupil (19th lowest)
> Top spending district: Hays-Lodge Pole K-12 Schools ($21,673 per pupil)
> Lowest spending district: Monforton Elem ($7,837 per pupil)
[in-text-ad]
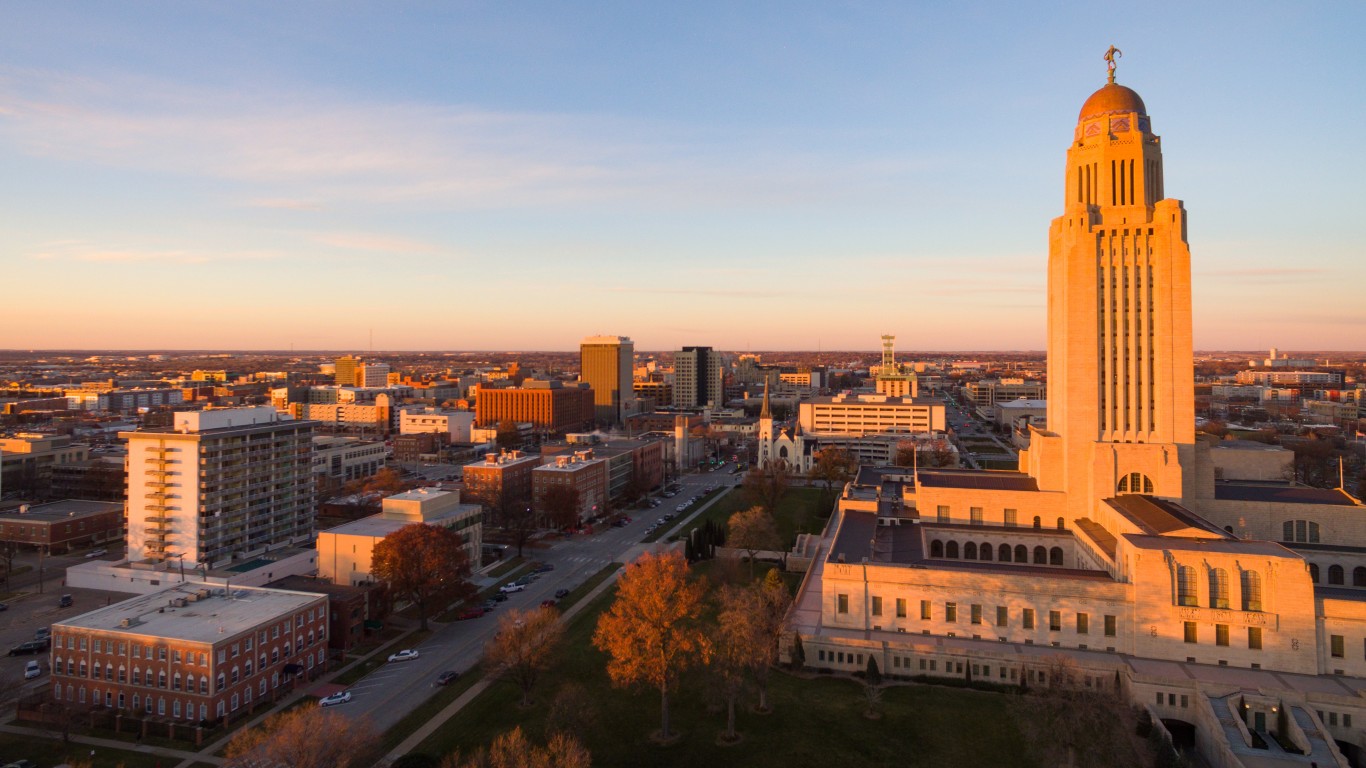
Nebraska
> Average statewide spending (2018-2019 school year): $12,118 per pupil (23rd highest)
> Top spending district: Umo N Ho N Nation Public Schools ($24,505 per pupil)
> Lowest spending district: Bennington Public Schools ($9,017 per pupil)
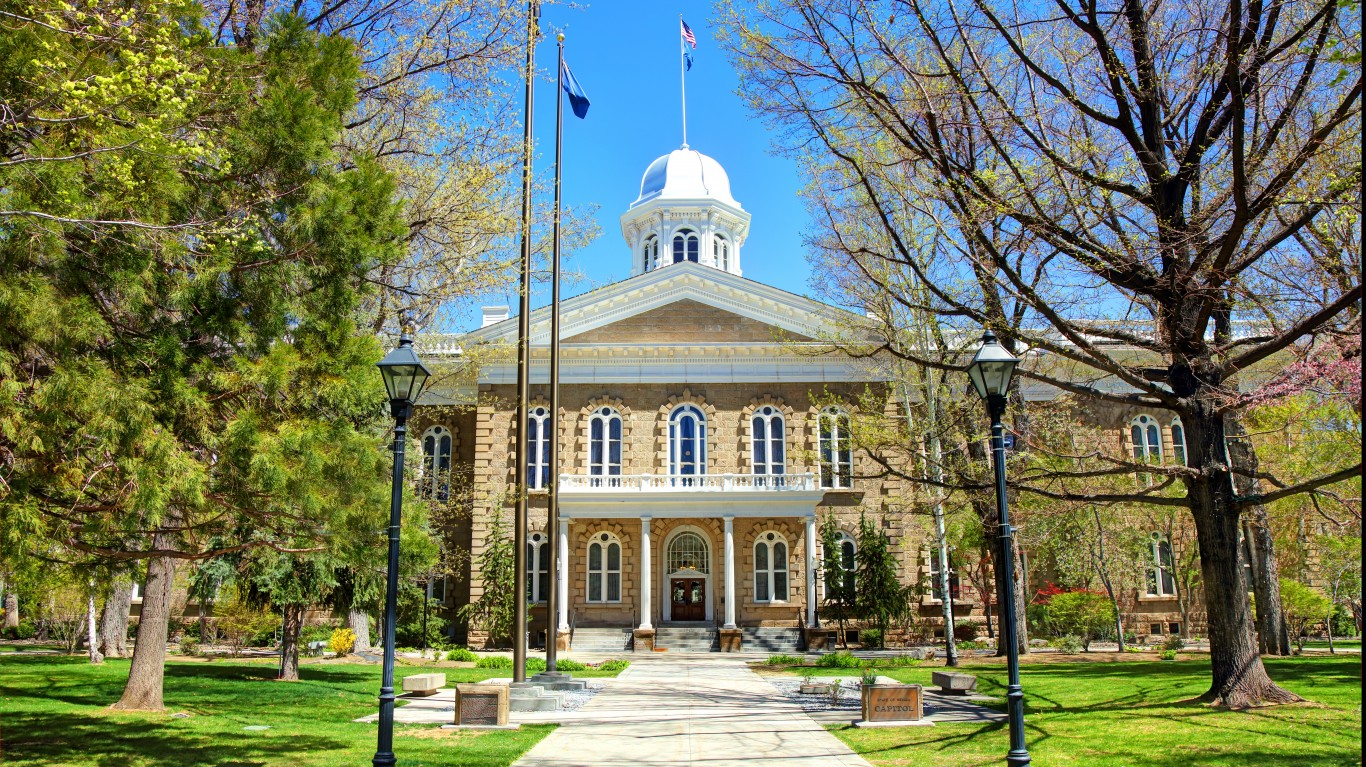
Nevada
> Average statewide spending (2018-2019 school year): $9,340 per pupil (6th lowest)
> Top spending district: Eureka County School District ($25,287 per pupil)
> Lowest spending district: Clark County School District ($8,925 per pupil)

New Hampshire
> Average statewide spending (2018-2019 school year): $17,286 per pupil (6th highest)
> Top spending district: Sunapee School District ($30,157 per pupil)
> Lowest spending district: Manchester School District ($13,167 per pupil)
[in-text-ad-2]
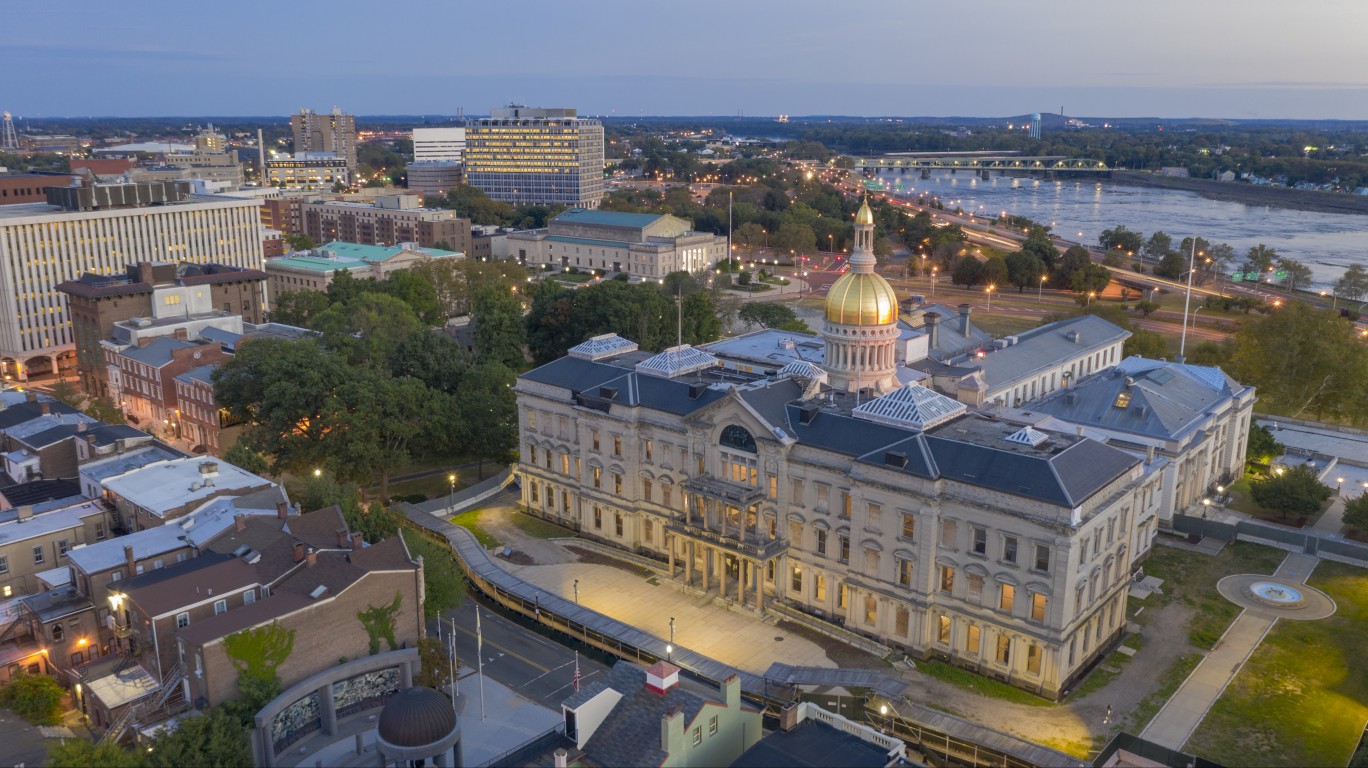
New Jersey
> Average statewide spending (2018-2019 school year): $19,810 per pupil (3rd highest)
> Top spending district: Mountainside School District ($50,345 per pupil)
> Lowest spending district: Fairview Public School District ($13,200 per pupil)
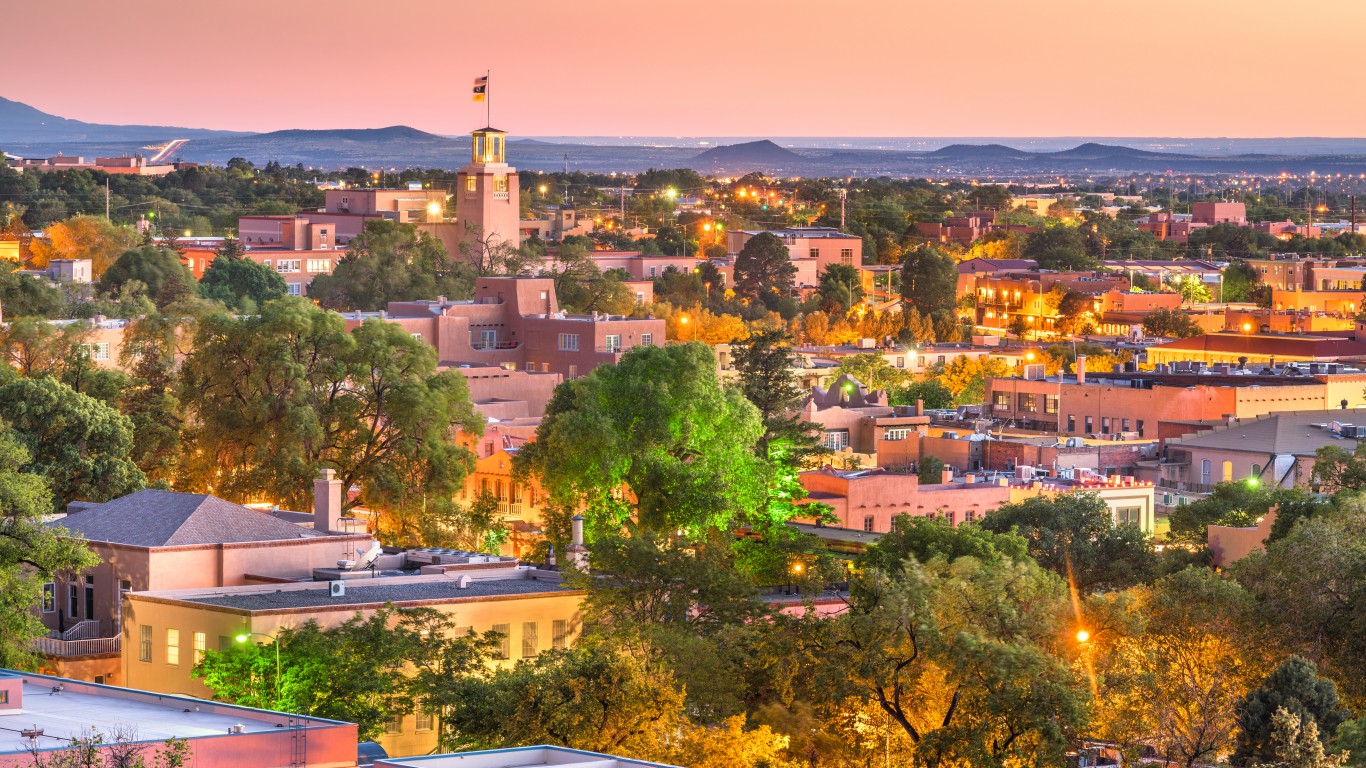
New Mexico
> Average statewide spending (2018-2019 school year): $10,095 per pupil (13th lowest)
> Top spending district: Magdalena Municipal Schools ($19,580 per pupil)
> Lowest spending district: Rio Rancho Public Schools ($8,565 per pupil)
[in-text-ad]

New York
> Average statewide spending (2018-2019 school year): $23,354 per pupil (the highest)
> Top spending district: Bridgehampton Union Free School District ($66,484 per pupil)
> Lowest spending district: General Brown Central School District ($14,471 per pupil)

North Carolina
> Average statewide spending (2018-2019 school year): $9,857 per pupil (9th lowest)
> Top spending district: Hyde County Schools ($18,114 per pupil)
> Lowest spending district: Lincoln County Schools ($8,536 per pupil)
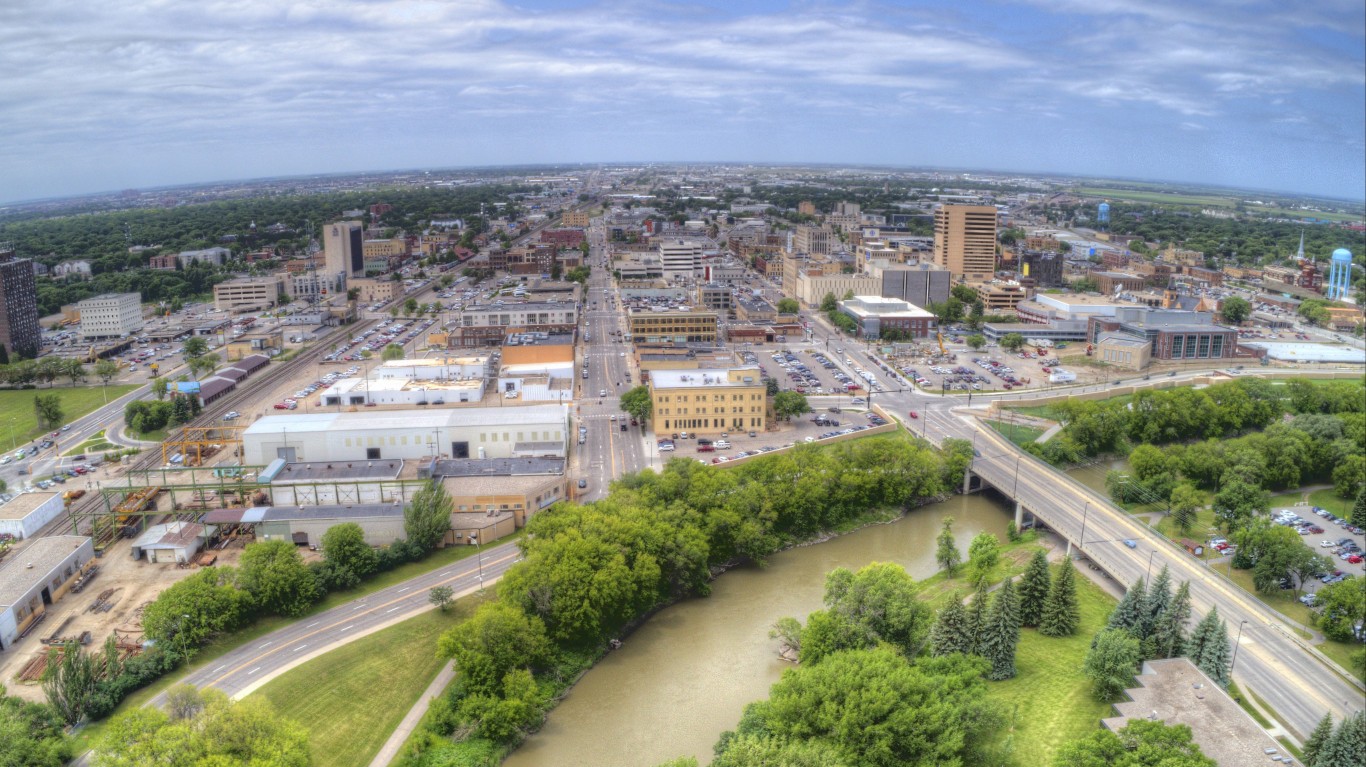
North Dakota
> Average statewide spending (2018-2019 school year): $13,069 per pupil (18th highest)
> Top spending district: Mandaree 36 ($26,722 per pupil)
> Lowest spending district: Thompson 61 ($9,252 per pupil)
[in-text-ad-2]
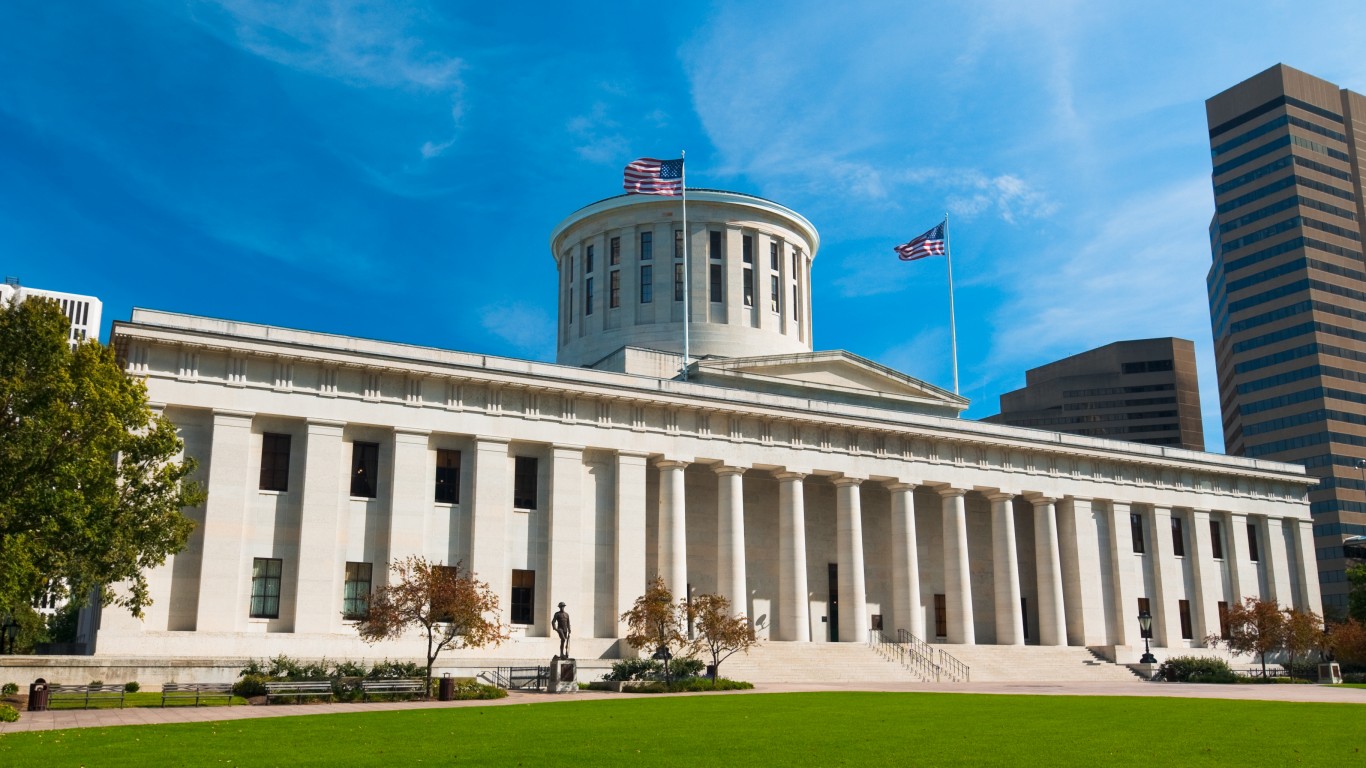
Ohio
> Average statewide spending (2018-2019 school year): $12,548 per pupil (22nd highest)
> Top spending district: Orange City ($24,437 per pupil)
> Lowest spending district: Global Impact STEM Academy ($7,003 per pupil)
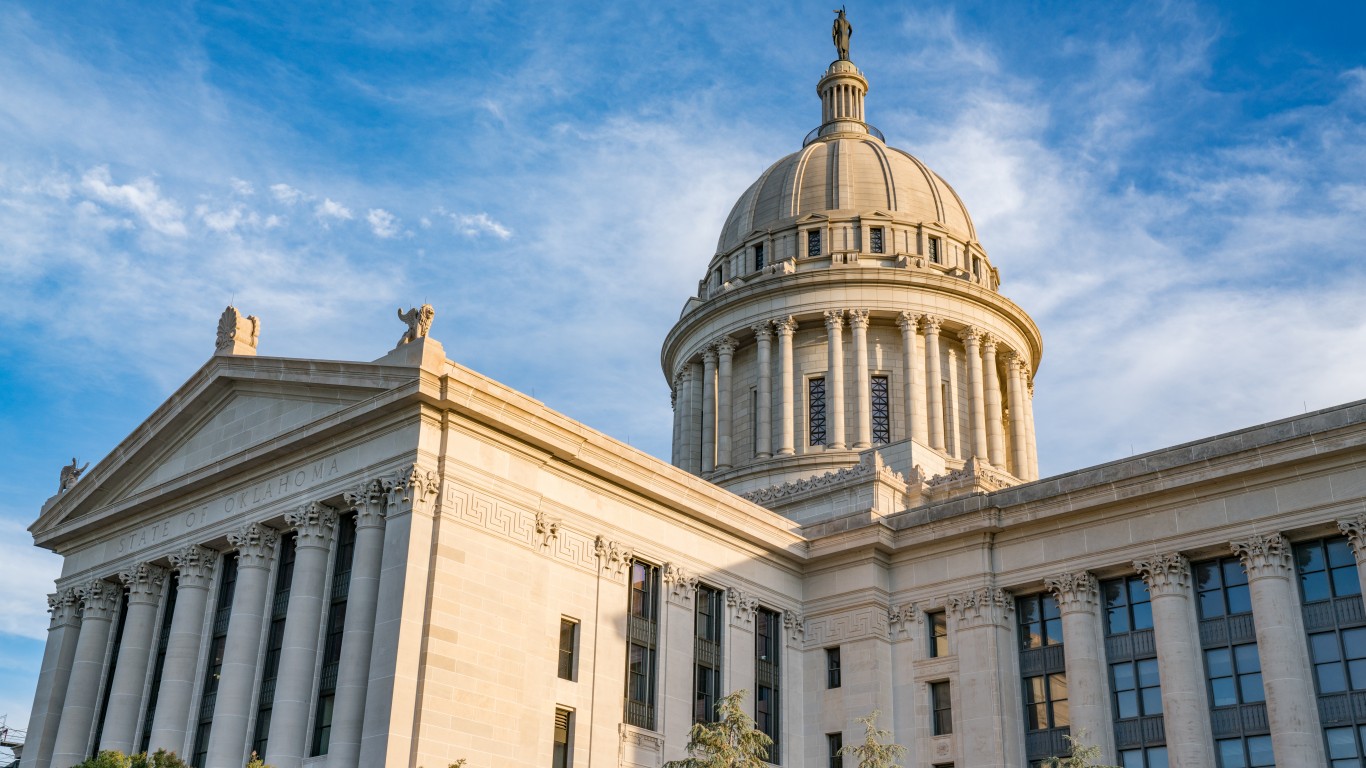
Oklahoma
> Average statewide spending (2018-2019 school year): $9,235 per pupil (4th lowest)
> Top spending district: Medford ($22,221 per pupil)
> Lowest spending district: Lone Star ($6,475 per pupil)
[in-text-ad]
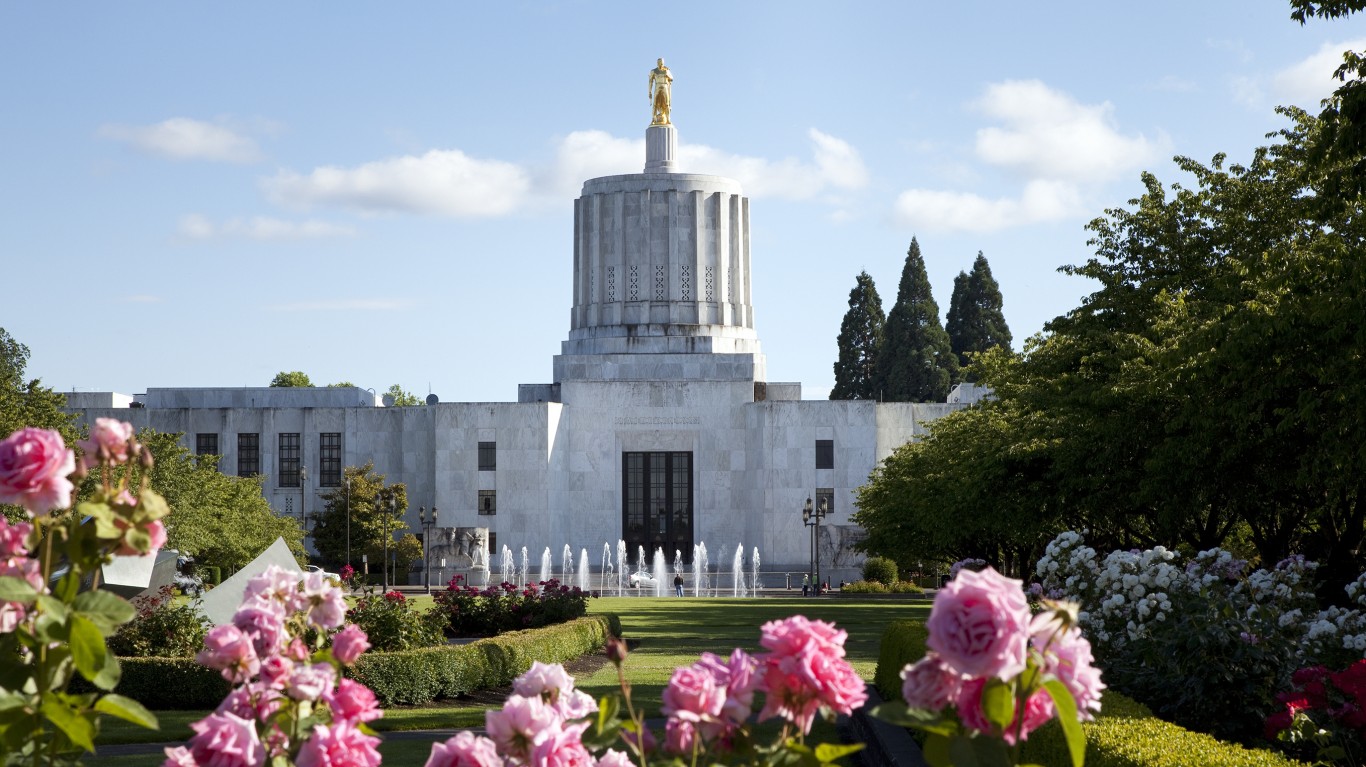
Oregon
> Average statewide spending (2018-2019 school year): $11,722 per pupil (25th lowest)
> Top spending district: Yoncalla SD 32 ($25,744 per pupil)
> Lowest spending district: Santiam Canyon SD 129J ($1,970 per pupil)
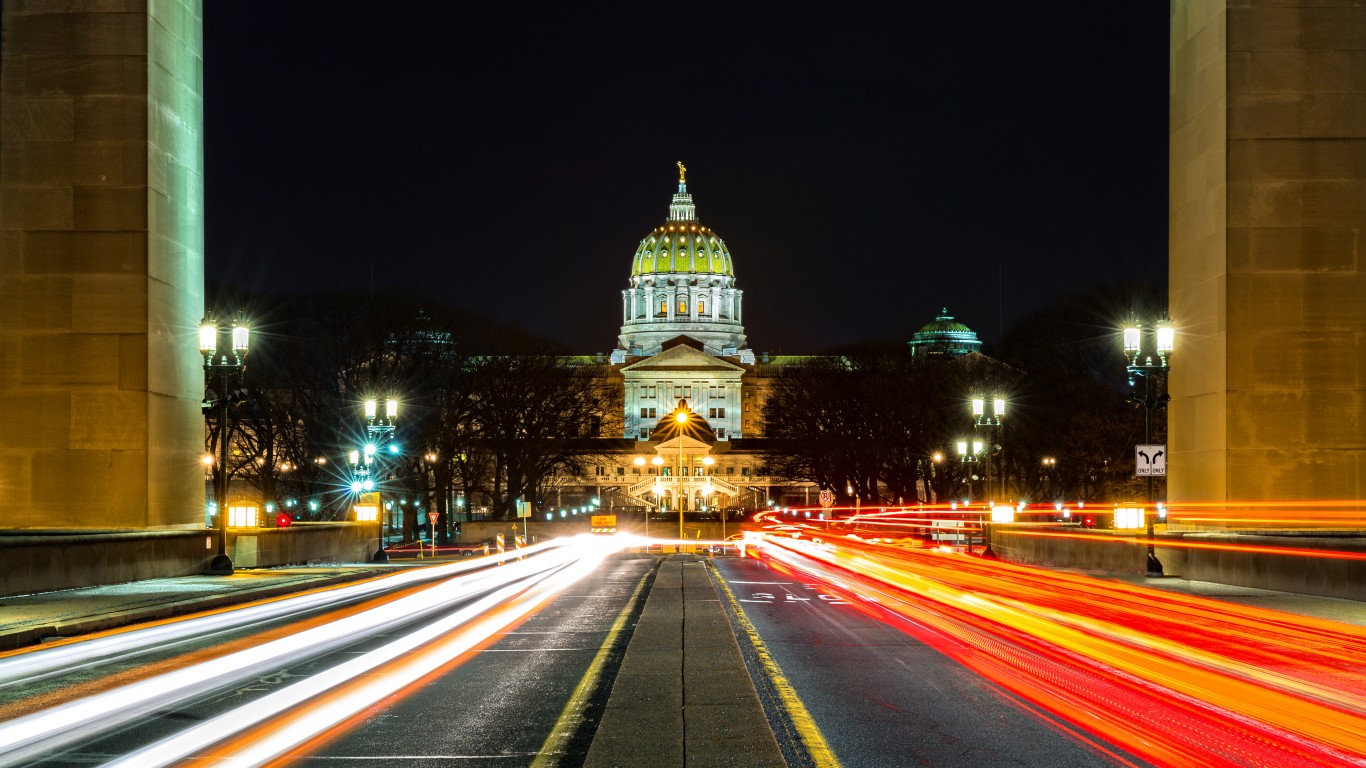
Pennsylvania
> Average statewide spending (2018-2019 school year): $15,340 per pupil (13th highest)
> Top spending district: Wilkinsburg Borough SD ($32,777 per pupil)
> Lowest spending district: Waynesboro Area SD ($11,115 per pupil)

Rhode Island
> Average statewide spending (2018-2019 school year): $16,965 per pupil (7th highest)
> Top spending district: Little Compton ($25,557 per pupil)
> Lowest spending district: Cumberland ($14,499 per pupil)
[in-text-ad-2]
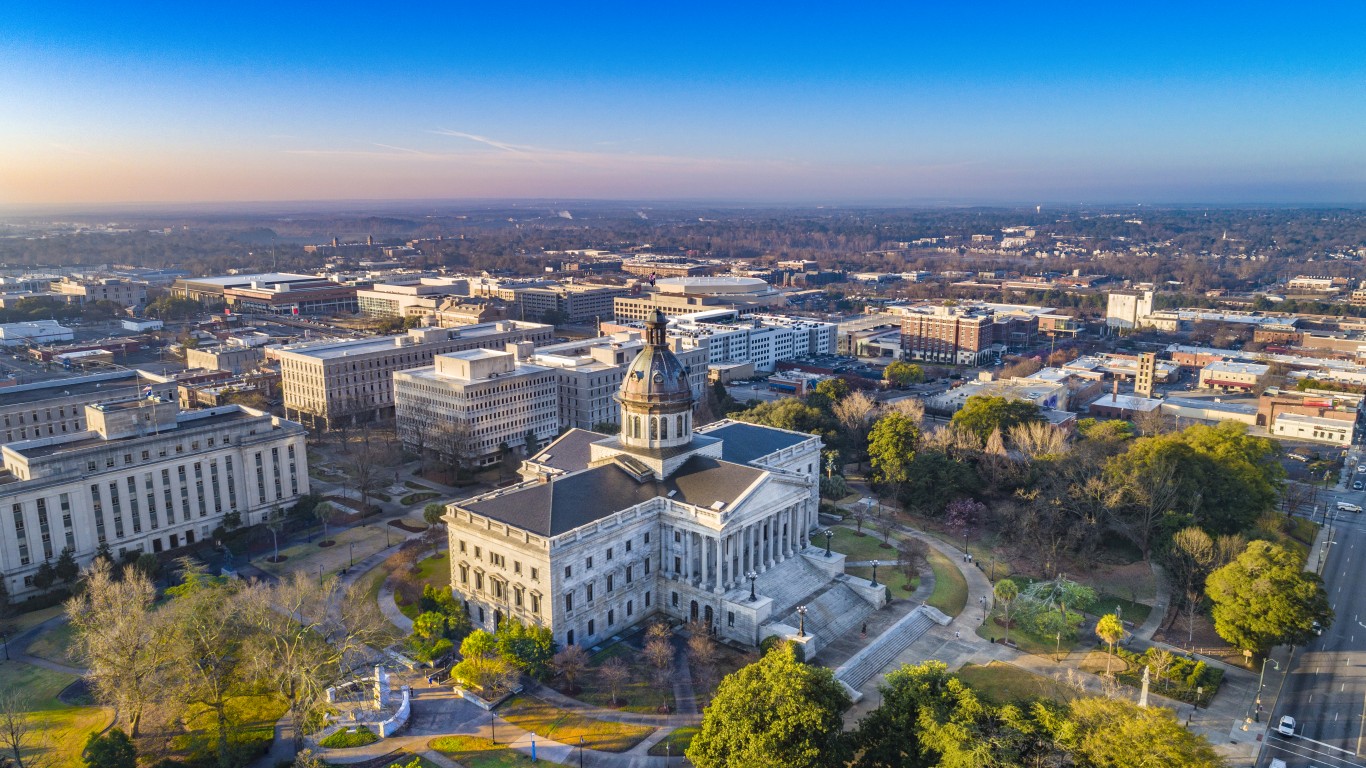
South Carolina
> Average statewide spending (2018-2019 school year): $11,101 per pupil (18th lowest)
> Top spending district: McCormick 01 ($18,565 per pupil)
> Lowest spending district: Anderson 01 ($8,689 per pupil)

South Dakota
> Average statewide spending (2018-2019 school year): $9,985 per pupil (11th lowest)
> Top spending district: Eagle Butte School District 20-1 ($22,115 per pupil)
> Lowest spending district: Hamlin School District 28-3 ($7,738 per pupil)
[in-text-ad]

Tennessee
> Average statewide spending (2018-2019 school year): $9,866 per pupil (10th lowest)
> Top spending district: Franklin SSD ($15,372 per pupil)
> Lowest spending district: Union County ($7,852 per pupil)
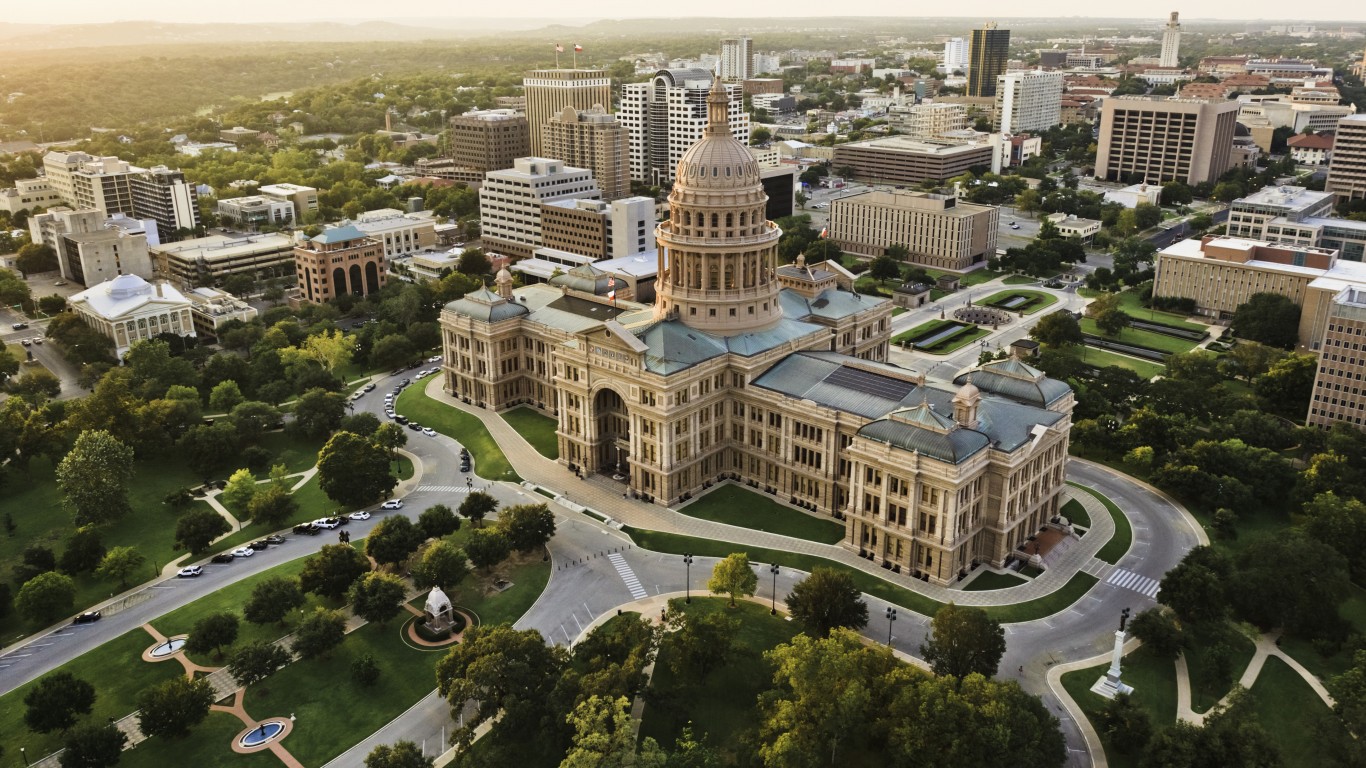
Texas
> Average statewide spending (2018-2019 school year): $9,719 per pupil (8th lowest)
> Top spending district: Borden County ISD ($25,341 per pupil)
> Lowest spending district: Malta ISD ($6,148 per pupil)
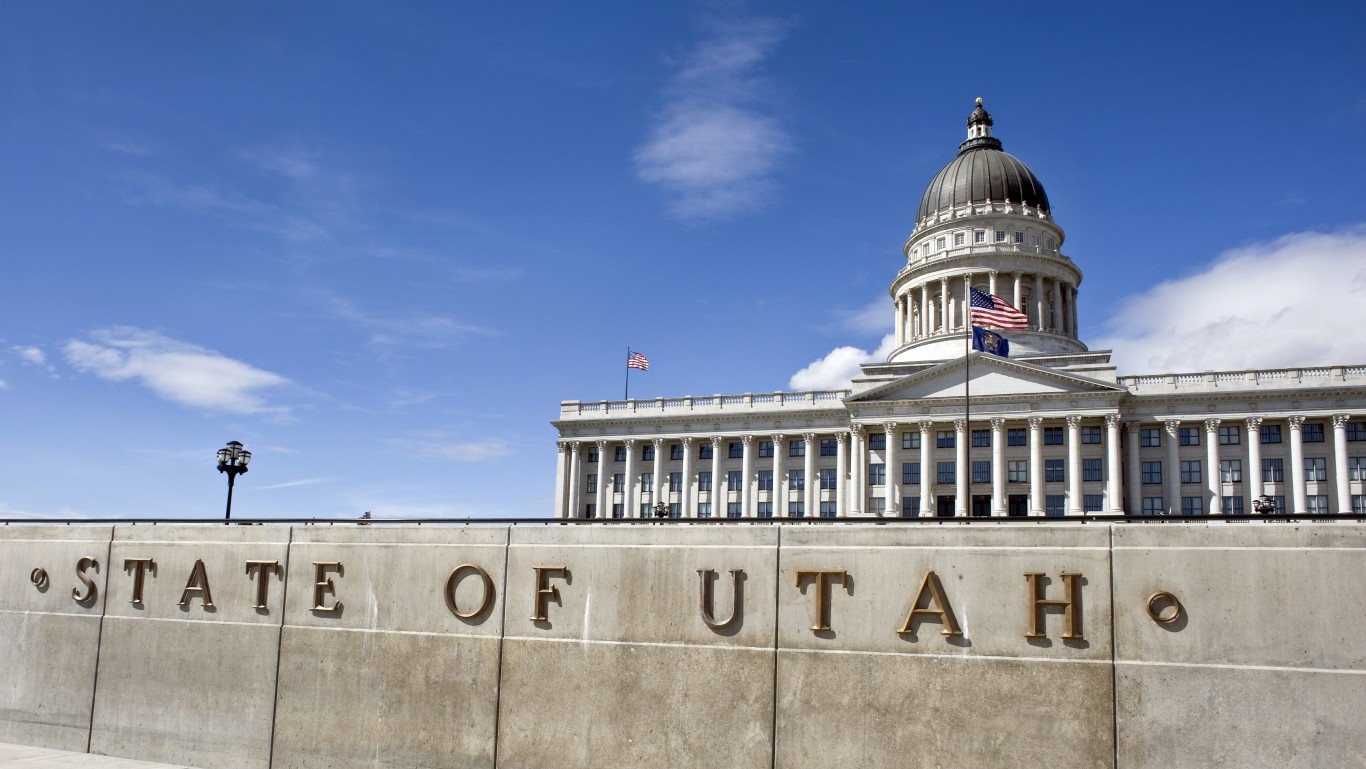
Utah
> Average statewide spending (2018-2019 school year): $8,014 per pupil (2nd lowest)
> Top spending district: Daggett District ($18,684 per pupil)
> Lowest spending district: Morgan District ($6,354 per pupil)
[in-text-ad-2]
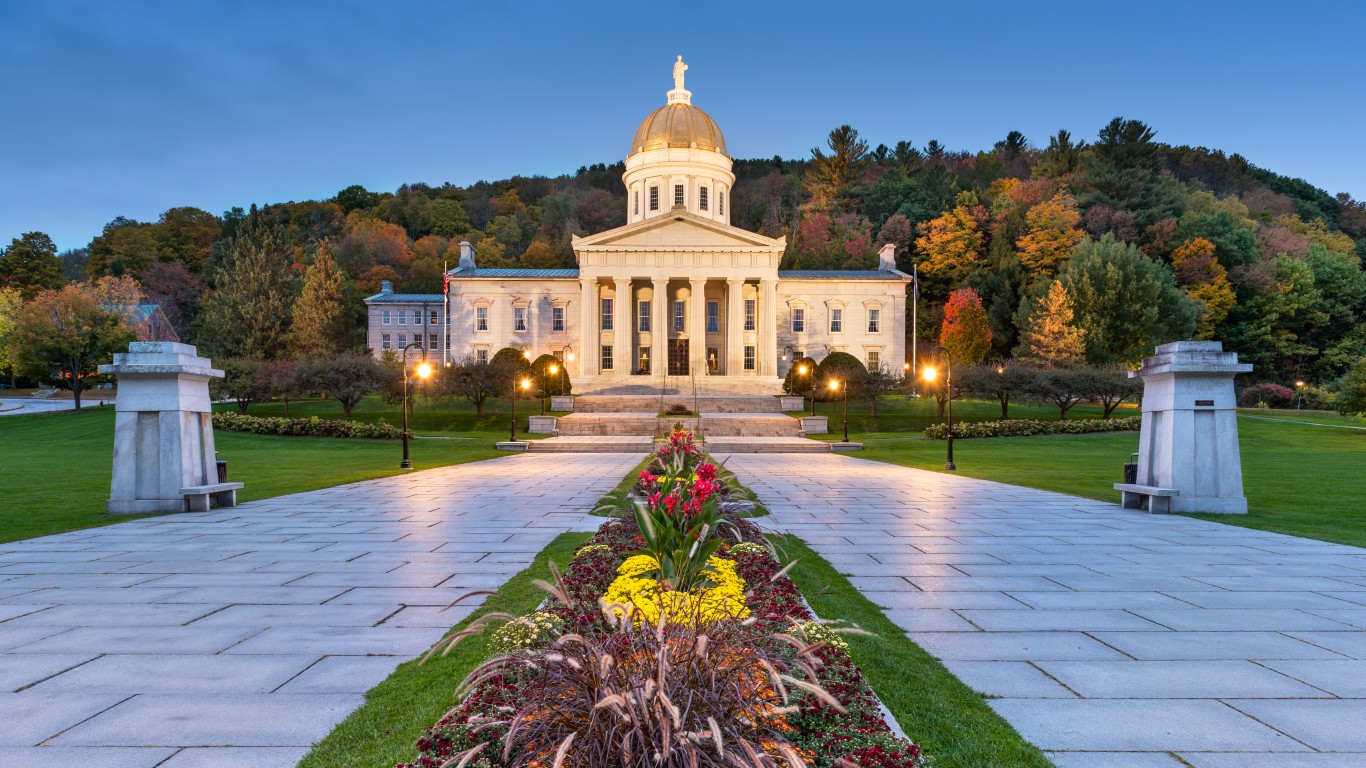
Vermont
> Average statewide spending (2018-2019 school year): $16,613 per pupil (8th highest)
> Top spending district: Oxbow UHSD #30 ($24,236 per pupil)
> Lowest spending district: Bennington Incorporated School District ($7,743 per pupil)
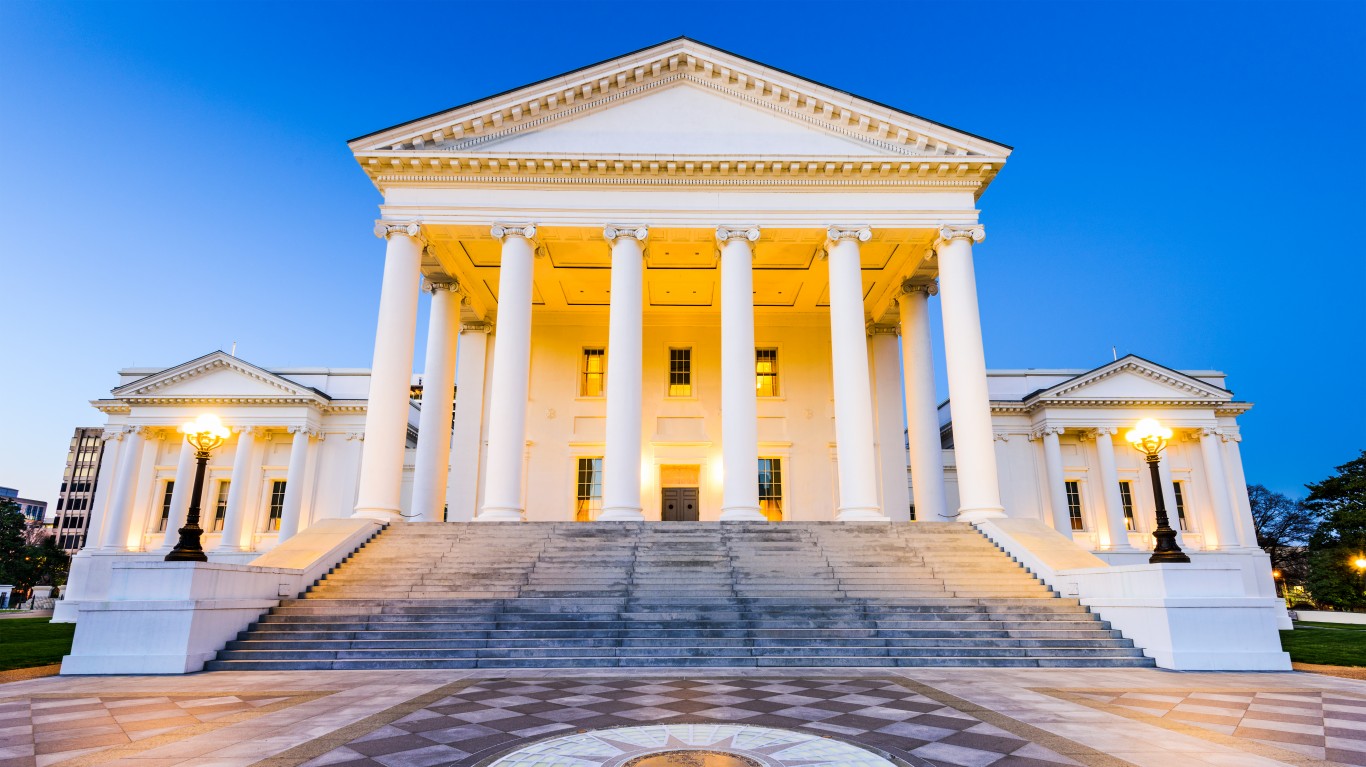
Virginia
> Average statewide spending (2018-2019 school year): $12,640 per pupil (19th highest)
> Top spending district: Surry County Public Schools ($20,648 per pupil)
> Lowest spending district: Norton City Public Schools ($9,163 per pupil)
[in-text-ad]

Washington
> Average statewide spending (2018-2019 school year): $13,997 per pupil (16th highest)
> Top spending district: Inchelium School District ($23,130 per pupil)
> Lowest spending district: Mary M Knight School District ($10,469 per pupil)

West Virginia
> Average statewide spending (2018-2019 school year): $11,944 per pupil (24th highest)
> Top spending district: Doddridge County Schools ($20,118 per pupil)
> Lowest spending district: Hardy County Schools ($10,100 per pupil)

Wisconsin
> Average statewide spending (2018-2019 school year): $12,566 per pupil (21st highest)
> Top spending district: Barneveld School District ($39,785 per pupil)
> Lowest spending district: Erin School District ($9,000 per pupil)
[in-text-ad-2]
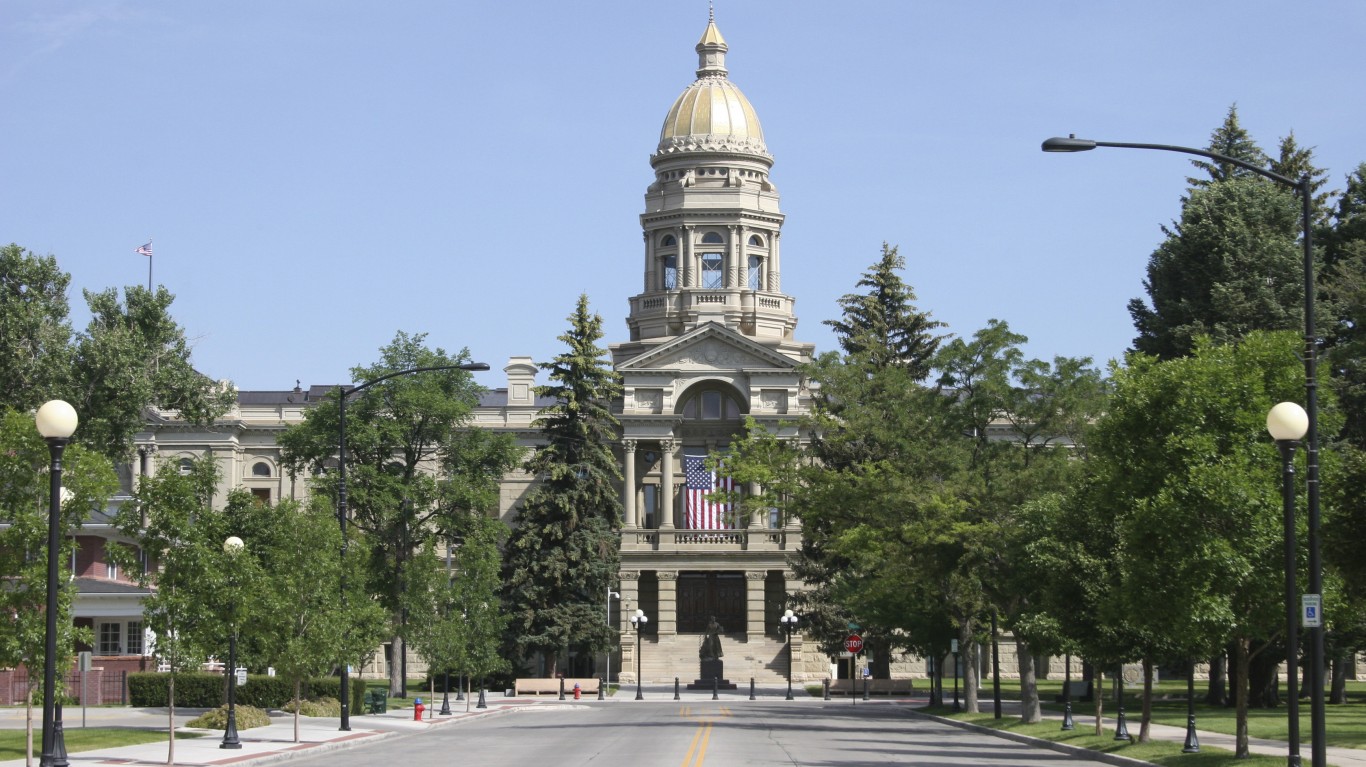
Wyoming
> Average statewide spending (2018-2019 school year): $16,234 per pupil (9th highest)
> Top spending district: Fremont County School District #21 ($31,350 per pupil)
> Lowest spending district: Sweetwater County School District #1 ($14,290 per pupil)
Methodology
To determine school spending by state, 24/7 Wall St. reviewed data on current expenditure per pupil at the school district level in the 2018-2019 school year from the U.S. Department of Education’s National Center for Education Statistics. We calculated the weighted average of current expenditure per pupil for every state using the number of enrolled students for weighting.
School districts classified as specialized public school districts, independent charter districts, supervisory union administrative centers, state agencies providing elementary or secondary level instruction, federal agencies providing elementary or secondary level instruction, or as educational service agencies or vocational or special education school systems, were excluded from analysis. Districts with fewer than 200 students were also excluded from analysis.
Supplemental data on the highest and lowest spending district also came from NCES.
The Average American Has No Idea How Much Money You Can Make Today (Sponsor)
The last few years made people forget how much banks and CD’s can pay. Meanwhile, interest rates have spiked and many can afford to pay you much more, but most are keeping yields low and hoping you won’t notice.
But there is good news. To win qualified customers, some accounts are paying almost 10x the national average! That’s an incredible way to keep your money safe and earn more at the same time. Our top pick for high yield savings accounts includes other benefits as well. You can earn up to 3.80% with a Checking & Savings Account today Sign up and get up to $300 with direct deposit. No account fees. FDIC Insured.
Click here to see how much more you could be earning on your savings today. It takes just a few minutes to open an account to make your money work for you.
Our top pick for high yield savings accounts includes other benefits as well. You can earn up to 4.00% with a Checking & Savings Account from Sofi. Sign up and get up to $300 with direct deposit. No account fees. FDIC Insured.
Thank you for reading! Have some feedback for us?
Contact the 24/7 Wall St. editorial team.
 24/7 Wall St.
 24/7 Wall St.
 24/7 Wall St.
 24/7 Wall St.
 24/7 Wall St.
