A little over one-third of U.S. households live in rented homes. While many associate homeownership with economic stability, renting is often a safer choice, granting more flexibility. In addition, in cities across much of the country, for a large share of residents, particularly young ones, renting is the only financially feasible choice.
To determine the 50 cities with the highest share of renters, 24/7 Wall St. reviewed five-year estimates of the share of housing units that are occupied by renters from the U.S. Census Bureau’s 2020 American Community Survey. Cities needed to have a population of at least 25,000 to be considered.
Nationwide, 35.6% of housing units live in rental properties. Among the 50 cities on this list, that figure ranges from 66.0% to 87.5% of housing units. California and New Jersey are tied as having the most cities on this list, with 12 each; New York is third, with six.
Young people are far more likely to rent homes than buy. Well over half of all renters in the United States are under the age of 35, whereas that age group accounts for less than 10% of homeowners. Many of the counties on this list have such high shares of renters because they have younger populations.
According to the census, 23.2% of Americans are 18-34 years old. In all but one of the places on this list, that age group accounts for a larger share of the population, including 10 where more than half the population is 18-34. In the borough of State College, Pennsylvania, which has the 14th highest rental rate of U.S. cities, an estimated 73% of the population is 18-34, the largest percentage. State College is home to the main campus of Penn State University. A number of other cities on this list are home to college campuses. This is the youngest place in every state.
Population density is a factor in the share of housing units that are occupied by renters. In highly-urban areas, a large share of residents live in multi-story rental buildings, rather than single-family homes. The U.S. population density is 93 people per square mile. The majority of the places on this list have more than 10,000 people per square mile. Of the 50 places on this list, 21 fall within the top 100 nationwide for population density, including Union City, New Jersey, which has the highest population density of any place in the country, with the equivalent of 53,293 per square mile. These are the colleges with the largest increase in applicants.
In a number of cities where a higher share of housing units are rentals, property is very expensive and many residents are priced out of the housing market. While rent also tends to be high in these places, renting is a considerably more affordable option. In roughly two-thirds of the places on this list, the typical home is worth more than the U.S. median home value of $229,800. This includes Santa Monica, California, where the typical home is worth nearly $1.5 million. These are the counties with the highest rent in America.
Click here to see the cities where most homes are rented
Click here to read our detailed methodology

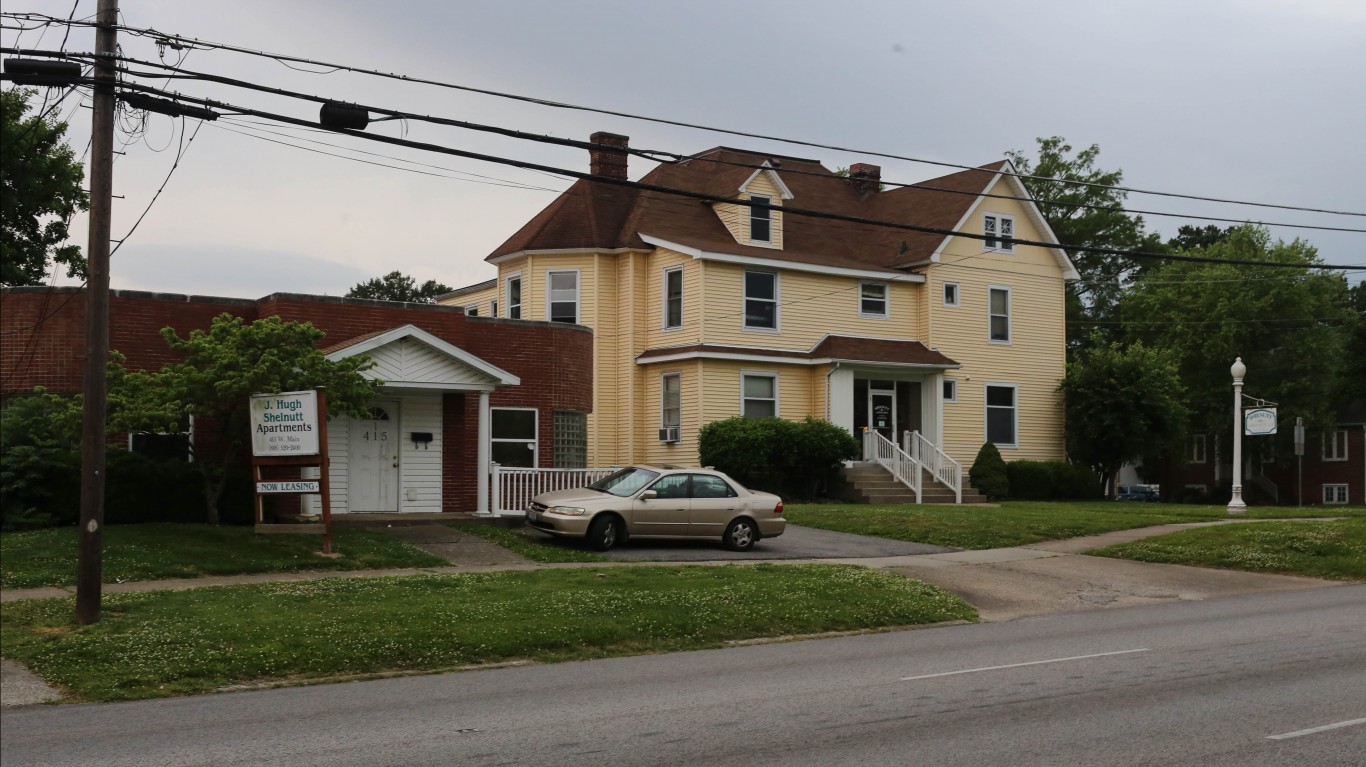
50. Glendale, California
> Rental occupied housing units: 66.0%
> Median rental cost: $1,711 — 268th highest of 1,769 cities (tied)
> Median home value: $821,500 — 76th highest of 1,769 cities
> Median household income: $70,596 — 786th highest of 1,769 cities
[in-text-ad]
49. Troy, New York
> Rental occupied housing units: 66.2%
> Median rental cost: $964 — 487th lowest of 1,769 cities (tied)
> Median home value: $149,900 — 317th lowest of 1,769 cities
> Median household income: $48,834 — 350th lowest of 1,769 cities
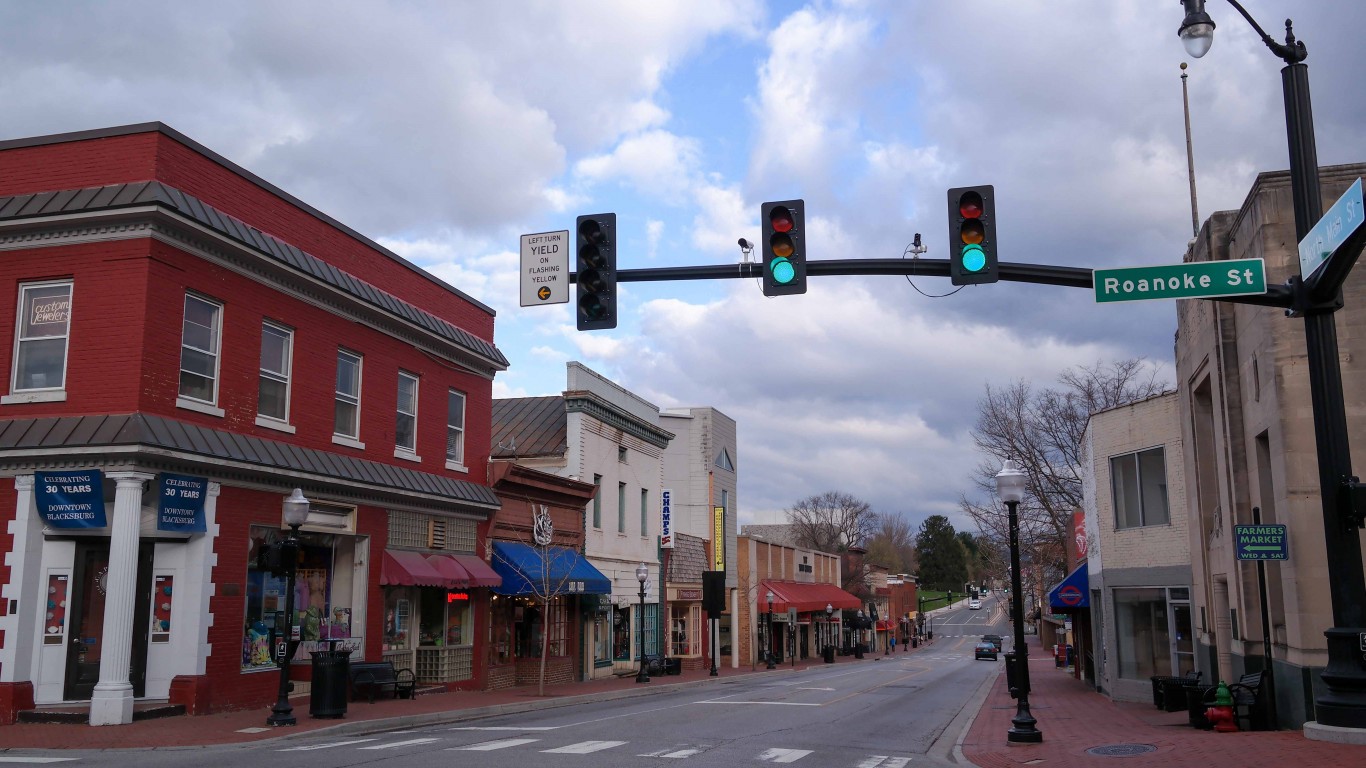
48. Blacksburg, Virginia
> Rental occupied housing units: 66.3%
> Median rental cost: $1,141 — 801st lowest of 1,769 cities (tied)
> Median home value: $309,800 — 665th highest of 1,769 cities
> Median household income: $41,711 — 137th lowest of 1,769 cities

47. Hackensack, New Jersey
> Rental occupied housing units: 66.3%
> Median rental cost: $1,493 — 443rd highest of 1,769 cities
> Median home value: $306,700 — 671st highest of 1,769 cities
> Median household income: $71,079 — 773rd highest of 1,769 cities
[in-text-ad-2]
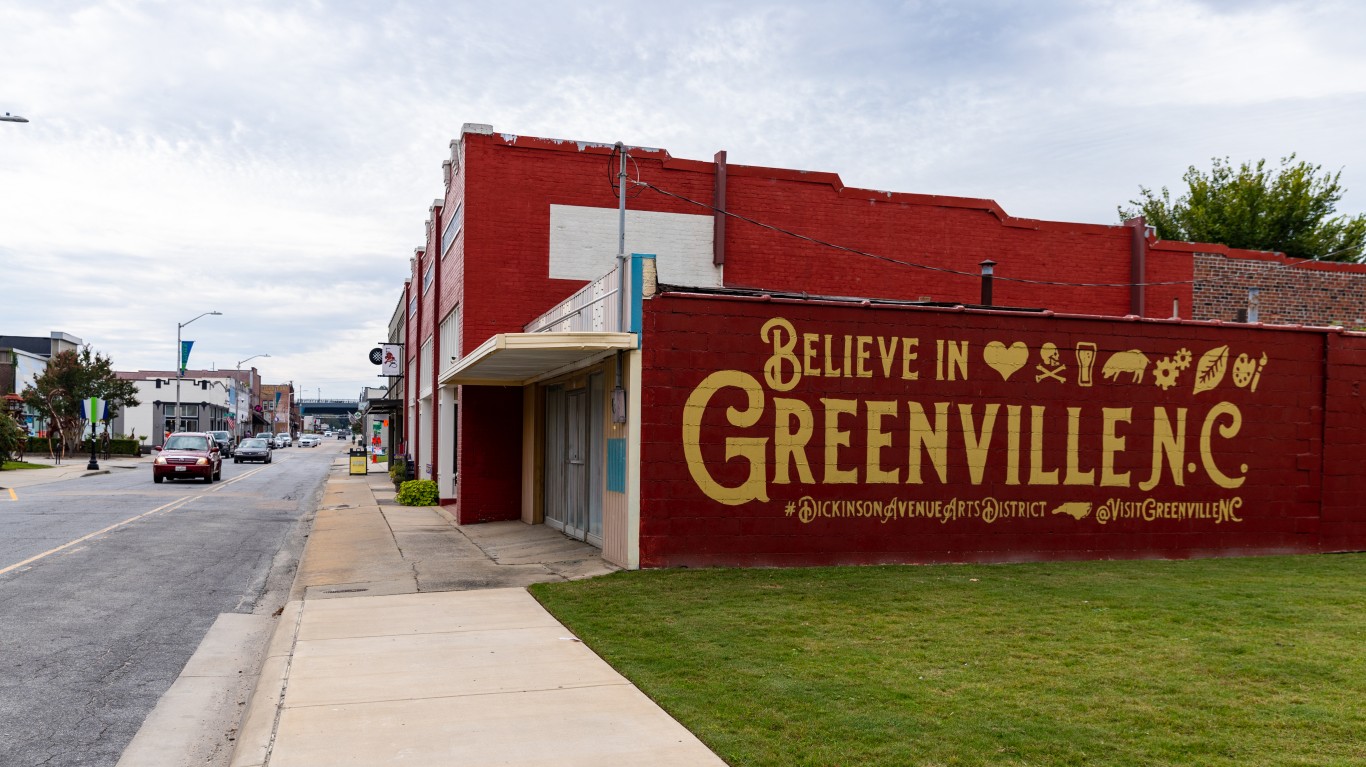
46. Greenville, North Carolina
> Rental occupied housing units: 66.4%
> Median rental cost: $823 — 224th lowest of 1,769 cities (tied)
> Median home value: $159,400 — 373rd lowest of 1,769 cities
> Median household income: $42,612 — 162nd lowest of 1,769 cities
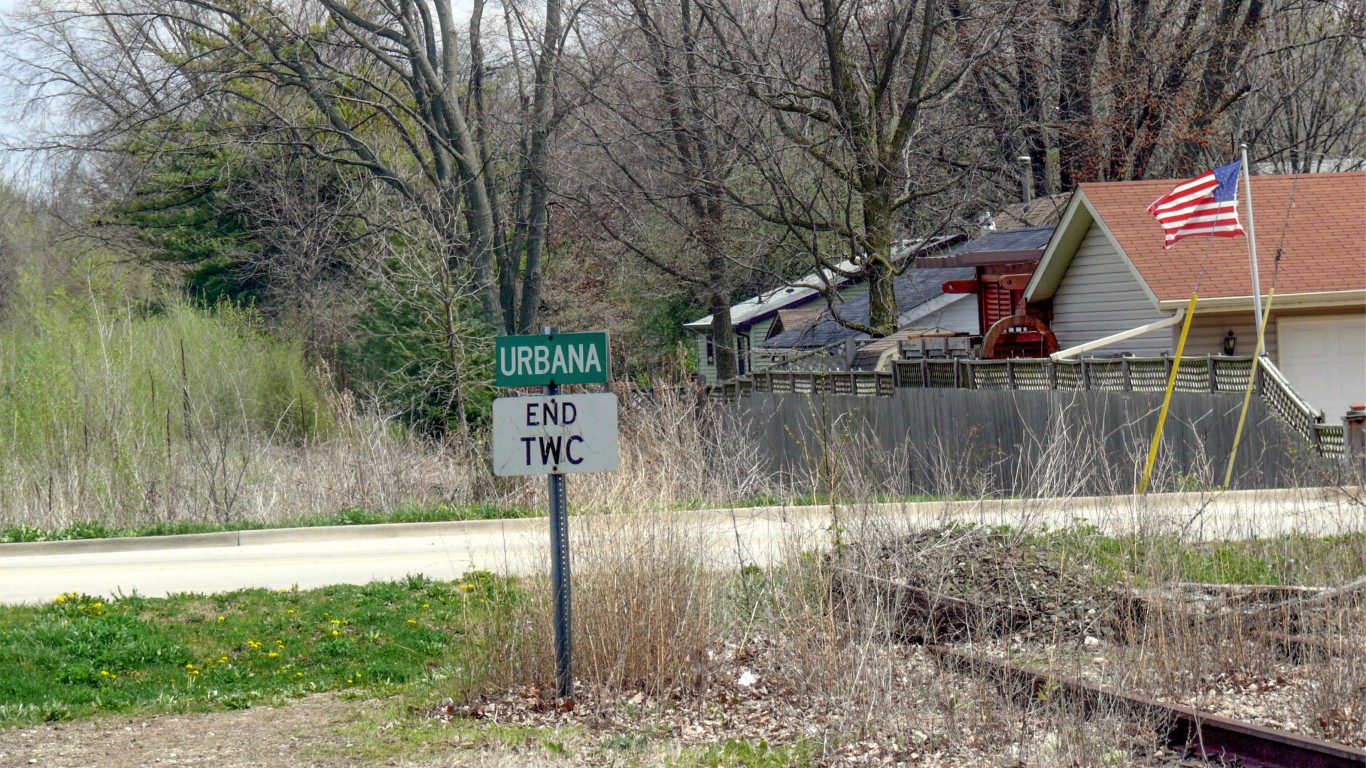
45. Urbana, Illinois
> Rental occupied housing units: 66.5%
> Median rental cost: $833 — 244th lowest of 1,769 cities (tied)
> Median home value: $151,700 — 327th lowest of 1,769 cities (tied)
> Median household income: $35,984 — 47th lowest of 1,769 cities
[in-text-ad]

44. Somerville, Massachusetts
> Rental occupied housing units: 66.5%
> Median rental cost: $2,026 — 107th highest of 1,769 cities (tied)
> Median home value: $709,800 — 113th highest of 1,769 cities
> Median household income: $102,311 — 248th highest of 1,769 cities

43. Jacksonville, North Carolina
> Rental occupied housing units: 67.0%
> Median rental cost: $1,032 — 596th lowest of 1,769 cities (tied)
> Median home value: $157,000 — 362nd lowest of 1,769 cities
> Median household income: $45,754 — 243rd lowest of 1,769 cities
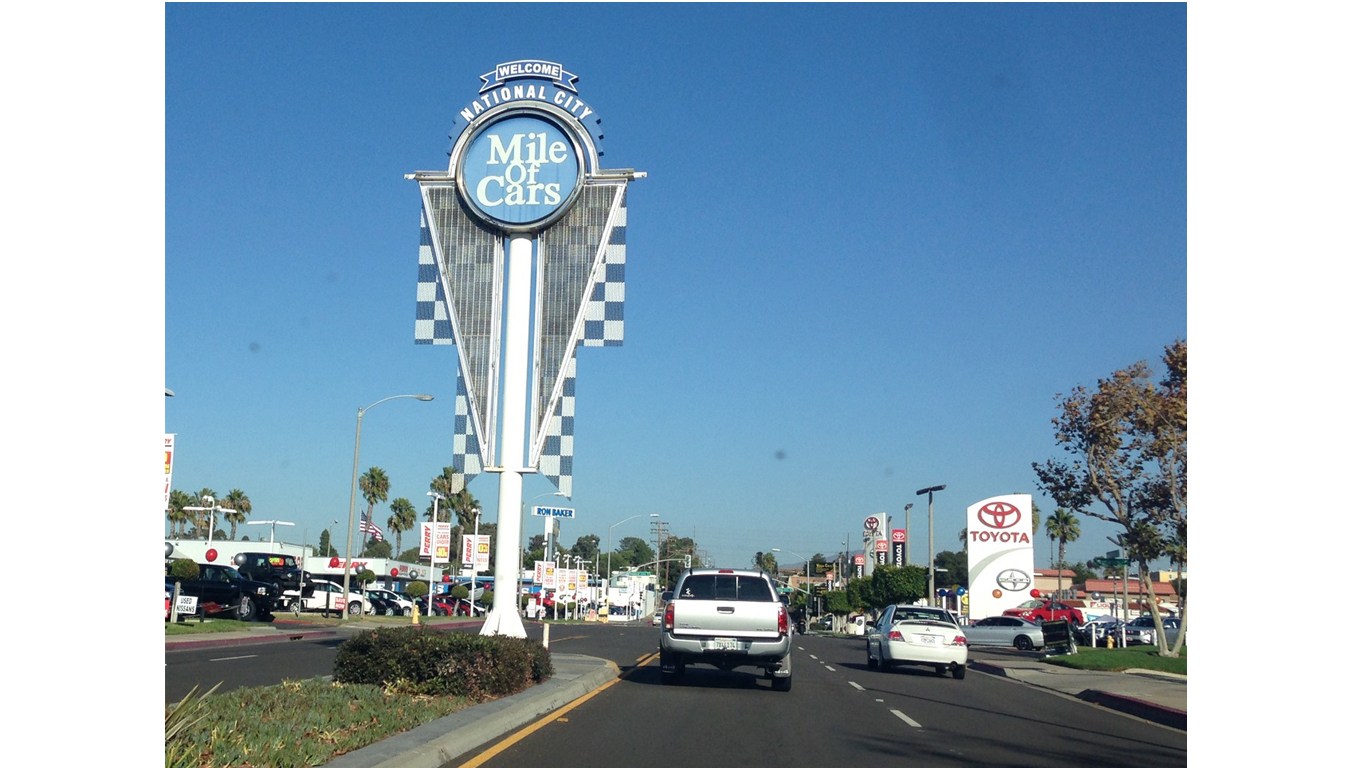
42. National City, California
> Rental occupied housing units: 67.1%
> Median rental cost: $1,266 — 749th highest of 1,769 cities (tied)
> Median home value: $428,800 — 362nd highest of 1,769 cities (tied)
> Median household income: $49,176 — 363rd lowest of 1,769 cities
[in-text-ad-2]

41. New York, New York
> Rental occupied housing units: 67.2%
> Median rental cost: $1,489 — 448th highest of 1,769 cities (tied)
> Median home value: $635,200 — 148th highest of 1,769 cities
> Median household income: $67,046 — 862nd highest of 1,769 cities
40. Imperial Beach, California
> Rental occupied housing units: 67.7%
> Median rental cost: $1,487 — 452nd highest of 1,769 cities (tied)
> Median home value: $593,400 — 182nd highest of 1,769 cities
> Median household income: $59,795 — 701st lowest of 1,769 cities
[in-text-ad]

39. Newburgh, New York
> Rental occupied housing units: 67.9%
> Median rental cost: $1,139 — 797th lowest of 1,769 cities (tied)
> Median home value: $159,500 — 374th lowest of 1,769 cities (tied)
> Median household income: $43,435 — 189th lowest of 1,769 cities
38. Bell, California
> Rental occupied housing units: 68.0%
> Median rental cost: $1,216 — 831st highest of 1,769 cities
> Median home value: $436,400 — 348th highest of 1,769 cities
> Median household income: $47,740 — 311th lowest of 1,769 cities

37. Twentynine Palms, California
> Rental occupied housing units: 69.0%
> Median rental cost: $975 — 515th lowest of 1,769 cities (tied)
> Median home value: $139,400 — 264th lowest of 1,769 cities
> Median household income: $42,959 — 171st lowest of 1,769 cities
[in-text-ad-2]
36. Perth Amboy, New Jersey
> Rental occupied housing units: 69.5%
> Median rental cost: $1,387 — 582nd highest of 1,769 cities (tied)
> Median home value: $270,500 — 789th highest of 1,769 cities
> Median household income: $54,188 — 531st lowest of 1,769 cities
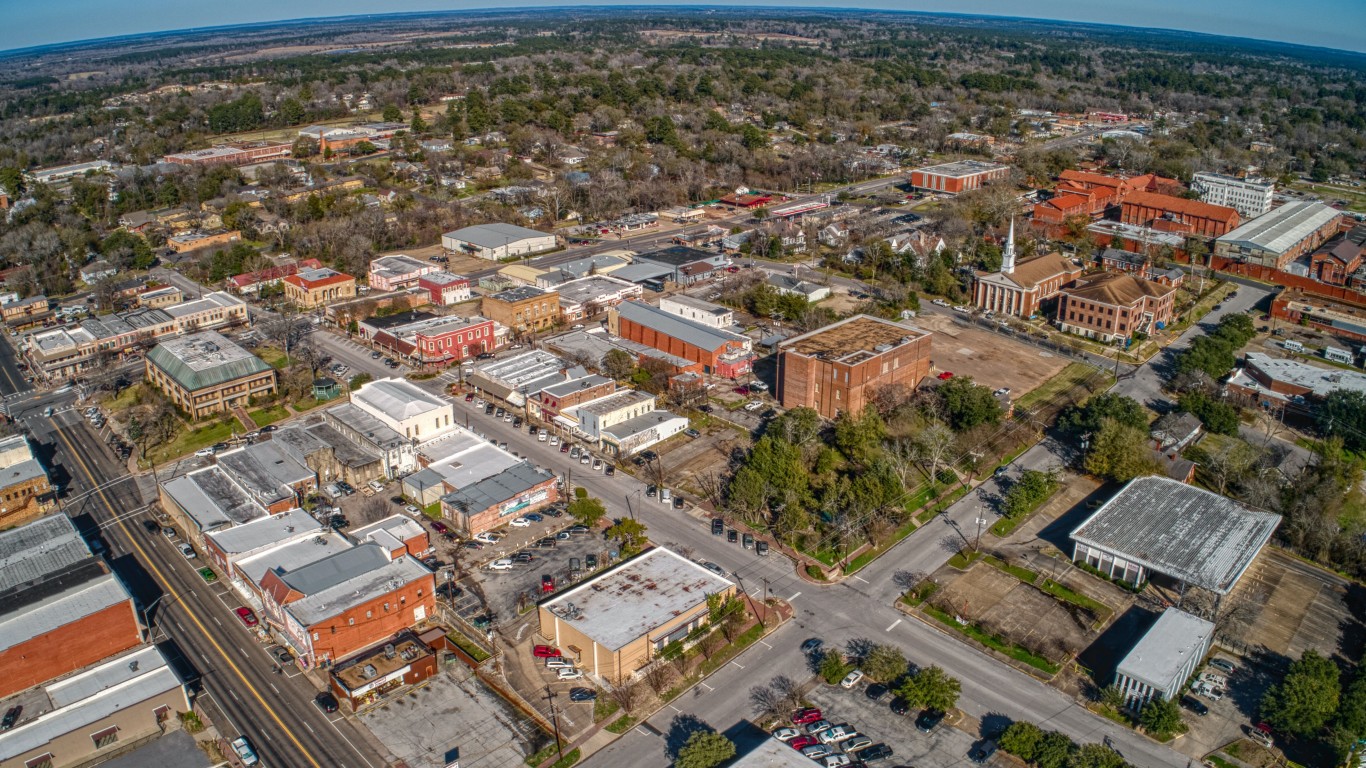
35. Huntsville, Texas
> Rental occupied housing units: 69.6%
> Median rental cost: $887 — 356th lowest of 1,769 cities (tied)
> Median home value: $168,800 — 449th lowest of 1,769 cities
> Median household income: $31,020 — 13th lowest of 1,769 cities
[in-text-ad]
34. Miami, Florida
> Rental occupied housing units: 69.6%
> Median rental cost: $1,242 — 786th highest of 1,769 cities
> Median home value: $344,300 — 557th highest of 1,769 cities
> Median household income: $44,268 — 209th lowest of 1,769 cities

33. Rexburg, Idaho
> Rental occupied housing units: 70.1%
> Median rental cost: $765 — 121st lowest of 1,769 cities (tied)
> Median home value: $221,700 — 735th lowest of 1,769 cities
> Median household income: $33,278 — 26th lowest of 1,769 cities
32. Winchester, Nevada
> Rental occupied housing units: 70.3%
> Median rental cost: $919 — 404th lowest of 1,769 cities (tied)
> Median home value: $172,300 — 478th lowest of 1,769 cities
> Median household income: $39,368 — 93rd lowest of 1,769 cities
[in-text-ad-2]

31. Lawrence, Massachusetts
> Rental occupied housing units: 70.3%
> Median rental cost: $1,188 — 881st highest of 1,769 cities (tied)
> Median home value: $280,800 — 753rd highest of 1,769 cities
> Median household income: $45,045 — 225th lowest of 1,769 cities

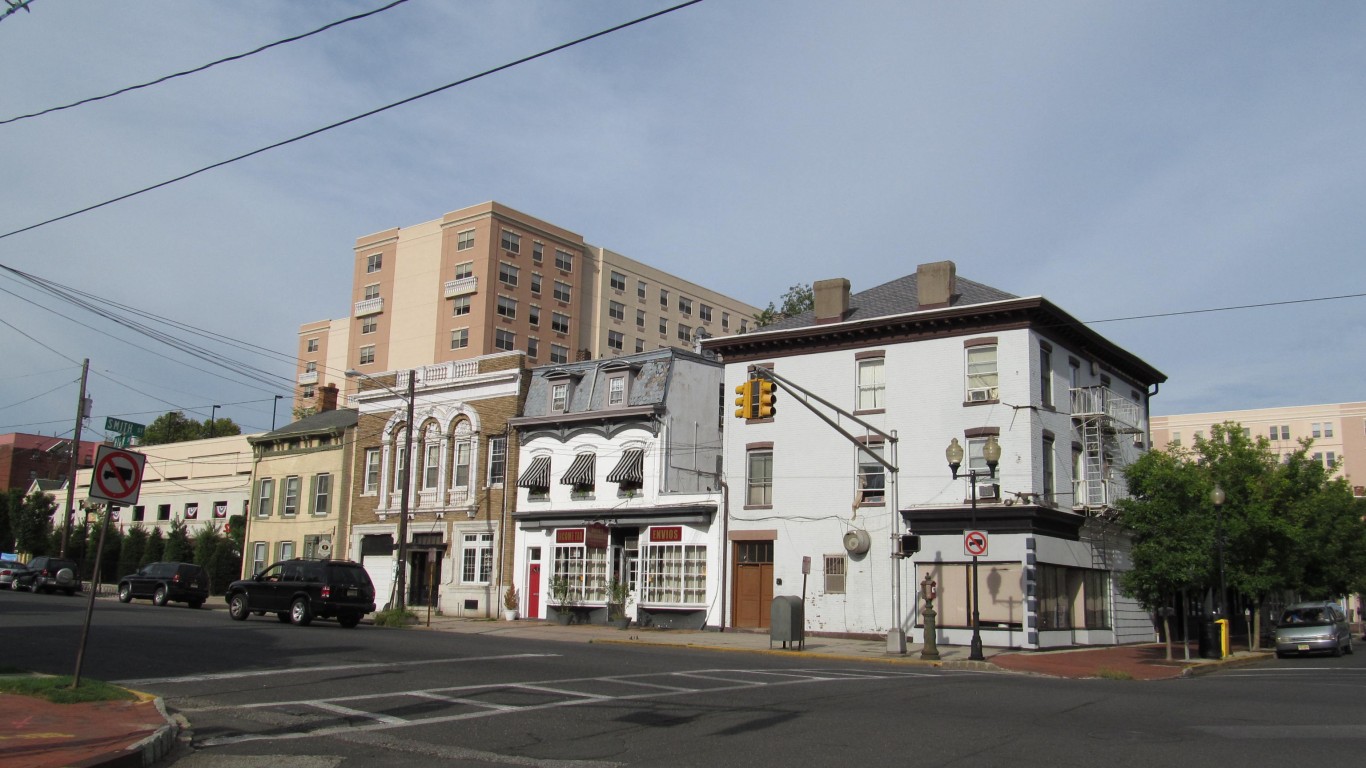
30. Jersey City, New Jersey
> Rental occupied housing units: 70.4%
> Median rental cost: $1,485 — 455th highest of 1,769 cities (tied)
> Median home value: $406,200 — 402nd highest of 1,769 cities
> Median household income: $76,444 — 640th highest of 1,769 cities
[in-text-ad]

29. San Marcos, Texas
> Rental occupied housing units: 70.9%
> Median rental cost: $1,099 — 720th lowest of 1,769 cities (tied)
> Median home value: $185,300 — 546th lowest of 1,769 cities (tied)
> Median household income: $42,030 — 148th lowest of 1,769 cities
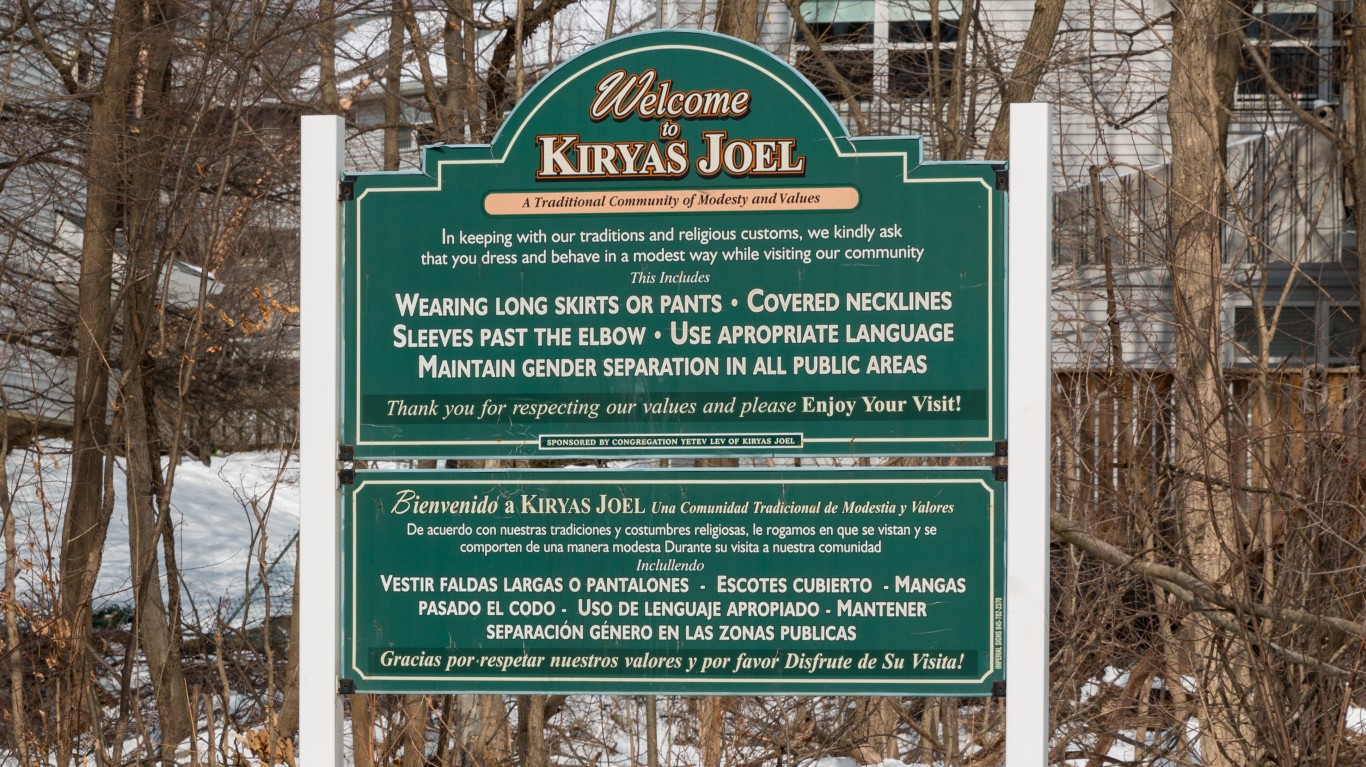
28. Kiryas Joel, New York
> Rental occupied housing units: 71.0%
> Median rental cost: $1,245 — 783rd highest of 1,769 cities
> Median home value: $530,700 — 229th highest of 1,769 cities
> Median household income: $35,437 — 44th lowest of 1,769 cities
27. Carbondale, Illinois
> Rental occupied housing units: 71.3%
> Median rental cost: $698 — 37th lowest of 1,769 cities
> Median home value: $122,700 — 174th lowest of 1,769 cities
> Median household income: $24,093 — 2nd lowest of 1,769 cities
[in-text-ad-2]

26. Westmont, California
> Rental occupied housing units: 71.4%
> Median rental cost: $1,212 — 840th highest of 1,769 cities (tied)
> Median home value: $460,700 — 301st highest of 1,769 cities
> Median household income: $41,119 — 122nd lowest of 1,769 cities (tied)

25. Pullman, Washington
> Rental occupied housing units: 71.4%
> Median rental cost: $856 — 290th lowest of 1,769 cities (tied)
> Median home value: $287,700 — 724th highest of 1,769 cities
> Median household income: $32,073 — 18th lowest of 1,769 cities
[in-text-ad]

24. Atlantic City, New Jersey
> Rental occupied housing units: 71.8%
> Median rental cost: $927 — 422nd lowest of 1,769 cities (tied)
> Median home value: $150,000 — 318th lowest of 1,769 cities (tied)
> Median household income: $29,526 — 7th lowest of 1,769 cities
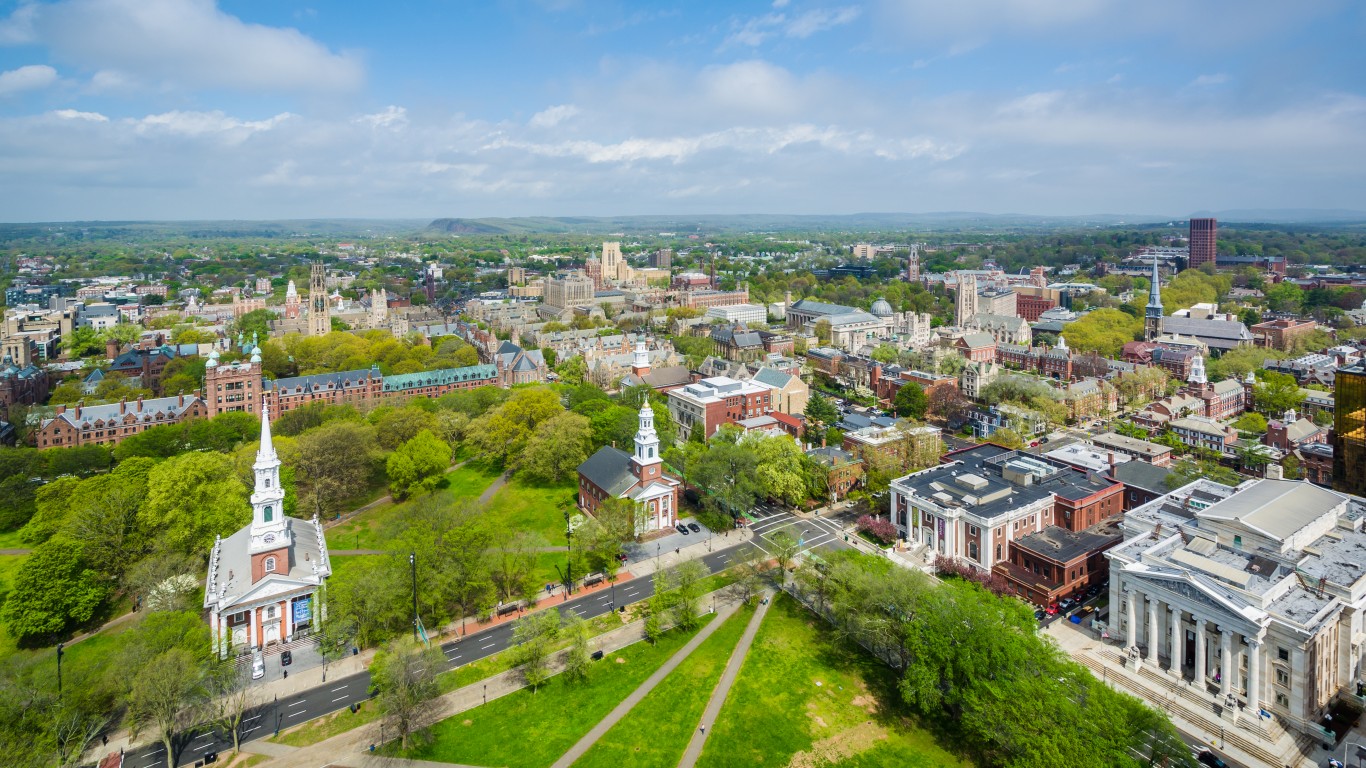
23. New Haven, Connecticut
> Rental occupied housing units: 72.0%
> Median rental cost: $1,219 — 823rd highest of 1,769 cities
> Median home value: $205,100 — 653rd lowest of 1,769 cities (tied)
> Median household income: $44,507 — 213th lowest of 1,769 cities (tied)

22. Santa Monica, California
> Rental occupied housing units: 72.1%
> Median rental cost: $1,900 — 157th highest of 1,769 cities
> Median home value: $1,452,100 — 15th highest of 1,769 cities
> Median household income: $98,300 — 310th highest of 1,769 cities
[in-text-ad-2]
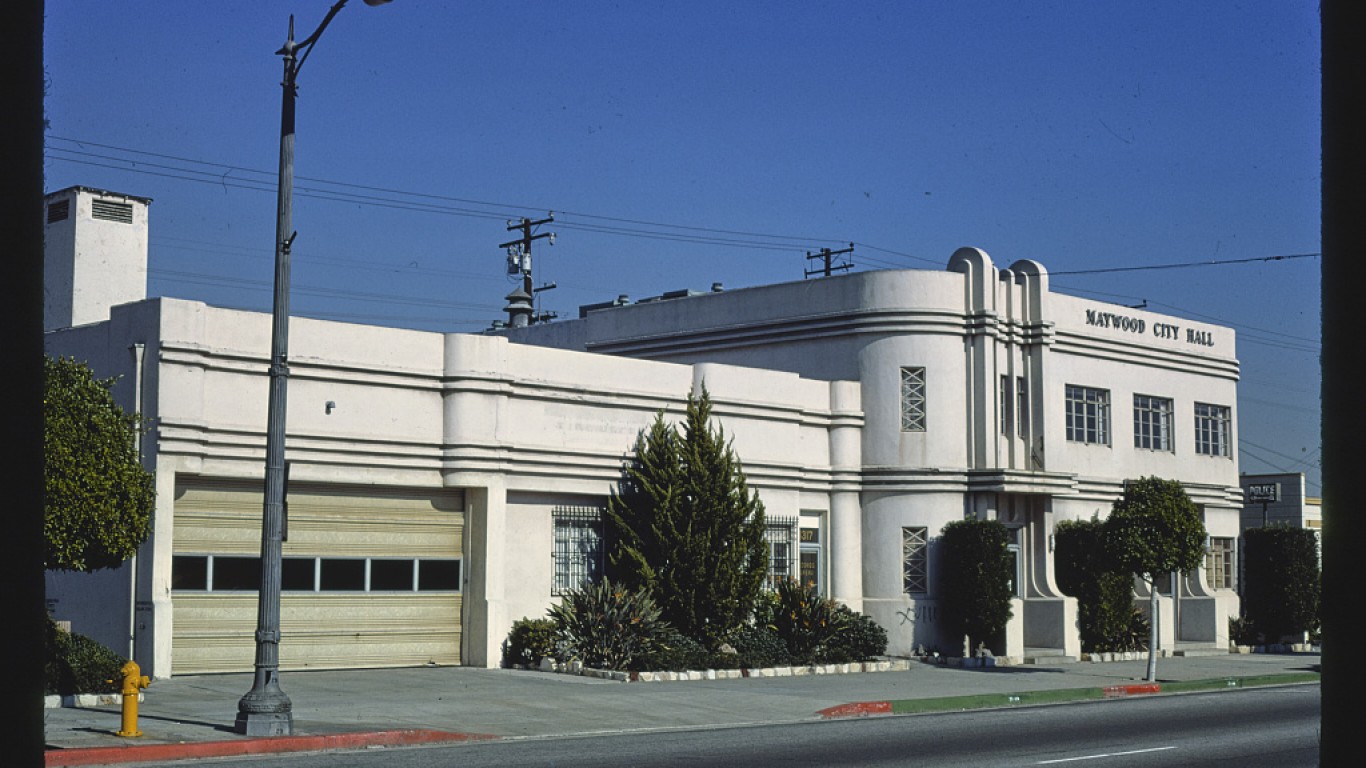
21. Maywood, California
> Rental occupied housing units: 72.3%
> Median rental cost: $1,153 — 821st lowest of 1,769 cities (tied)
> Median home value: $427,300 — 367th highest of 1,769 cities
> Median household income: $50,996 — 432nd lowest of 1,769 cities
20. Salisbury, Maryland
> Rental occupied housing units: 72.5%
> Median rental cost: $1,061 — 644th lowest of 1,769 cities (tied)
> Median home value: $167,800 — 442nd lowest of 1,769 cities (tied)
> Median household income: $44,474 — 212th lowest of 1,769 cities
[in-text-ad]
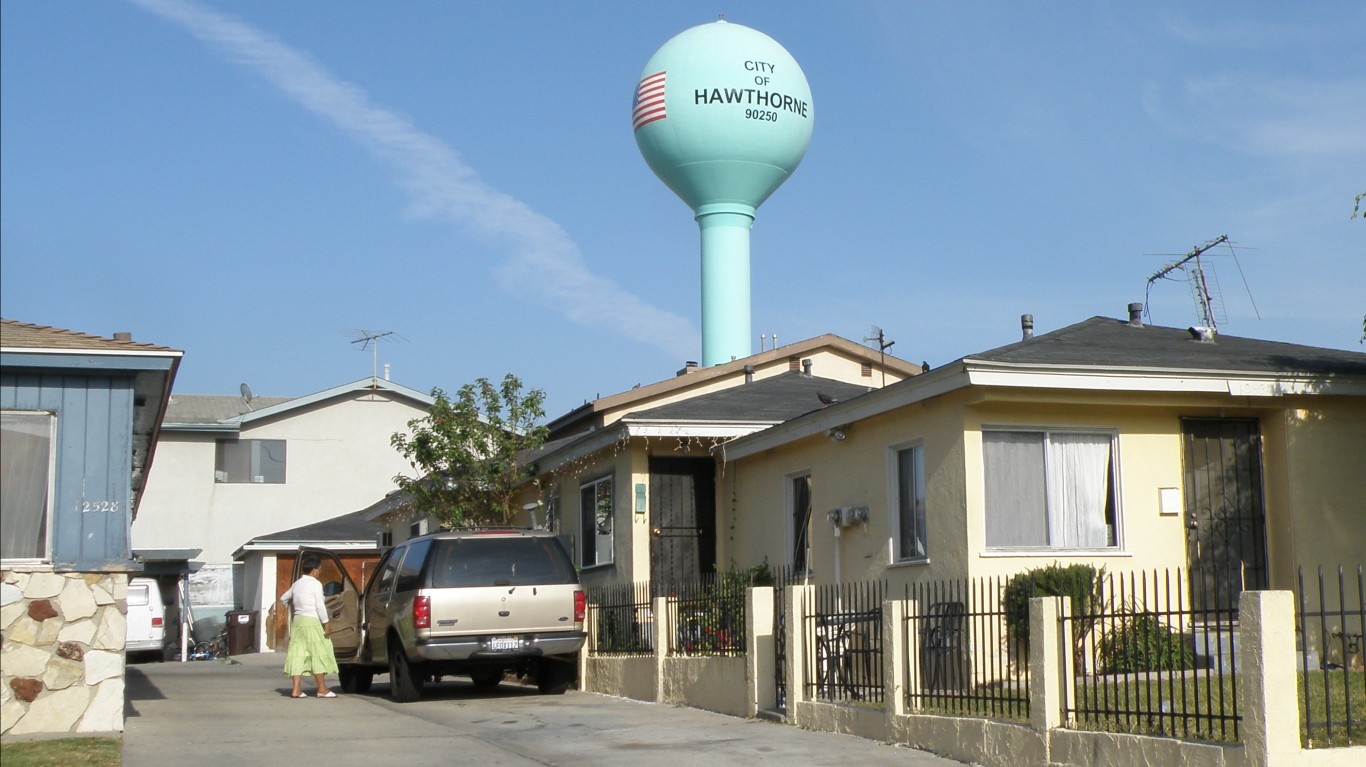
19. Hawthorne, California
> Rental occupied housing units: 72.5%
> Median rental cost: $1,335 — 657th highest of 1,769 cities
> Median home value: $602,100 — 170th highest of 1,769 cities
> Median household income: $57,849 — 654th lowest of 1,769 cities
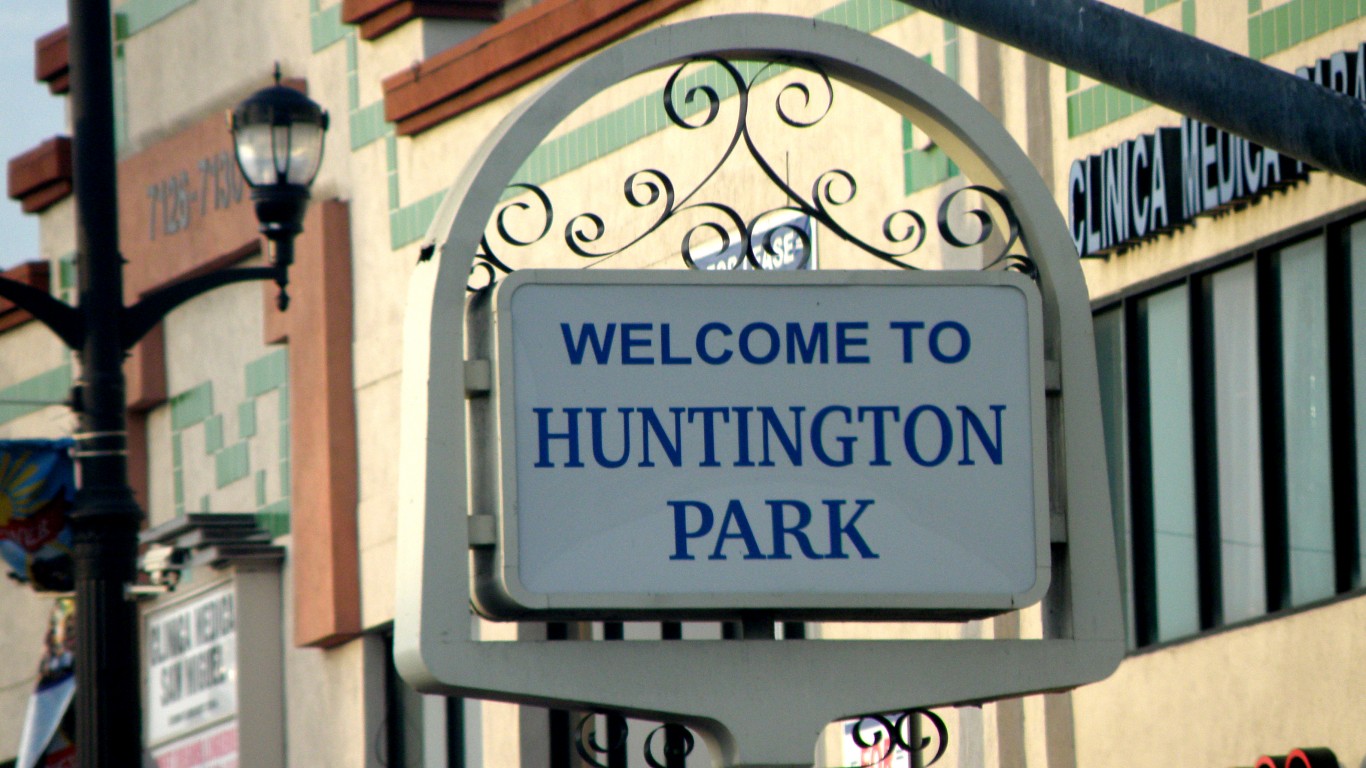
18. Huntington Park, California
> Rental occupied housing units: 72.6%
> Median rental cost: $1,143 — 804th lowest of 1,769 cities (tied)
> Median home value: $426,700 — 368th highest of 1,769 cities
> Median household income: $46,738 — 271st lowest of 1,769 cities

17. State College, Pennsylvania
> Rental occupied housing units: 73.1%
> Median rental cost: $1,083 — 672nd lowest of 1,769 cities (tied)
> Median home value: $332,100 — 594th highest of 1,769 cities (tied)
> Median household income: $38,076 — 78th lowest of 1,769 cities
[in-text-ad-2]
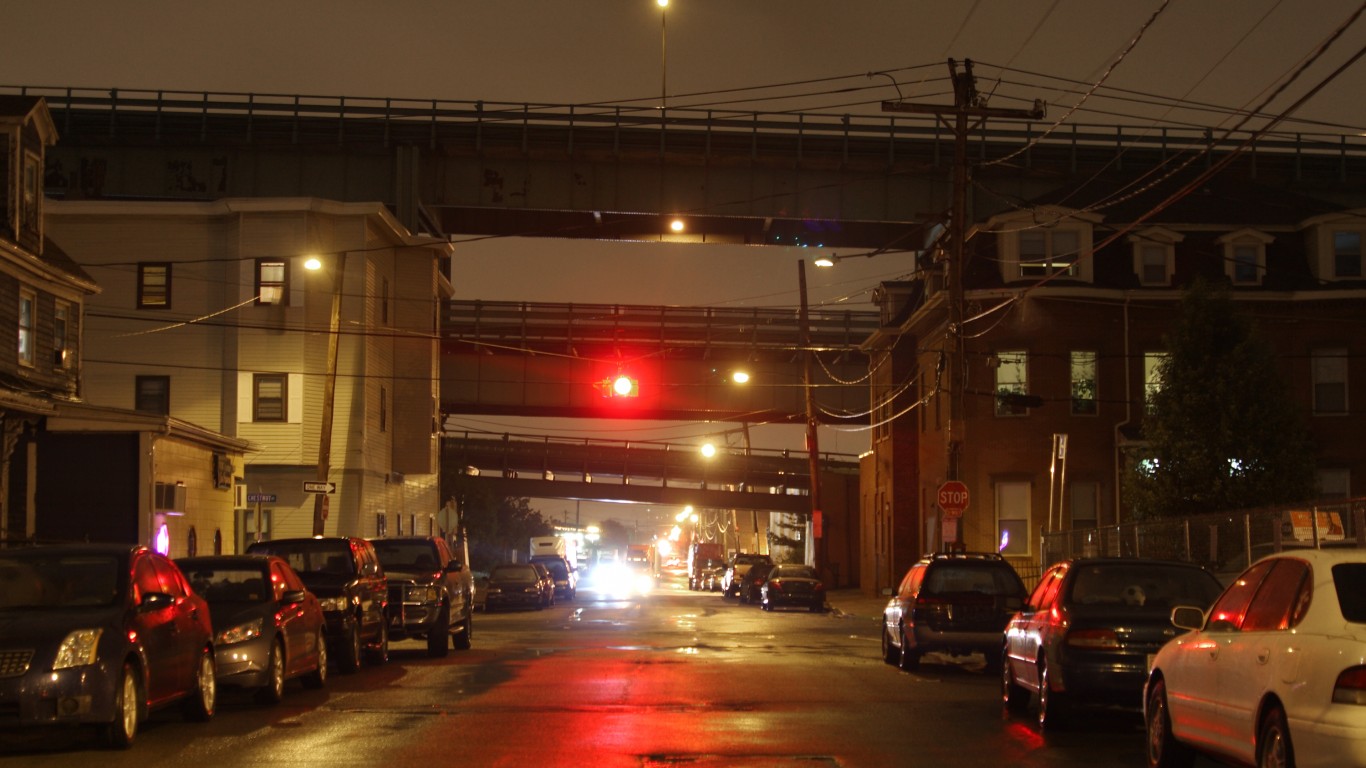
16. Chelsea, Massachusetts
> Rental occupied housing units: 73.1%
> Median rental cost: $1,474 — 471st highest of 1,769 cities
> Median home value: $369,900 — 478th highest of 1,769 cities
> Median household income: $60,370 — 716th lowest of 1,769 cities
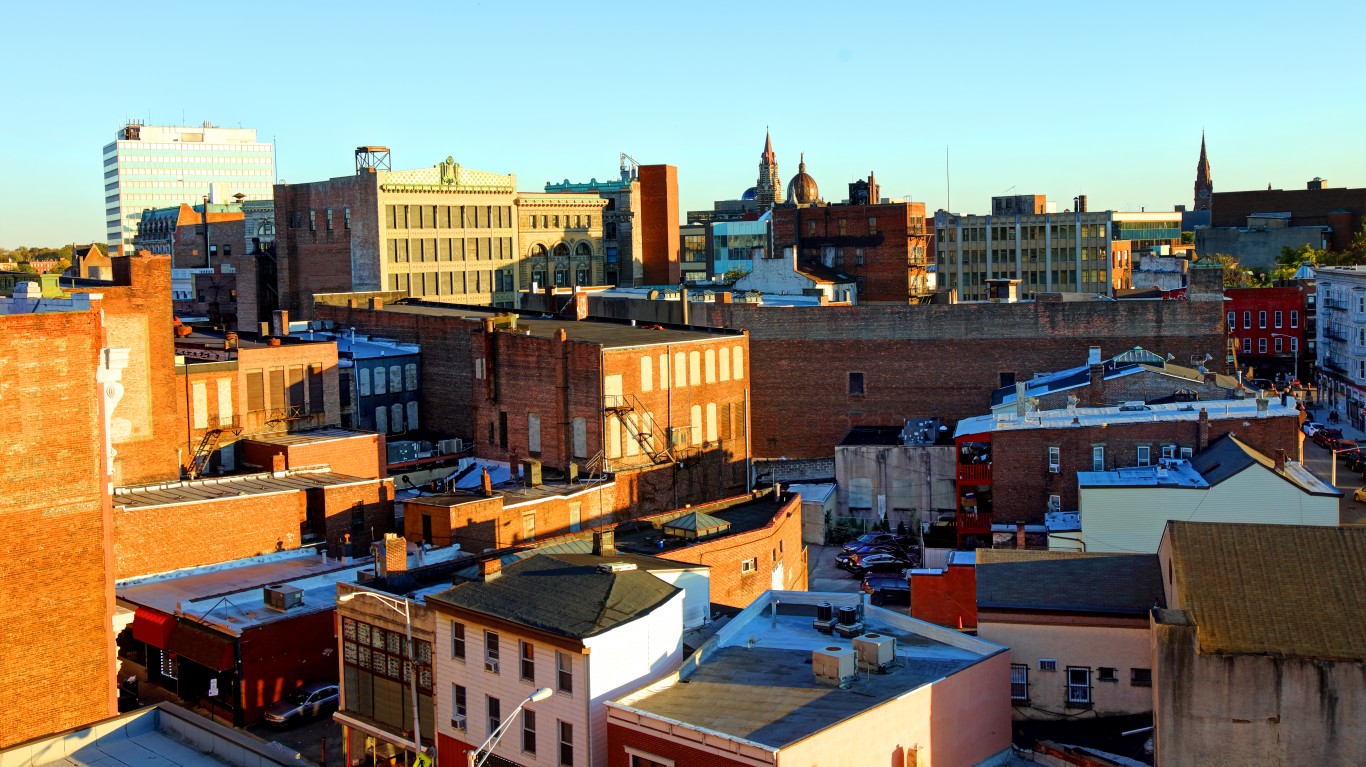
15. Paterson, New Jersey
> Rental occupied housing units: 74.0%
> Median rental cost: $1,213 — 835th highest of 1,769 cities (tied)
> Median home value: $257,700 — 858th highest of 1,769 cities
> Median household income: $45,141 — 229th lowest of 1,769 cities
[in-text-ad]
14. Elizabeth, New Jersey
> Rental occupied housing units: 74.1%
> Median rental cost: $1,201 — 856th highest of 1,769 cities (tied)
> Median home value: $291,300 — 714th highest of 1,769 cities
> Median household income: $50,647 — 420th lowest of 1,769 cities
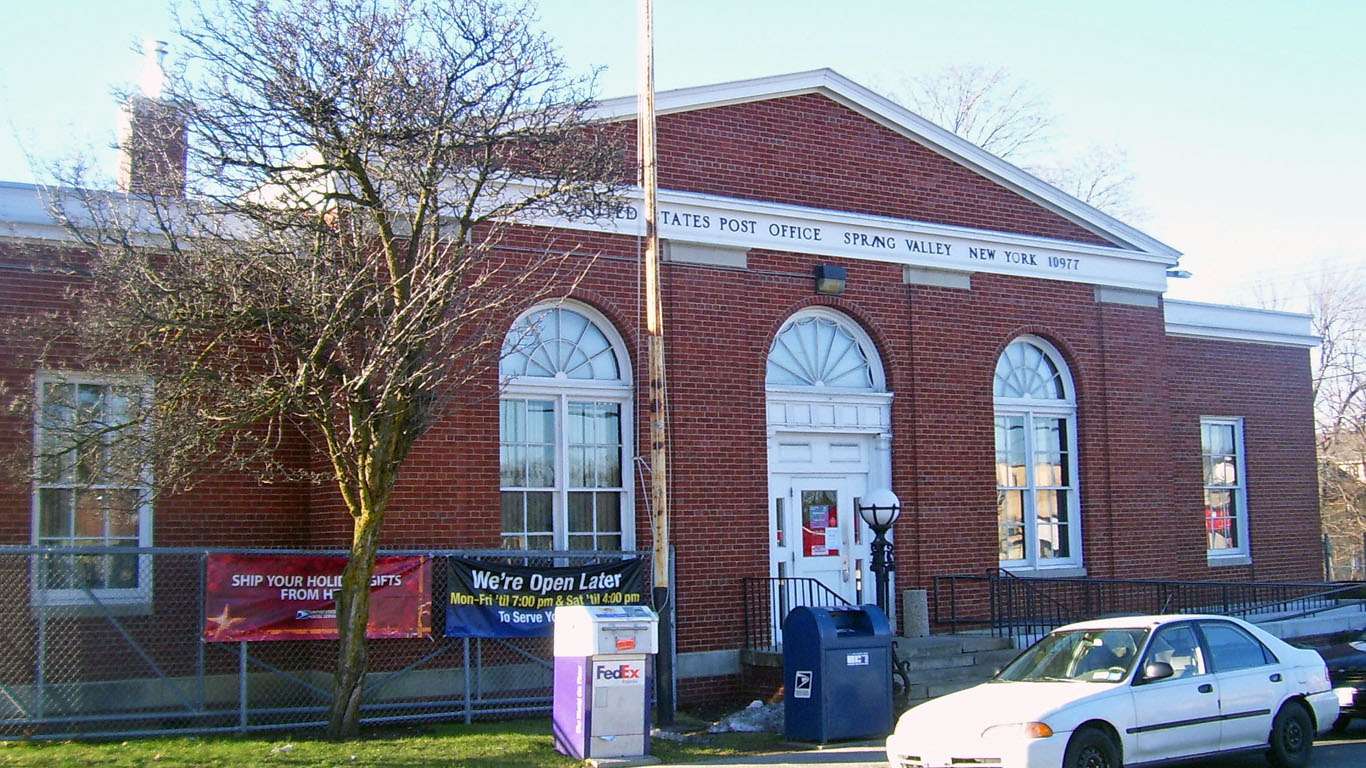
13. Spring Valley, New York
> Rental occupied housing units: 74.4%
> Median rental cost: $1,377 — 597th highest of 1,769 cities (tied)
> Median home value: $312,100 — 658th highest of 1,769 cities
> Median household income: $45,646 — 240th lowest of 1,769 cities

12. Ithaca, New York
> Rental occupied housing units: 74.9%
> Median rental cost: $1,171 — 861st lowest of 1,769 cities (tied)
> Median home value: $261,900 — 835th highest of 1,769 cities (tied)
> Median household income: $38,019 — 76th lowest of 1,769 cities
[in-text-ad-2]

11. Hartford, Connecticut
> Rental occupied housing units: 75.1%
> Median rental cost: $1,004 — 554th lowest of 1,769 cities (tied)
> Median home value: $170,200 — 460th lowest of 1,769 cities (tied)
> Median household income: $36,154 — 50th lowest of 1,769 cities

10. Statesboro, Georgia
> Rental occupied housing units: 75.4%
> Median rental cost: $776 — 140th lowest of 1,769 cities (tied)
> Median home value: $115,100 — 140th lowest of 1,769 cities
> Median household income: $32,790 — 21st lowest of 1,769 cities
[in-text-ad]

9. East Orange, New Jersey
> Rental occupied housing units: 76.0%
> Median rental cost: $1,156 — 828th lowest of 1,769 cities (tied)
> Median home value: $226,000 — 754th lowest of 1,769 cities
> Median household income: $50,990 — 431st lowest of 1,769 cities
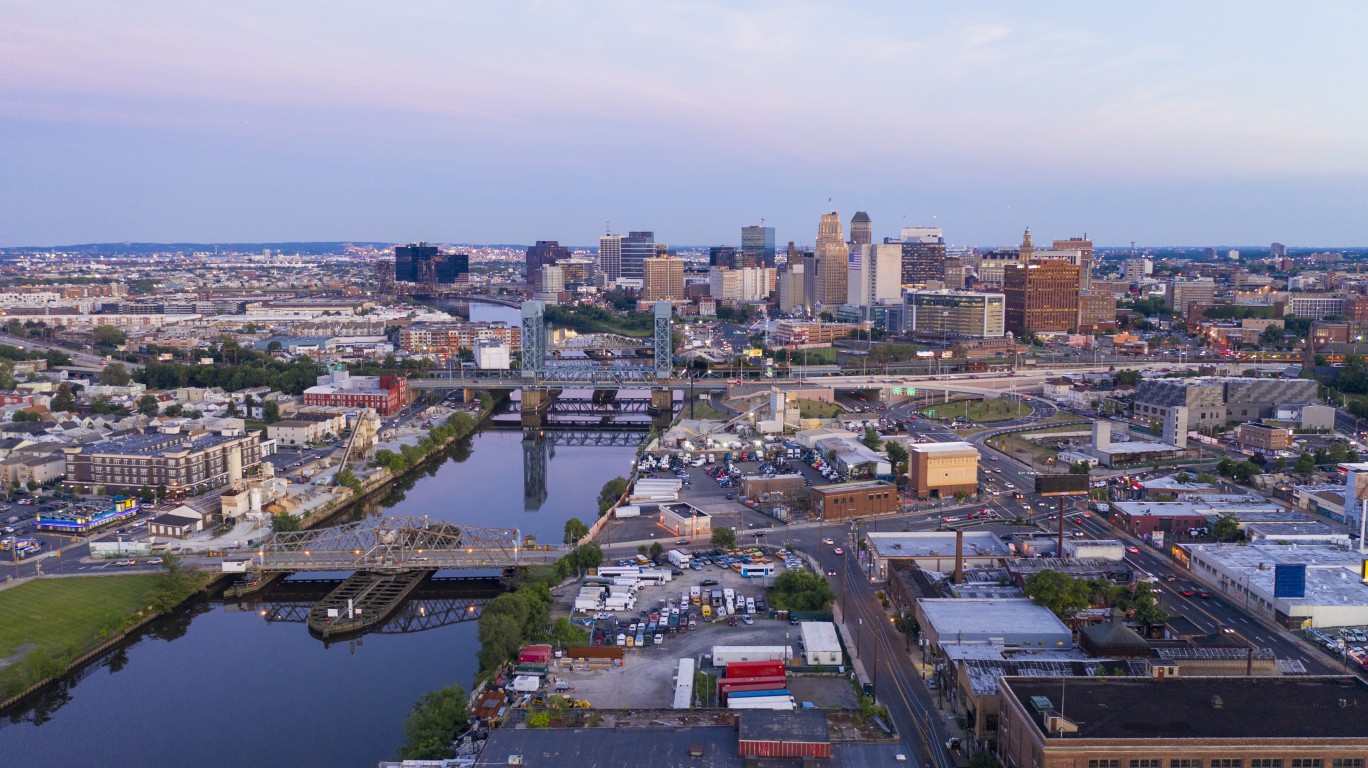
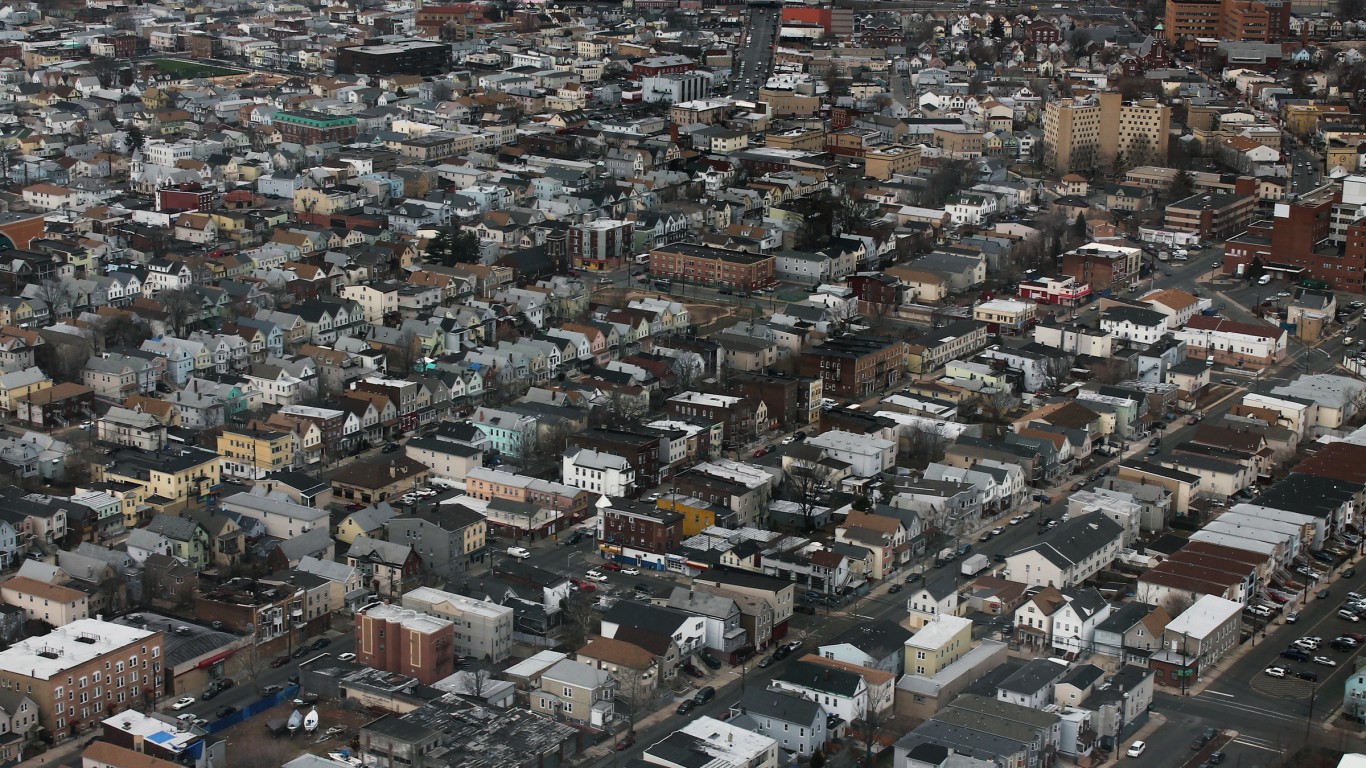
8. Newark, New Jersey
> Rental occupied housing units: 76.5%
> Median rental cost: $1,116 — 754th lowest of 1,769 cities (tied)
> Median home value: $254,900 — 870th highest of 1,769 cities
> Median household income: $37,476 — 68th lowest of 1,769 cities
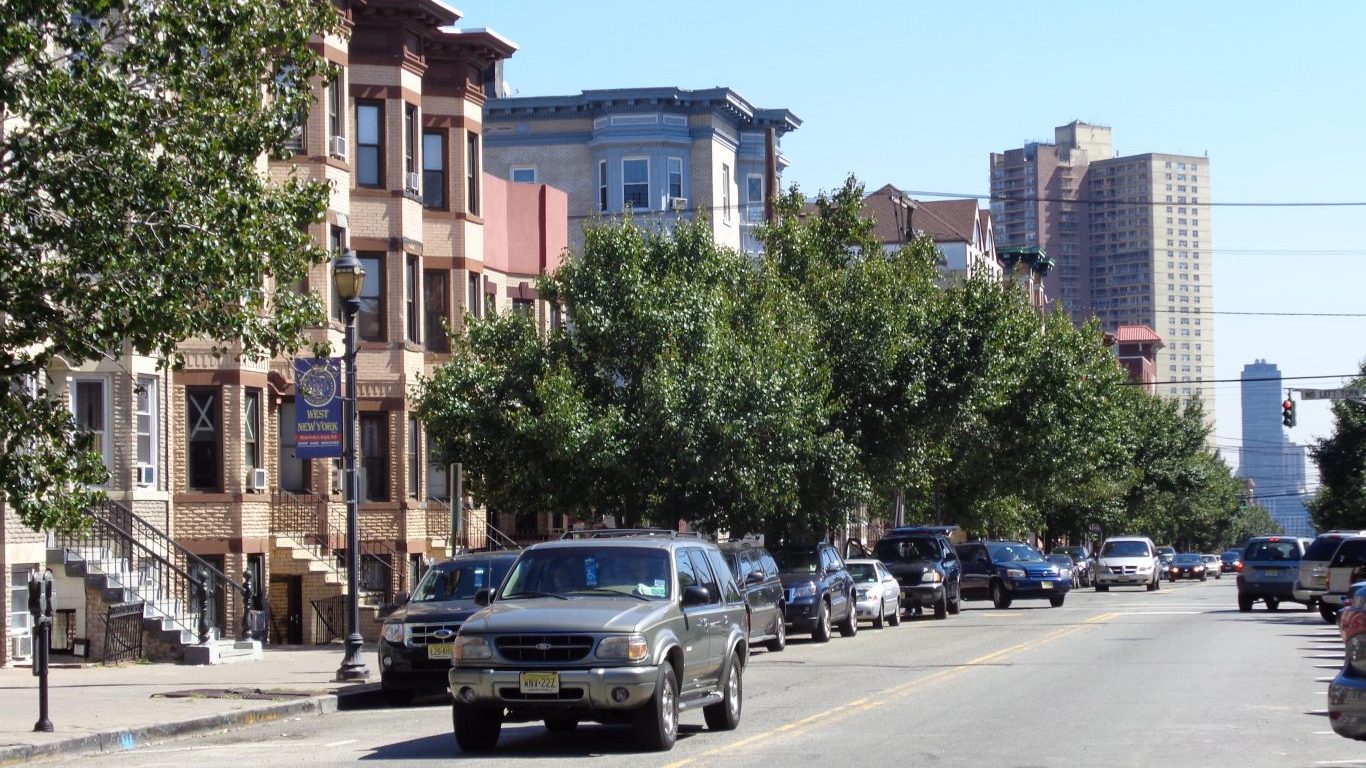
7. West New York, New Jersey
> Rental occupied housing units: 77.6%
> Median rental cost: $1,366 — 615th highest of 1,769 cities (tied)
> Median home value: $340,800 — 568th highest of 1,769 cities
> Median household income: $64,378 — 828th lowest of 1,769 cities
[in-text-ad-2]
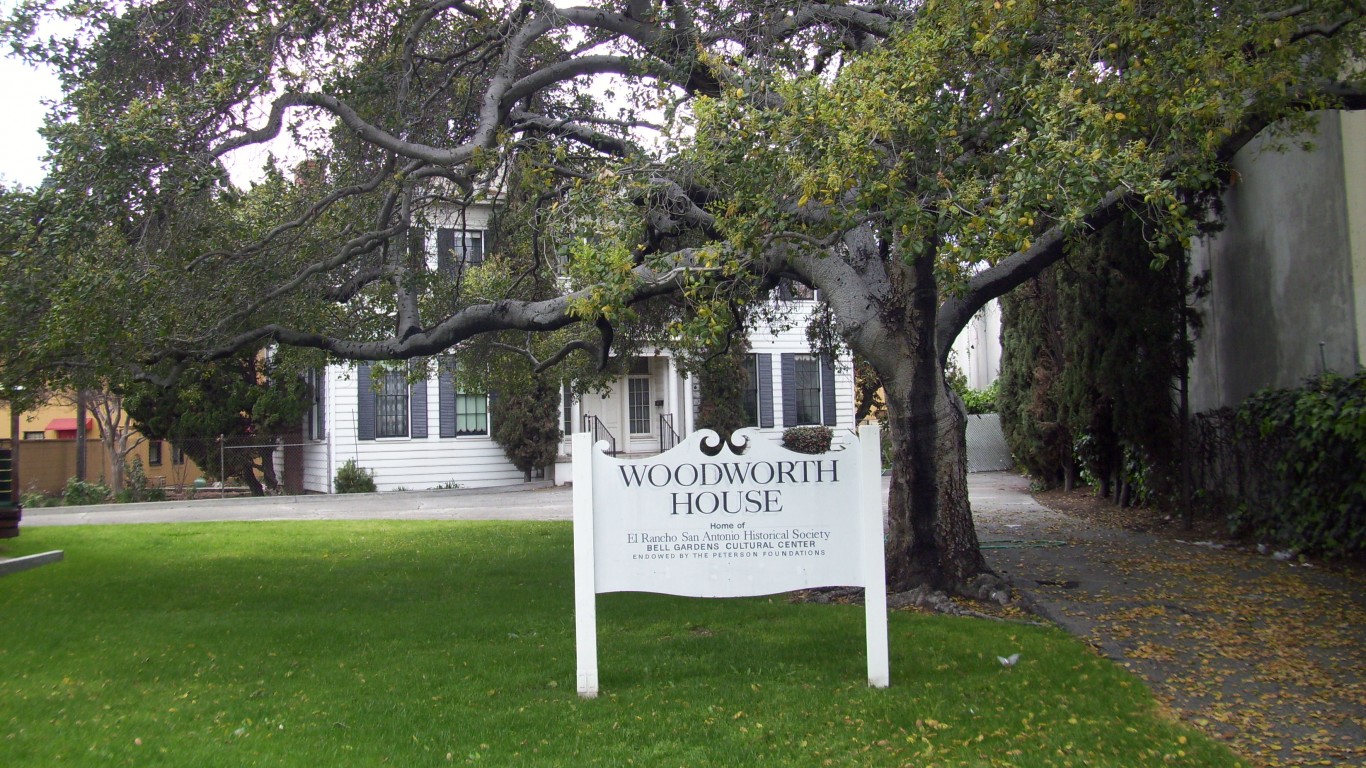
6. Bell Gardens, California
> Rental occupied housing units: 78.4%
> Median rental cost: $1,296 — 712th highest of 1,769 cities
> Median home value: $402,600 — 409th highest of 1,769 cities
> Median household income: $45,289 — 234th lowest of 1,769 cities
5. Passaic, New Jersey
> Rental occupied housing units: 78.5%
> Median rental cost: $1,189 — 878th highest of 1,769 cities (tied)
> Median home value: $348,000 — 546th highest of 1,769 cities (tied)
> Median household income: $44,779 — 219th lowest of 1,769 cities
[in-text-ad]

4. West Hollywood, California
> Rental occupied housing units: 80.2%
> Median rental cost: $1,744 — 244th highest of 1,769 cities
> Median home value: $743,700 — 101st highest of 1,769 cities
> Median household income: $71,692 — 758th highest of 1,769 cities
3. Union City, New Jersey
> Rental occupied housing units: 80.2%
> Median rental cost: $1,247 — 779th highest of 1,769 cities (tied)
> Median home value: $360,000 — 505th highest of 1,769 cities (tied)
> Median household income: $49,457 — 376th lowest of 1,769 cities

2. New Brunswick, New Jersey
> Rental occupied housing units: 80.5%
> Median rental cost: $1,524 — 409th highest of 1,769 cities (tied)
> Median home value: $267,200 — 805th highest of 1,769 cities (tied)
> Median household income: $43,930 — 201st lowest of 1,769 cities
[in-text-ad-2]
1. University (Hillsborough County), Florida
> Rental occupied housing units: 87.5%
> Median rental cost: $940 — 437th lowest of 1,769 cities (tied)
> Median home value: $91,900 — 63rd lowest of 1,769 cities (tied)
> Median household income: $29,380 — 6th lowest of 1,769 cities
Methodology
To determine the 50 cities with the highest share of renters, 24/7 Wall St. reviewed five-year estimates of the share of housing units that are occupied by renters from the U.S. Census Bureau’s 2020 American Community Survey.
We used census “place” geographies — a category that includes incorporated legal entities and census-designated statistical entities. We defined cities based on a population threshold — census places needed to have a population of at least 25,000 to be considered.
Cities were excluded if rental rates were not available in the 2020 ACS, if there were fewer than 1,000 housing units, or if the sampling error associated with a city’s data was deemed too high.
The sampling error was defined as too high if the coefficient of variation — a statistical assessment of how reliable an estimate is — for a city’s rental rate was above 15% and greater than two standard deviations above the mean CV for all cities’ rental rates. We similarly excluded cities that had a sampling error too high for their population, using the same definition.
Cities were ranked based on the percentage of housing units that are occupied by renters. To break ties, we used the number of housing units that are occupied by renters.
Additional information on median rental cost, median home value, and median household income are also five-year estimates from the 2020 ACS.
Credit Card Companies Are Doing Something Nuts
Credit card companies are at war. The biggest issuers are handing out free rewards and benefits to win the best customers.
It’s possible to find cards paying unlimited 1.5%, 2%, and even more today. That’s free money for qualified borrowers, and the type of thing that would be crazy to pass up. Those rewards can add up to thousands of dollars every year in free money, and include other benefits as well.
We’ve assembled some of the best credit cards for users today. Don’t miss these offers because they won’t be this good forever.
Flywheel Publishing has partnered with CardRatings for our coverage of credit card products. Flywheel Publishing and CardRatings may receive a commission from card issuers.
Thank you for reading! Have some feedback for us?
Contact the 24/7 Wall St. editorial team.

 24/7 Wall St.

 24/7 Wall St.


 24/7 Wall St.
 24/7 Wall St.