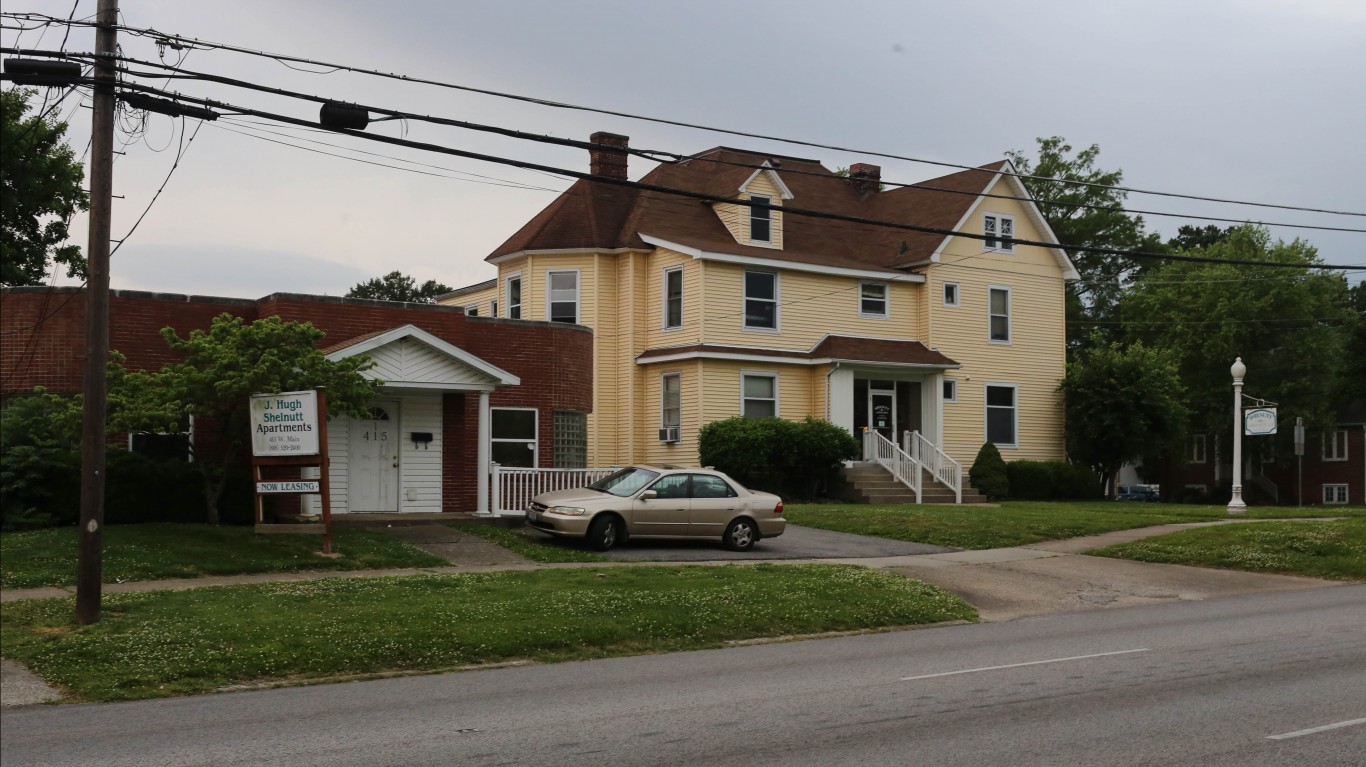
Rents in the United States hit a record high in April, according to real estate listing site Realtor.com, with rents rising 16.7% compared to the previous year alone. In contrast, over the previous five years, gross rents increased by 18.1%. Rising housing costs have put a serious squeeze on the millions of Americans, typically younger ones, who already can’not afford to own a home. Many of those who are already being affected by inflation are likely to look to live in cities with more affordable rentals.
To determine the metros with the lowest rent, 24/7 Wall St. reviewed five-year estimates of median gross rent from the U.S. Census Bureau’s 2020 American Community Survey. The median gross rent across the United States is $1,096, and in these 50 metropolitan areas, it ranges from $765 to as low as $635. Of the 50 metro areas on this list, West Virginia has the most, with six, followed by Alabama and Ohio, with five each. Just over half of these metropolitan areas are in the South.
In many of the places where rents are lower, a relatively small share of housing units are occupied by renters, rather than homeowners. This is largely because these places have cheaper housing markets as a whole. In more expensive housing markets, many residents are priced out of owning a property, whereas in these metro areas, people are more likely to be able to afford to buy a house. The U.S. median home value is $229,800. All 50 of the metropolitan areas on this list have a lower median home value. This includes Danville, Illinois, where the typical home is worth $80,900, the lowest median home value of any metro area in the country. This is the income you need to be in the top 1% in every state.
Broadly speaking, housing costs reflect the income levels of the population living there. Wealthier communities have more expensive housing, and places with high levels of poverty tend to have cheaper housing. The metro areas with the cheapest rent all have lower median incomes compared to the national figure. The typical monthly U.S. household income is $5,416. In the Gadsden, Alabama, metro area, which has the fifth-lowest median gross rent, at $676, the typical household has a monthly income of $3,745.
But even when accounting for these lower incomes, most of the metropolitan areas are more affordable than much of the country. Nationwide, the annual median gross rent is equivalent to 29.6% of the median household income. In 37 of the 50 metro areas on this list, median rent accounts for a smaller share of the typical household income. In Jefferson City, Missouri, that figure only comes to 23.5% of the typical household income. These are the states with the lowest and highest rent.
Click here to see the cities where Americans pay the lowest rent
Click here to read our detailed methodology
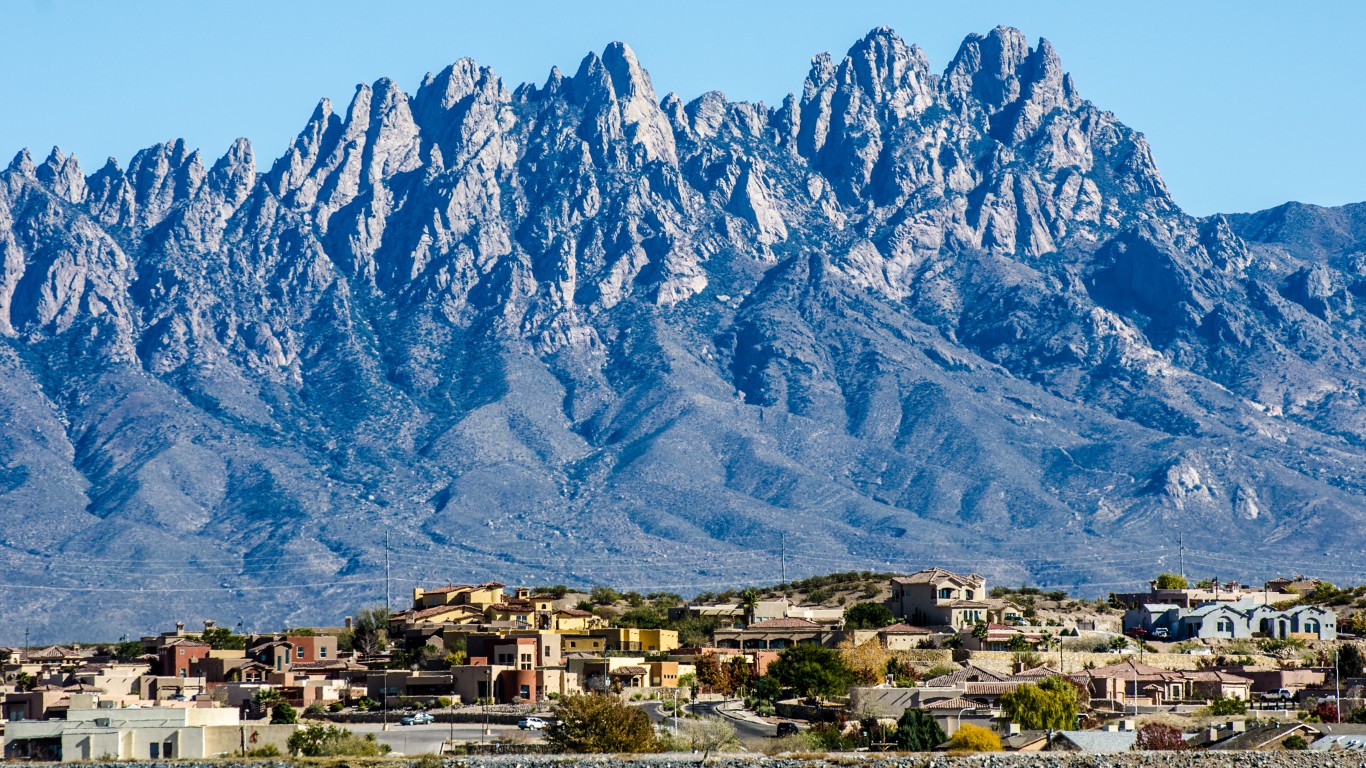
50. Las Cruces, NM
> Median monthly rental cost: $765
> Share of income typically spent on rent: 33.3% — 27th highest of 384 metros (tied)
> Rental occupied housing units: 35.4% — 132nd highest of 384 metros
> Median home value: $153,600 — 120th lowest of 384 metros (tied)
[in-text-ad]
49. Michigan City-La Porte, IN
> Median monthly rental cost: $763
> Share of income typically spent on rent: 28.4% — 139th lowest of 384 metros (tied)
> Rental occupied housing units: 26.7% — 39th lowest of 384 metros
> Median home value: $139,900 — 75th lowest of 384 metros

48. Lewiston, ID-WA
> Median monthly rental cost: $762
> Share of income typically spent on rent: 30.2% — 124th highest of 384 metros (tied)
> Rental occupied housing units: 27.3% — 42nd lowest of 384 metros
> Median home value: $207,200 — 147th highest of 384 metros

47. Jonesboro, AR
> Median monthly rental cost: $761
> Share of income typically spent on rent: 27.7% — 93rd lowest of 384 metros (tied)
> Rental occupied housing units: 41.9% — 35th highest of 384 metros
> Median home value: $136,000 — 59th lowest of 384 metros
[in-text-ad-2]
46. Utica-Rome, NY
> Median monthly rental cost: $760
> Share of income typically spent on rent: 26.9% — 40th lowest of 384 metros (tied)
> Rental occupied housing units: 30.1% — 97th lowest of 384 metros
> Median home value: $127,000 — 48th lowest of 384 metros

45. Erie, PA
> Median monthly rental cost: $758
> Share of income typically spent on rent: 29.4% — 165th highest of 384 metros (tied)
> Rental occupied housing units: 33.0% — 187th lowest of 384 metros
> Median home value: $138,500 — 70th lowest of 384 metros
[in-text-ad]
44. Niles, MI
> Median monthly rental cost: $757
> Share of income typically spent on rent: 29.6% — 154th highest of 384 metros (tied)
> Rental occupied housing units: 28.8% — 64th lowest of 384 metros
> Median home value: $157,500 — 135th lowest of 384 metros
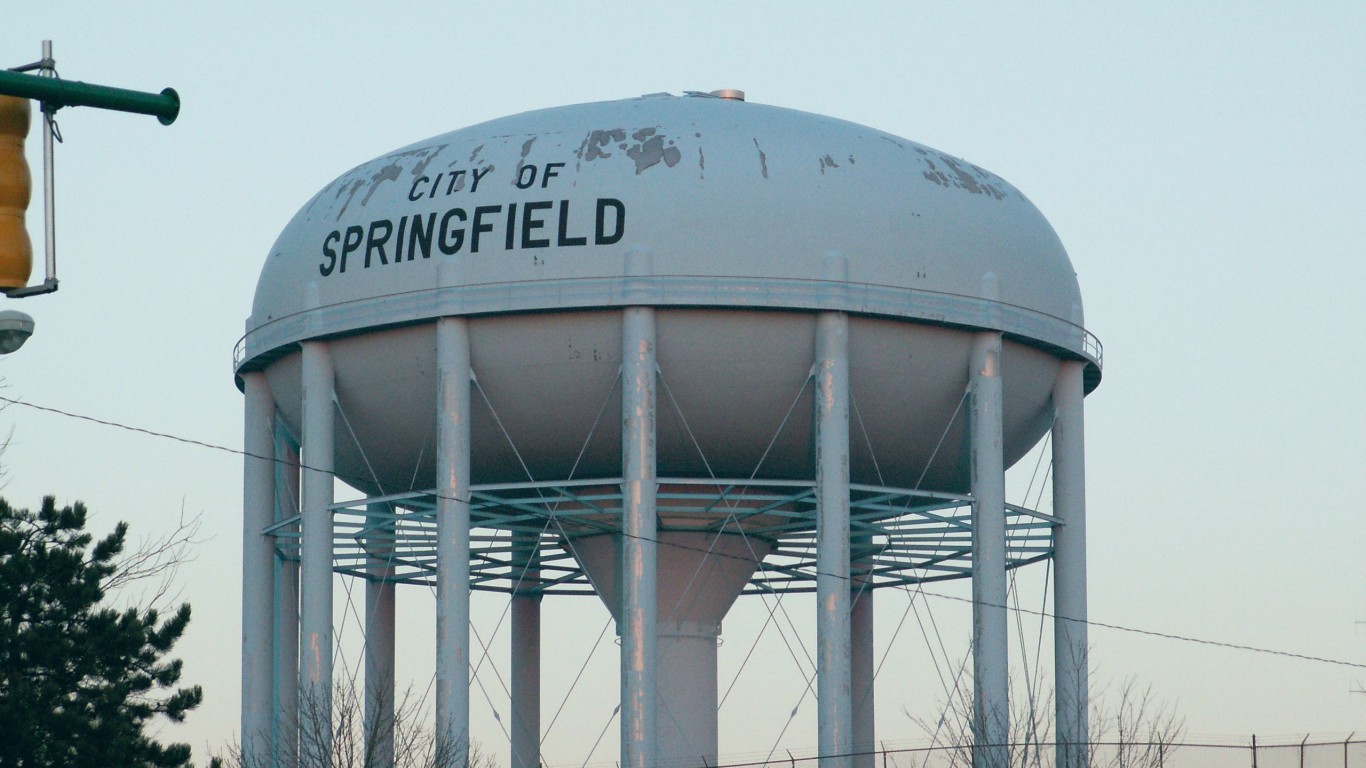
43. Springfield, OH
> Median monthly rental cost: $757
> Share of income typically spent on rent: 27.0% — 45th lowest of 384 metros (tied)
> Rental occupied housing units: 32.9% — 178th lowest of 384 metros
> Median home value: $120,500 — 31st lowest of 384 metros (tied)
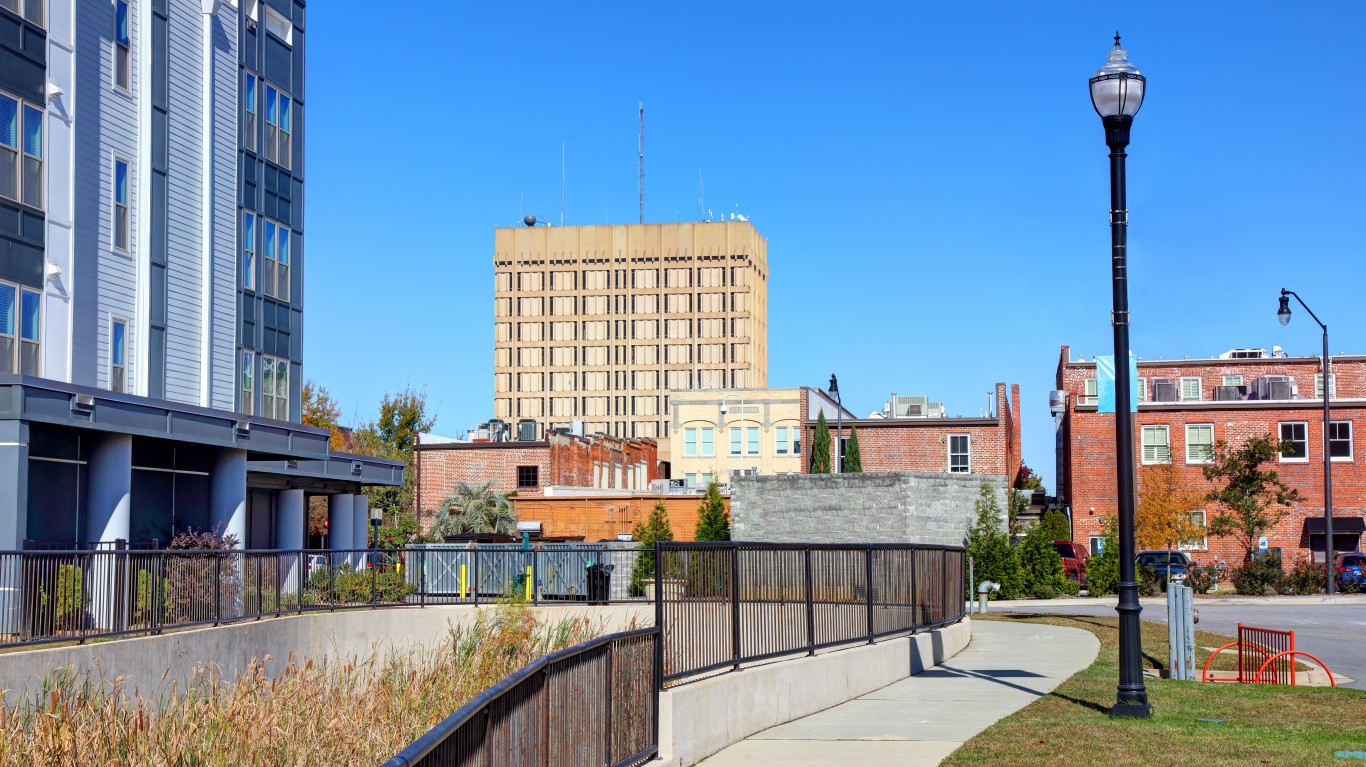
42. Florence, SC
> Median monthly rental cost: $754
> Share of income typically spent on rent: 28.4% — 139th lowest of 384 metros (tied)
> Rental occupied housing units: 33.0% — 185th lowest of 384 metros
> Median home value: $125,100 — 41st lowest of 384 metros
[in-text-ad-2]

41. McAllen-Edinburg-Mission, TX
> Median monthly rental cost: $753
> Share of income typically spent on rent: 31.1% — 87th highest of 384 metros (tied)
> Rental occupied housing units: 32.0% — 154th lowest of 384 metros
> Median home value: $90,000 — 4th lowest of 384 metros

40. Texarkana, TX-AR
> Median monthly rental cost: $753
> Share of income typically spent on rent: 28.0% — 110th lowest of 384 metros (tied)
> Rental occupied housing units: 34.2% — 166th highest of 384 metros
> Median home value: $114,100 — 18th lowest of 384 metros
[in-text-ad]
39. Rocky Mount, NC
> Median monthly rental cost: $753
> Share of income typically spent on rent: 27.9% — 108th lowest of 384 metros (tied)
> Rental occupied housing units: 36.4% — 111th highest of 384 metros
> Median home value: $115,400 — 21st lowest of 384 metros

38. Canton-Massillon, OH
> Median monthly rental cost: $750
> Share of income typically spent on rent: 27.0% — 45th lowest of 384 metros (tied)
> Rental occupied housing units: 31.2% — 131st lowest of 384 metros
> Median home value: $138,300 — 69th lowest of 384 metros
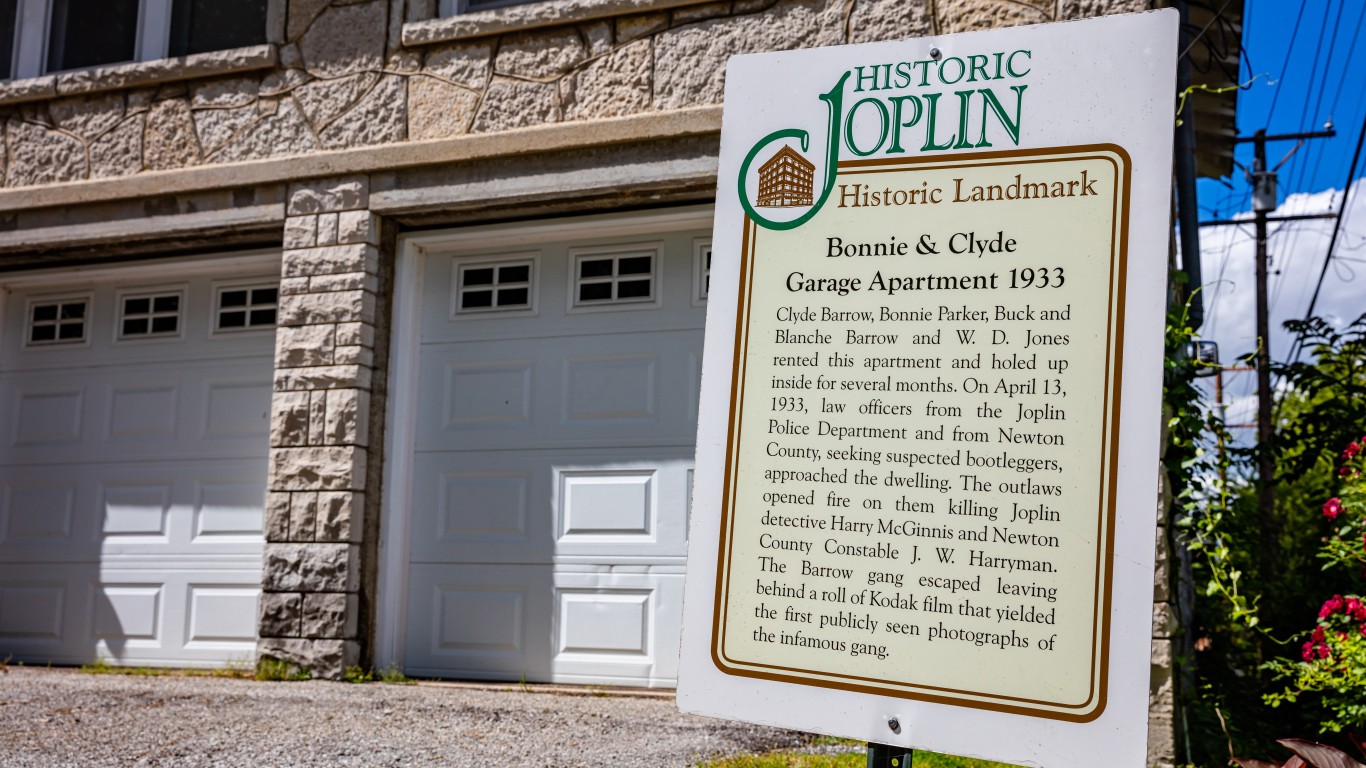
37. Joplin, MO
> Median monthly rental cost: $748
> Share of income typically spent on rent: 27.8% — 99th lowest of 384 metros (tied)
> Rental occupied housing units: 33.6% — 184th highest of 384 metros
> Median home value: $126,200 — 43rd lowest of 384 metros (tied)
[in-text-ad-2]
36. Brownsville-Harlingen, TX
> Median monthly rental cost: $746
> Share of income typically spent on rent: 30.8% — 102nd highest of 384 metros
> Rental occupied housing units: 33.8% — 179th highest of 384 metros
> Median home value: $89,700 — 3rd lowest of 384 metros

35. Dothan, AL
> Median monthly rental cost: $744
> Share of income typically spent on rent: 27.6% — 84th lowest of 384 metros (tied)
> Rental occupied housing units: 30.3% — 101st lowest of 384 metros
> Median home value: $131,600 — 51st lowest of 384 metros
[in-text-ad]
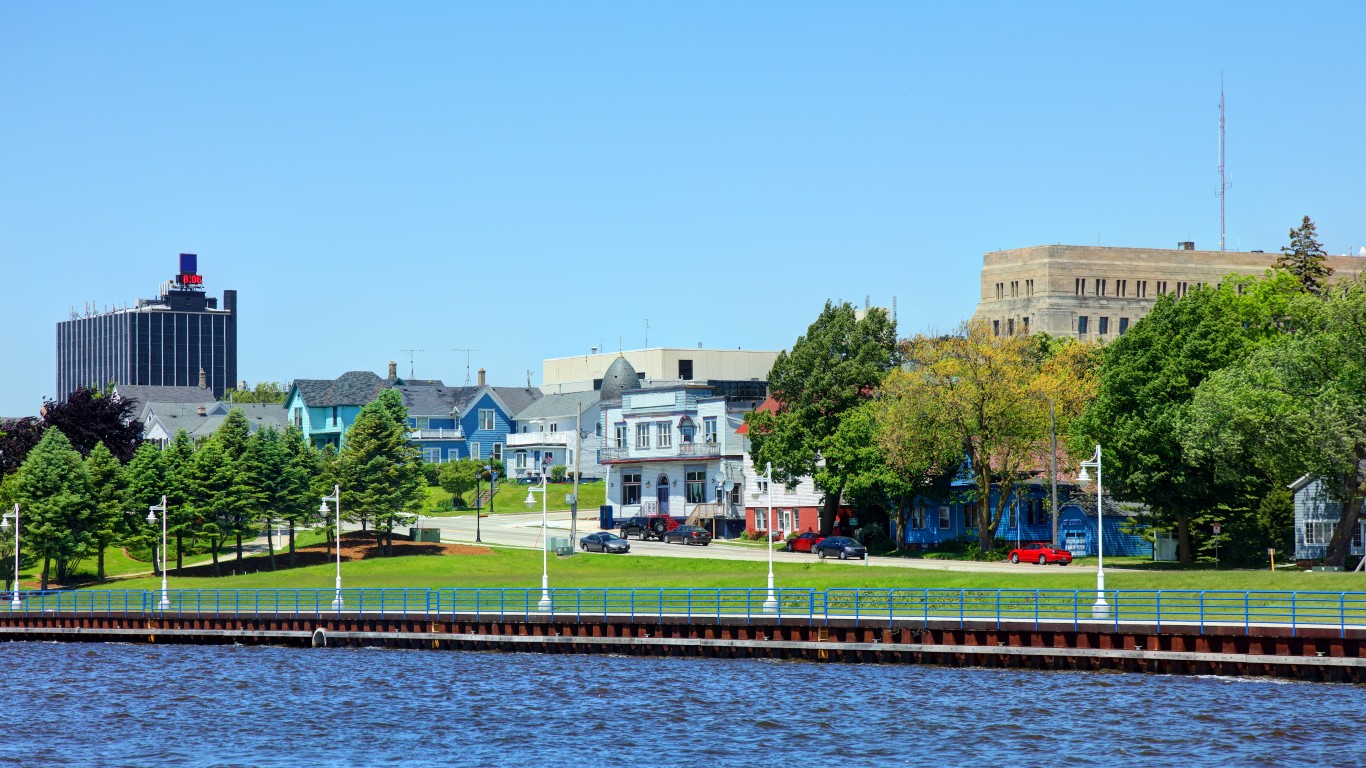
34. Sheboygan, WI
> Median monthly rental cost: $744
> Share of income typically spent on rent: 23.6% — 4th lowest of 384 metros
> Rental occupied housing units: 29.7% — 88th lowest of 384 metros
> Median home value: $165,400 — 161st lowest of 384 metros
33. Kokomo, IN
> Median monthly rental cost: $743
> Share of income typically spent on rent: 25.9% — 21st lowest of 384 metros (tied)
> Rental occupied housing units: 27.9% — 49th lowest of 384 metros
> Median home value: $113,900 — 17th lowest of 384 metros

32. Altoona, PA
> Median monthly rental cost: $741
> Share of income typically spent on rent: 29.6% — 154th highest of 384 metros (tied)
> Rental occupied housing units: 29.7% — 89th lowest of 384 metros
> Median home value: $128,200 — 49th lowest of 384 metros
[in-text-ad-2]
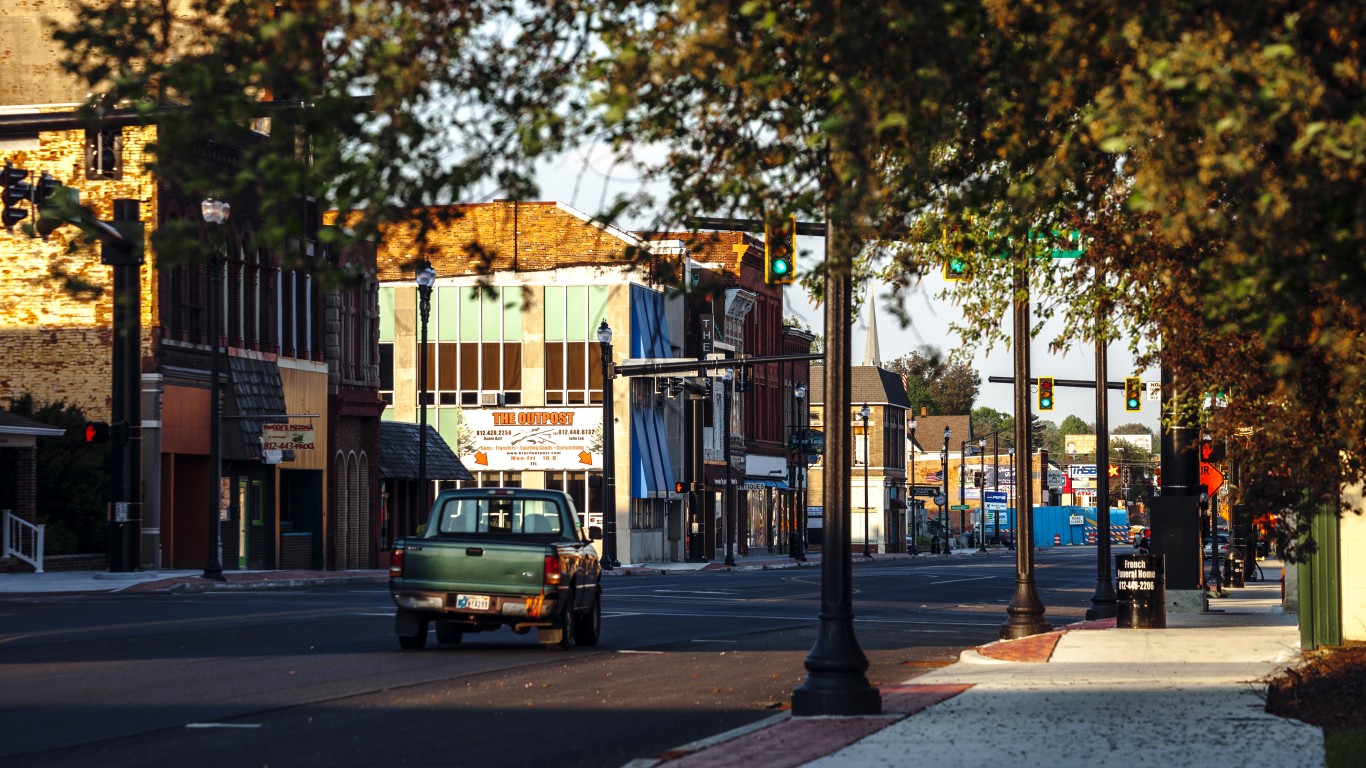
31. Terre Haute, IN
> Median monthly rental cost: $740
> Share of income typically spent on rent: 31.1% — 87th highest of 384 metros (tied)
> Rental occupied housing units: 30.8% — 118th lowest of 384 metros
> Median home value: $99,700 — 8th lowest of 384 metros

30. Monroe, LA
> Median monthly rental cost: $739
> Share of income typically spent on rent: 33.6% — 20th highest of 384 metros (tied)
> Rental occupied housing units: 36.8% — 103rd highest of 384 metros
> Median home value: $134,500 — 55th lowest of 384 metros
[in-text-ad]
29. Huntington-Ashland, WV-KY-OH
> Median monthly rental cost: $736
> Share of income typically spent on rent: 29.9% — 138th highest of 384 metros (tied)
> Rental occupied housing units: 28.3% — 55th lowest of 384 metros
> Median home value: $123,900 — 38th lowest of 384 metros
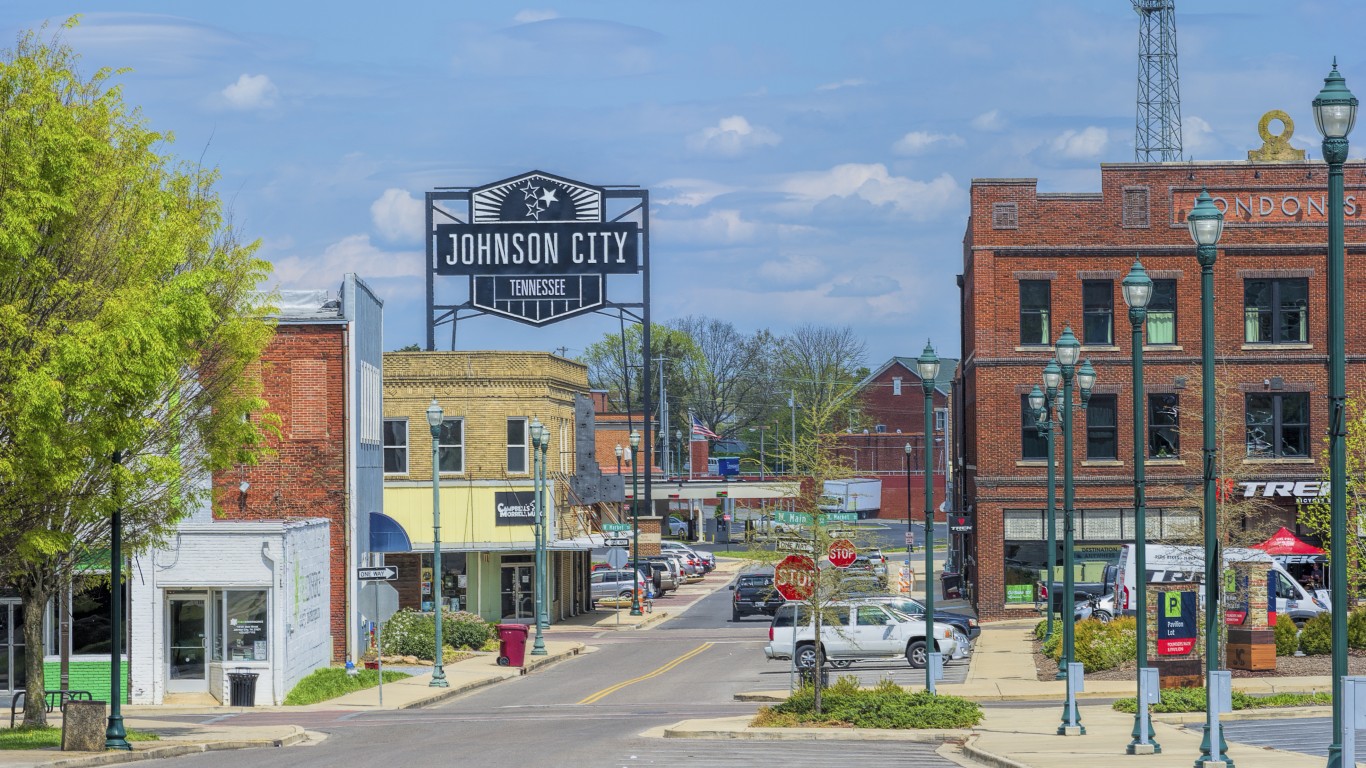
28. Johnson City, TN
> Median monthly rental cost: $734
> Share of income typically spent on rent: 28.3% — 130th lowest of 384 metros (tied)
> Rental occupied housing units: 33.0% — 183rd lowest of 384 metros
> Median home value: $152,600 — 115th lowest of 384 metros

27. Charleston, WV
> Median monthly rental cost: $728
> Share of income typically spent on rent: 29.5% — 159th highest of 384 metros (tied)
> Rental occupied housing units: 27.5% — 46th lowest of 384 metros
> Median home value: $110,100 — 15th lowest of 384 metros
[in-text-ad-2]

26. Pine Bluff, AR
> Median monthly rental cost: $726
> Share of income typically spent on rent: 28.5% — 143rd lowest of 384 metros (tied)
> Rental occupied housing units: 34.8% — 148th highest of 384 metros
> Median home value: $85,700 — 2nd lowest of 384 metros

25. Muncie, IN
> Median monthly rental cost: $725
> Share of income typically spent on rent: 32.3% — 47th highest of 384 metros (tied)
> Rental occupied housing units: 35.5% — 130th highest of 384 metros
> Median home value: $96,600 — 7th lowest of 384 metros
[in-text-ad]

24. Lima, OH
> Median monthly rental cost: $722
> Share of income typically spent on rent: 28.2% — 123rd lowest of 384 metros (tied)
> Rental occupied housing units: 33.3% — 191st highest of 384 metros
> Median home value: $120,300 — 30th lowest of 384 metros

23. Dalton, GA
> Median monthly rental cost: $721
> Share of income typically spent on rent: 24.7% — 8th lowest of 384 metros (tied)
> Rental occupied housing units: 32.8% — 176th lowest of 384 metros
> Median home value: $136,800 — 60th lowest of 384 metros

22. Anniston-Oxford, AL
> Median monthly rental cost: $720
> Share of income typically spent on rent: 26.0% — 23rd lowest of 384 metros (tied)
> Rental occupied housing units: 29.6% — 84th lowest of 384 metros
> Median home value: $121,600 — 35th lowest of 384 metros
[in-text-ad-2]

21. Morristown, TN
> Median monthly rental cost: $715
> Share of income typically spent on rent: 27.4% — 70th lowest of 384 metros (tied)
> Rental occupied housing units: 28.2% — 54th lowest of 384 metros
> Median home value: $142,800 — 84th lowest of 384 metros
20. Parkersburg-Vienna, WV
> Median monthly rental cost: $710
> Share of income typically spent on rent: 30.1% — 127th highest of 384 metros (tied)
> Rental occupied housing units: 27.2% — 41st lowest of 384 metros
> Median home value: $123,800 — 37th lowest of 384 metros
[in-text-ad]

19. Cumberland, MD-WV
> Median monthly rental cost: $708
> Share of income typically spent on rent: 29.0% — 185th lowest of 384 metros (tied)
> Rental occupied housing units: 28.3% — 56th lowest of 384 metros
> Median home value: $131,300 — 50th lowest of 384 metros

18. Hickory-Lenoir-Morganton, NC
> Median monthly rental cost: $708
> Share of income typically spent on rent: 24.7% — 8th lowest of 384 metros (tied)
> Rental occupied housing units: 26.6% — 35th lowest of 384 metros
> Median home value: $139,100 — 72nd lowest of 384 metros

17. Pocatello, ID
> Median monthly rental cost: $702
> Share of income typically spent on rent: 26.8% — 36th lowest of 384 metros (tied)
> Rental occupied housing units: 31.7% — 144th lowest of 384 metros
> Median home value: $165,800 — 162nd lowest of 384 metros (tied)
[in-text-ad-2]

16. Fort Smith, AR-OK
> Median monthly rental cost: $701
> Share of income typically spent on rent: 27.1% — 52nd lowest of 384 metros (tied)
> Rental occupied housing units: 33.8% — 180th highest of 384 metros
> Median home value: $119,500 — 26th lowest of 384 metros (tied)
15. Carbondale-Marion, IL
> Median monthly rental cost: $696
> Share of income typically spent on rent: 31.1% — 87th highest of 384 metros (tied)
> Rental occupied housing units: 37.2% — 97th highest of 384 metros
> Median home value: $118,300 — 24th lowest of 384 metros
[in-text-ad]

14. Beckley, WV
> Median monthly rental cost: $691
> Share of income typically spent on rent: 30.1% — 127th highest of 384 metros (tied)
> Rental occupied housing units: 24.3% — 18th lowest of 384 metros
> Median home value: $104,100 — 10th lowest of 384 metros
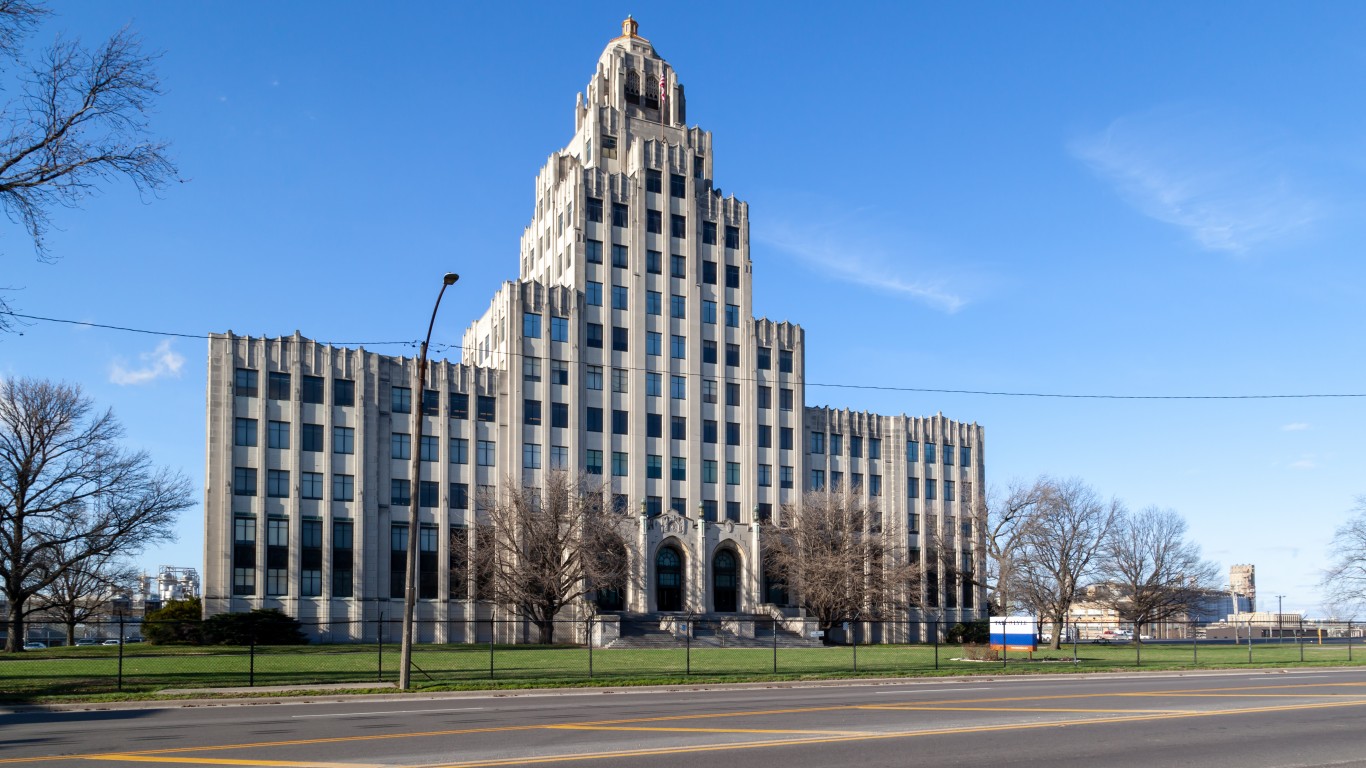
13. Decatur, IL
> Median monthly rental cost: $690
> Share of income typically spent on rent: 28.2% — 123rd lowest of 384 metros (tied)
> Rental occupied housing units: 30.9% — 123rd lowest of 384 metros
> Median home value: $103,100 — 9th lowest of 384 metros

12. Jefferson City, MO
> Median monthly rental cost: $686
> Share of income typically spent on rent: 23.5% — 2nd lowest of 384 metros (tied)
> Rental occupied housing units: 28.3% — 57th lowest of 384 metros
> Median home value: $162,100 — 150th lowest of 384 metros
[in-text-ad-2]

11. Youngstown-Warren-Boardman, OH-PA
> Median monthly rental cost: $683
> Share of income typically spent on rent: 29.0% — 185th lowest of 384 metros (tied)
> Rental occupied housing units: 29.7% — 85th lowest of 384 metros
> Median home value: $110,300 — 16th lowest of 384 metros
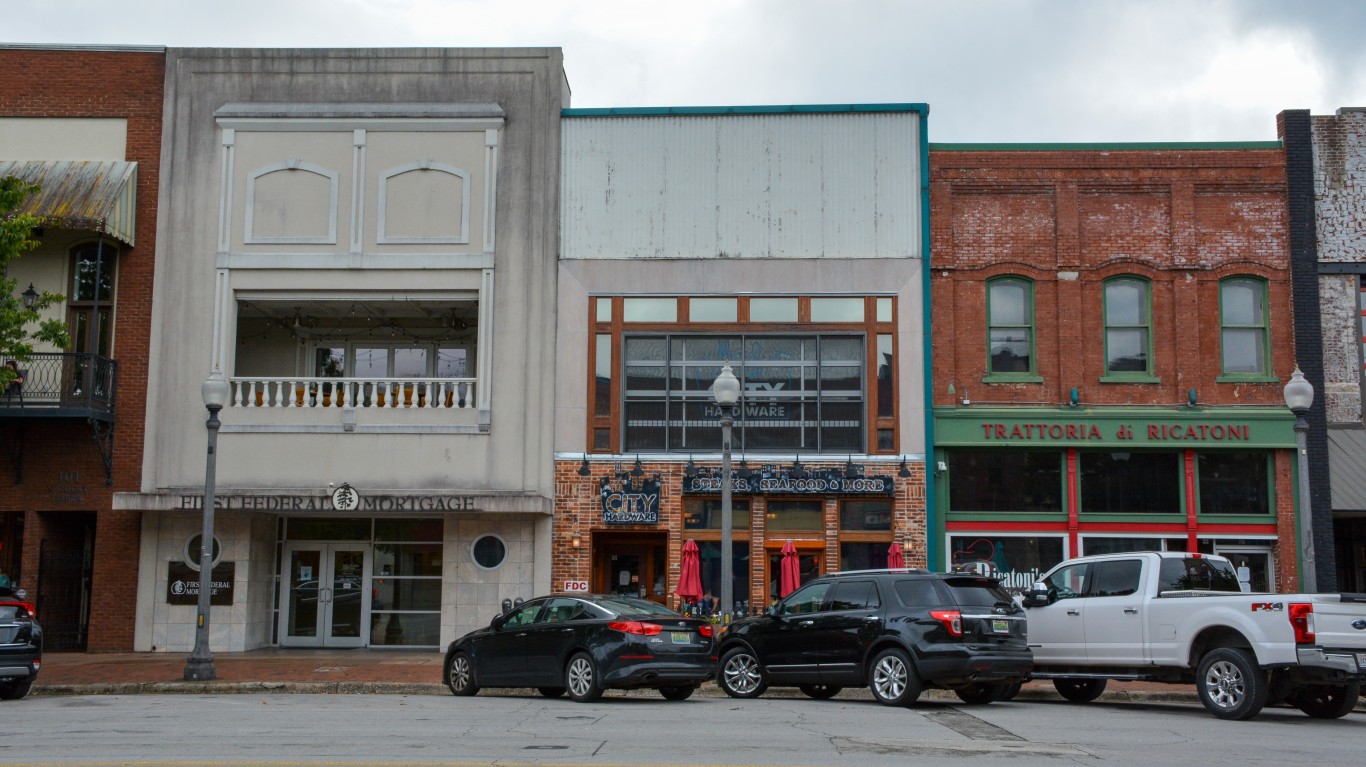
10. Florence-Muscle Shoals, AL
> Median monthly rental cost: $683
> Share of income typically spent on rent: 27.4% — 70th lowest of 384 metros (tied)
> Rental occupied housing units: 30.7% — 112th lowest of 384 metros
> Median home value: $140,000 — 76th lowest of 384 metros
[in-text-ad]

9. Danville, IL
> Median monthly rental cost: $683
> Share of income typically spent on rent: 27.0% — 45th lowest of 384 metros (tied)
> Rental occupied housing units: 29.2% — 73rd lowest of 384 metros
> Median home value: $80,900 — the lowest of 384 metros

8. Bay City, MI
> Median monthly rental cost: $679
> Share of income typically spent on rent: 27.8% — 99th lowest of 384 metros (tied)
> Rental occupied housing units: 23.9% — 16th lowest of 384 metros
> Median home value: $106,400 — 12th lowest of 384 metros
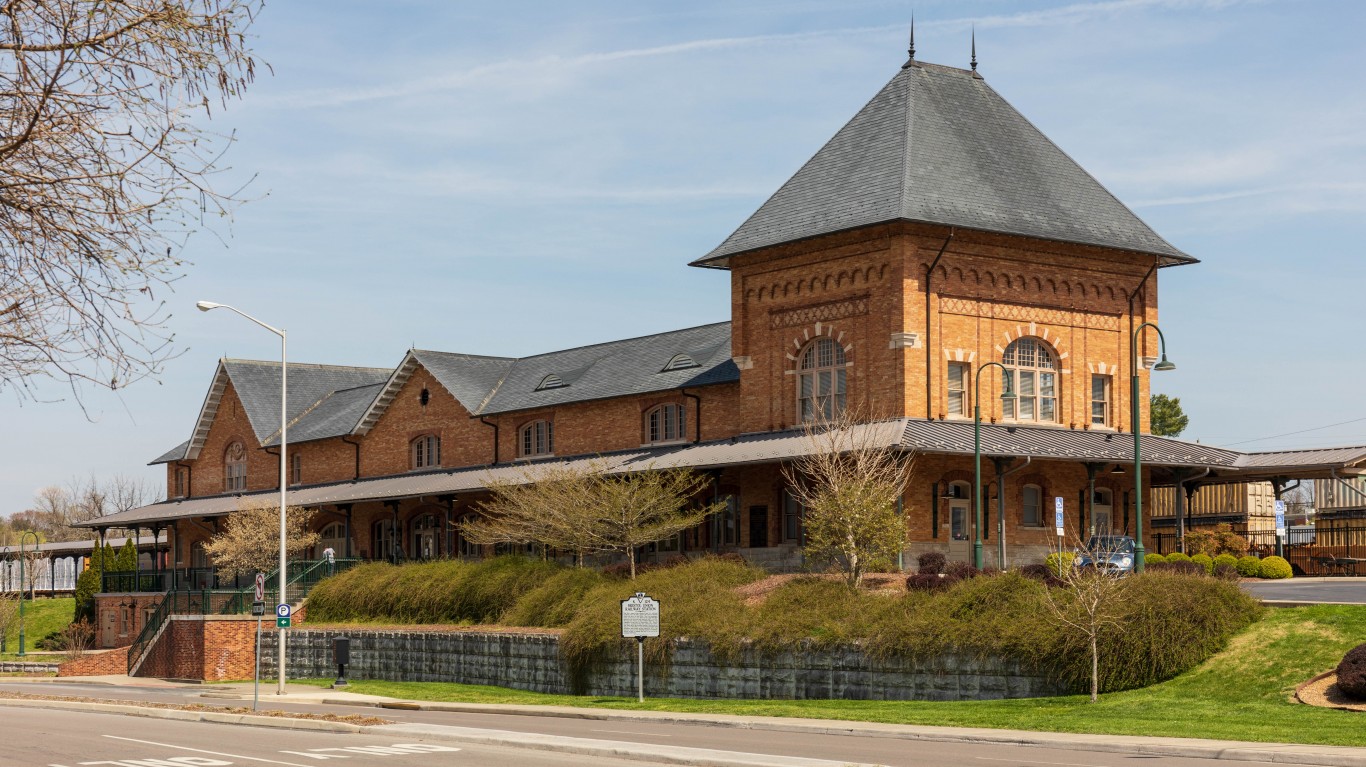
7. Kingsport-Bristol, TN-VA
> Median monthly rental cost: $678
> Share of income typically spent on rent: 26.6% — 31st lowest of 384 metros (tied)
> Rental occupied housing units: 26.5% — 34th lowest of 384 metros
> Median home value: $140,800 — 78th lowest of 384 metros
[in-text-ad-2]
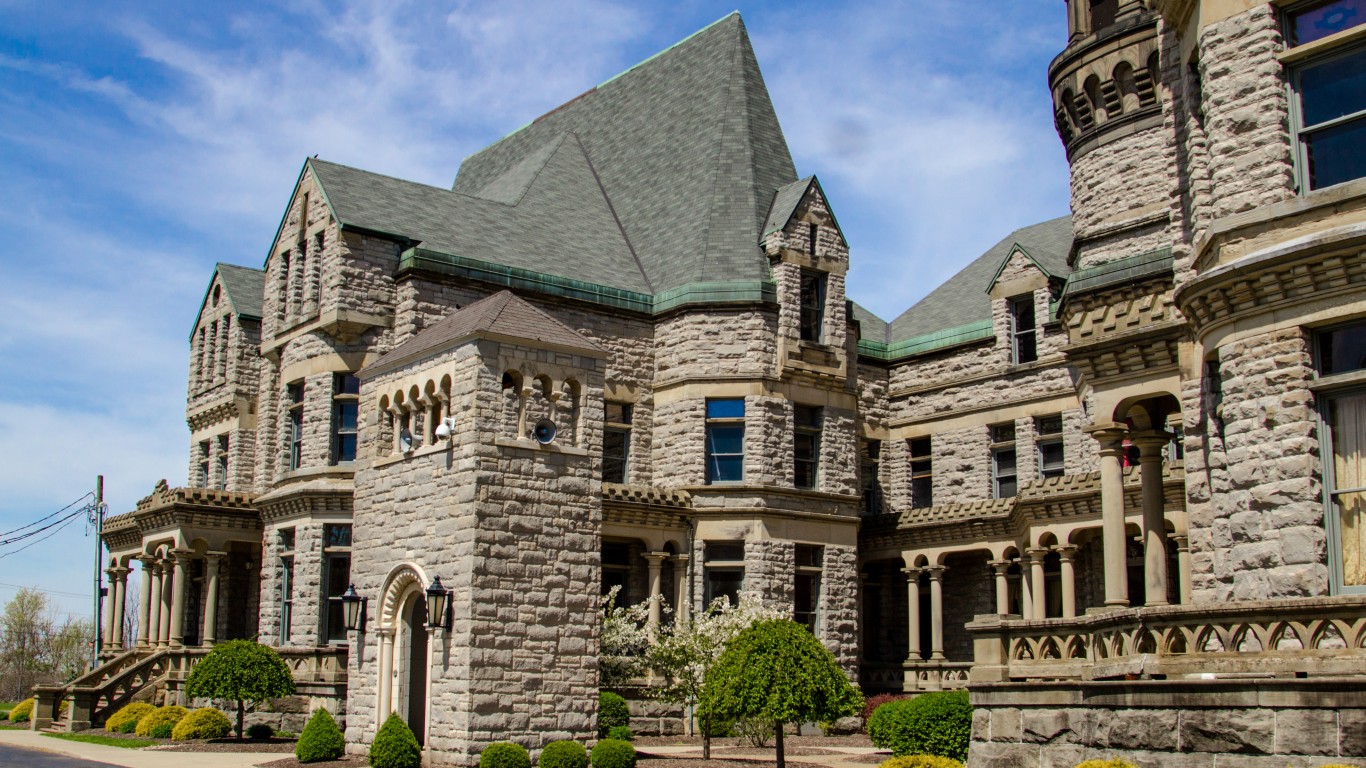
6. Mansfield, OH
> Median monthly rental cost: $677
> Share of income typically spent on rent: 27.6% — 84th lowest of 384 metros (tied)
> Rental occupied housing units: 33.1% — 190th lowest of 384 metros
> Median home value: $115,100 — 19th lowest of 384 metros
5. Gadsden, AL
> Median monthly rental cost: $676
> Share of income typically spent on rent: 28.2% — 123rd lowest of 384 metros (tied)
> Rental occupied housing units: 27.0% — 40th lowest of 384 metros
> Median home value: $124,400 — 39th lowest of 384 metros
[in-text-ad]

4. Decatur, AL
> Median monthly rental cost: $666
> Share of income typically spent on rent: 27.2% — 59th lowest of 384 metros (tied)
> Rental occupied housing units: 26.5% — 33rd lowest of 384 metros
> Median home value: $137,600 — 64th lowest of 384 metros (tied)

3. Wheeling, WV-OH
> Median monthly rental cost: $657
> Share of income typically spent on rent: 28.7% — 155th lowest of 384 metros (tied)
> Rental occupied housing units: 25.5% — 28th lowest of 384 metros
> Median home value: $115,200 — 20th lowest of 384 metros
2. Weirton-Steubenville, WV-OH
> Median monthly rental cost: $650
> Share of income typically spent on rent: 25.4% — 17th lowest of 384 metros
> Rental occupied housing units: 29.0% — 69th lowest of 384 metros
> Median home value: $95,400 — 6th lowest of 384 metros
[in-text-ad-2]

1. Johnstown, PA
> Median monthly rental cost: $635
> Share of income typically spent on rent: 27.5% — 78th lowest of 384 metros (tied)
> Rental occupied housing units: 25.3% — 25th lowest of 384 metros
> Median home value: $94,900 — 5th lowest of 384 metros
Methodology
To determine the metros with the lowest rent, 24/7 Wall St. reviewed five-year estimates of median gross rent from the U.S. Census Bureau’s 2020 American Community Survey.
We used the 384 metropolitan statistical areas as delineated by the United States Office of Management and Budget and used by the Census Bureau as our definition of metros.
Metros were ranked based on the median gross rent. To break ties, we used the median gross rent as a share of household income.
Additional information on median gross rent as a share of household income, share of households occupied by renters, and median home value are also five-year estimates from the 2020 ACS. Because the Census Bureau didn’t release one-year estimates for 2020 due to data collection issues caused by the COVID-19 pandemic, all ACS data are five-year estimates.
Are You Ahead, or Behind on Retirement? (sponsor)
If you’re one of the over 4 Million Americans set to retire this year, you may want to pay attention.
Finding a financial advisor who puts your interest first can be the difference between a rich retirement and barely getting by, and today it’s easier than ever. SmartAsset’s free tool matches you with up to three fiduciary financial advisors that serve your area in minutes. Each advisor has been carefully vetted, and must act in your best interests. Start your search now.
Don’t waste another minute; get started right here and help your retirement dreams become a retirement reality.
Thank you for reading! Have some feedback for us?
Contact the 24/7 Wall St. editorial team.

 24/7 Wall St.
 24/7 Wall St.
 24/7 Wall St.

 24/7 Wall St.
