Climate change is one of the most pressing issues facing humanity. The global community at large has committed to reducing greenhouse gas emissions with the goal of hitting net-zero emissions worldwide by 2050.
Though virtually every nation recognizes the importance of combating climate change, some are doing a much better job of actually implementing solutions and fulfilling their commitments. Other countries have actually taken steps backwards over the past decade, doing less to contribute to a healthier environment in 2022 than they were doing in 2012.
To identify the countries falling behind on their environmental commitments, 24/7 Wall St. reviewed the Environmental Performance Index, a report from the Yale Center for Environmental Law & Policy that uses 40 performance indicators to score nations’ “progress toward improving environmental health, protecting ecosystem vitality, and mitigating climate change.” Countries were ranked based on the change in their EPI score from 2012-2022. Population and GDP per capita data comes from The World Bank and is for the most recent year available.
Nearly all of the countries on this list rank in the bottom half of the 180 nations reviewed in the 2022 EPI. Many of these nations may score poorly on this list in part because they lack the necessary financial resources to spend on climate improvements. All but two of the nations on this list have a GDP per capita of less than $7,500. For context, the U.S. GDP per capita is $63,207. These are the poorest countries in the world.
Countries trying to jumpstart their economies may have to rely on coal, oil, and natural gas combustion to fuel certain industries, whereas wealthier nations have the funding needed to commit to test and implement environmental policies, as well as to preserve natural resources.
Though the U.S. has improved its EPI score since 2012, it still lags behind its peer nations. It ranks 43rd overall, with a score of 51.1 – the 20th best score out of 22 wealthy western democracies. The study largely attributes this lag to the Trump administration’s decision to pull out of the Paris Climate Agreement as well as weakened methane emissions rules. These are 23 places where industrial air pollution is so bad it causes cancer.
Click here to see countries falling behind on their environmental commitments

50. India
> 10-year chg. in EPI score: -0.6
> 2022 score: 18.9 – #180 out of 180
> 2012 score: 19.5 – #177 out of 178
> GDP per capita: $1,928 – #164 out of 213
> Population: 1.4 billion – #2 out of 217
[in-text-ad]
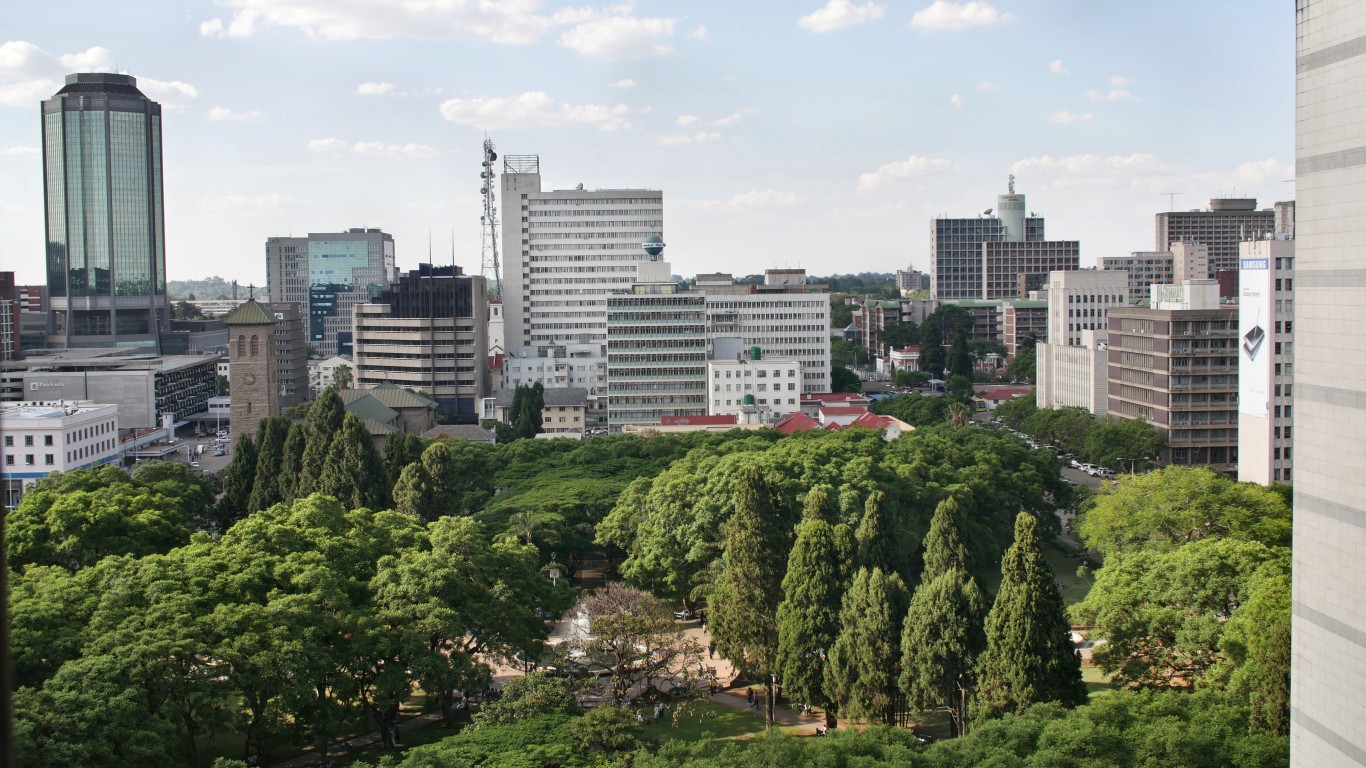
48. Zimbabwe
> 10-year chg. in EPI score: -0.7
> 2022 score: 46.2 – #69 out of 180
> 2012 score: 46.9 – #44 out of 178
> GDP per capita: $1,215 – #181 out of 213
> Population: 14.9 million – #73 out of 217

48. Central African Republic
> 10-year chg. in EPI score: -0.7
> 2022 score: 44.9 – #75 out of 180
> 2012 score: 45.6 – #54 out of 178
> GDP per capita: $493 – #208 out of 213
> Population: 4.8 million – #124 out of 217

46. Nicaragua
> 10-year chg. in EPI score: -0.9
> 2022 score: 37.7 – #110 out of 180
> 2012 score: 38.6 – #86 out of 178
> GDP per capita: $1,905 – #165 out of 213
> Population: 6.6 million – #109 out of 217
[in-text-ad-2]
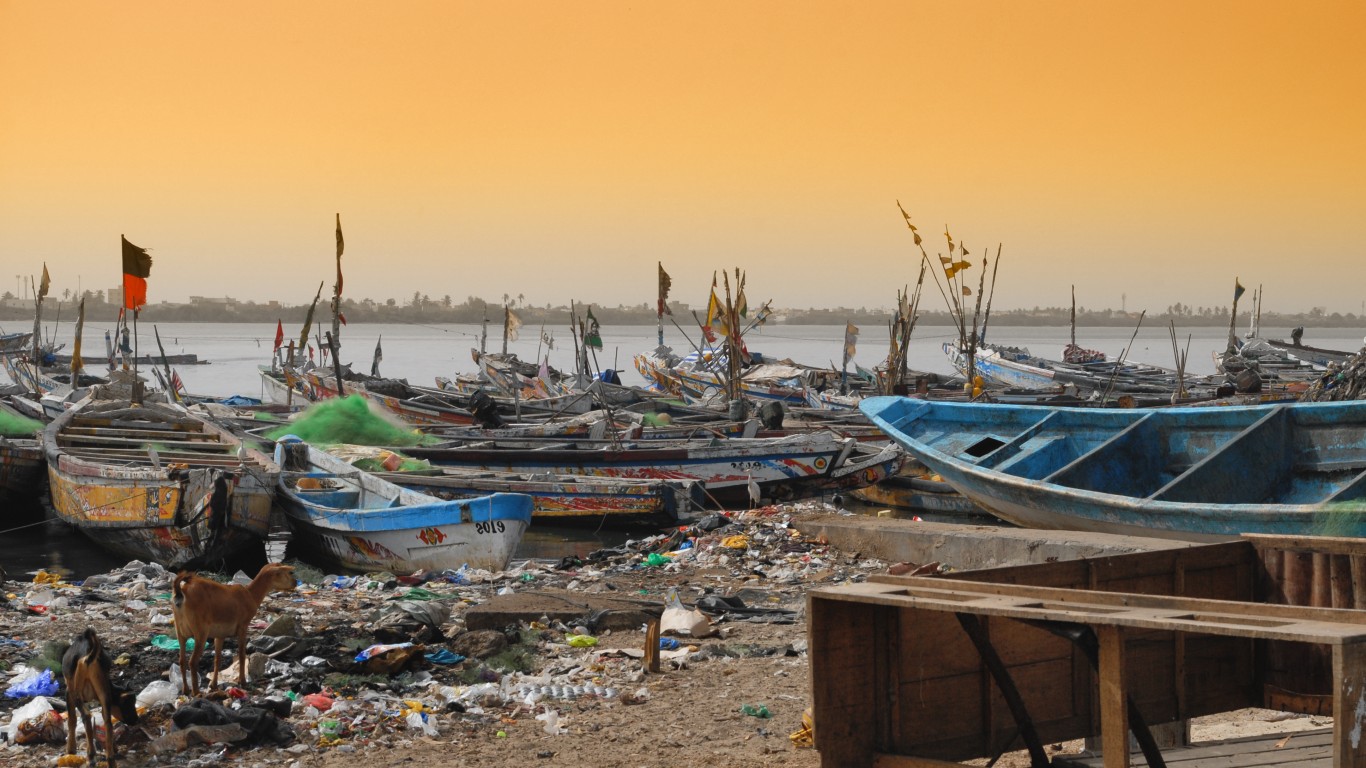
46. Senegal
> 10-year chg. in EPI score: -0.9
> 2022 score: 33.9 – #136 out of 180
> 2012 score: 34.8 – #115 out of 178
> GDP per capita: $1,472 – #174 out of 213
> Population: 16.7 million – #69 out of 217

44. Azerbaijan
> 10-year chg. in EPI score: -1.3
> 2022 score: 38.6 – #104 out of 180
> 2012 score: 39.9 – #83 out of 178
> GDP per capita: $4,221 – #127 out of 213
> Population: 10.1 million – #90 out of 217
[in-text-ad]

44. Laos
> 10-year chg. in EPI score: -1.3
> 2022 score: 30.7 – #149 out of 180
> 2012 score: 32.0 – #136 out of 178
> GDP per capita: $2,630 – #155 out of 213
> Population: 7.3 million – #103 out of 217

41. Portugal
> 10-year chg. in EPI score: -1.6
> 2022 score: 50.4 – #48 out of 180
> 2012 score: 52.0 – #26 out of 178
> GDP per capita: $22,195 – #54 out of 213
> Population: 10.3 million – #88 out of 217
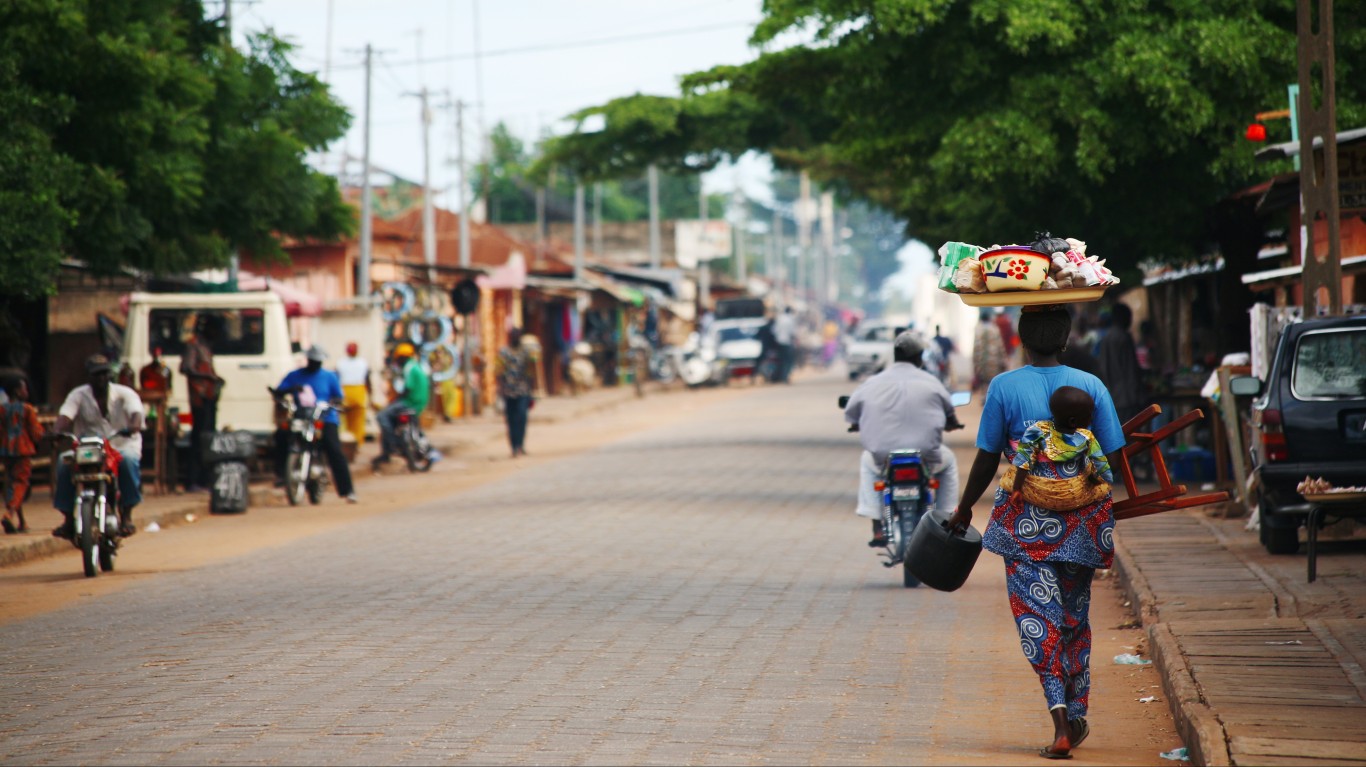
41. Benin
> 10-year chg. in EPI score: -1.6
> 2022 score: 29.6 – #155 out of 180
> 2012 score: 31.2 – #139 out of 178
> GDP per capita: $1,291 – #179 out of 213
> Population: 12.1 million – #76 out of 217
[in-text-ad-2]

41. Tajikistan
> 10-year chg. in EPI score: -1.6
> 2022 score: 37.1 – #117 out of 180
> 2012 score: 38.7 – #85 out of 178
> GDP per capita: $859 – #193 out of 213
> Population: 9.5 million – #94 out of 217
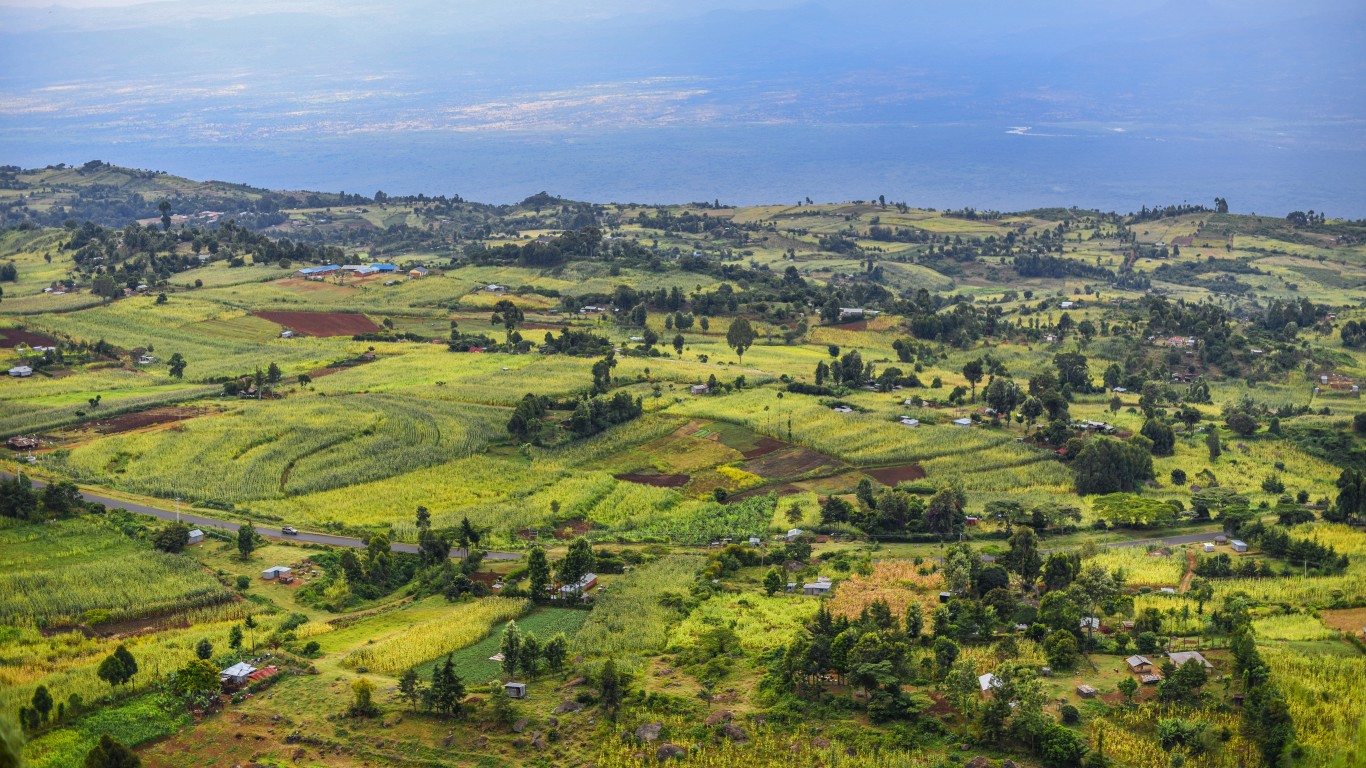
39. Kenya
> 10-year chg. in EPI score: -1.8
> 2022 score: 30.8 – #148 out of 180
> 2012 score: 32.6 – #133 out of 178
> GDP per capita: $1,879 – #166 out of 213
> Population: 53.8 million – #27 out of 217
[in-text-ad]
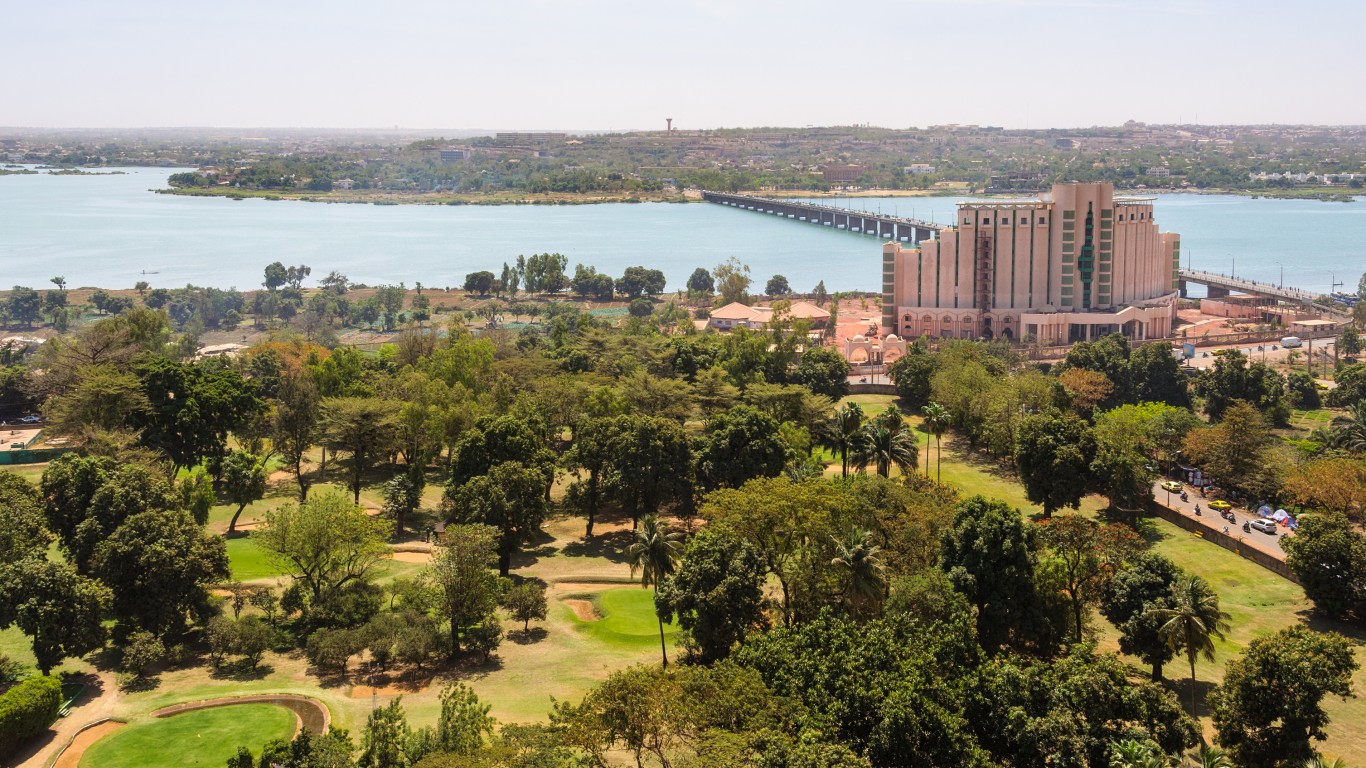
39. Mali
> 10-year chg. in EPI score: -1.8
> 2022 score: 28.5 – #159 out of 180
> 2012 score: 30.3 – #146 out of 178
> GDP per capita: $863 – #192 out of 213
> Population: 20.3 million – #59 out of 217

38. Bangladesh
> 10-year chg. in EPI score: -1.9
> 2022 score: 23.1 – #177 out of 180
> 2012 score: 25.0 – #167 out of 178
> GDP per capita: $1,962 – #163 out of 213
> Population: 164.7 million – #8 out of 217

36. Jamaica
> 10-year chg. in EPI score: -2.0
> 2022 score: 45.6 – #72 out of 180
> 2012 score: 47.6 – #40 out of 178
> GDP per capita: $4,665 – #118 out of 213
> Population: 3.0 million – #137 out of 217
[in-text-ad-2]
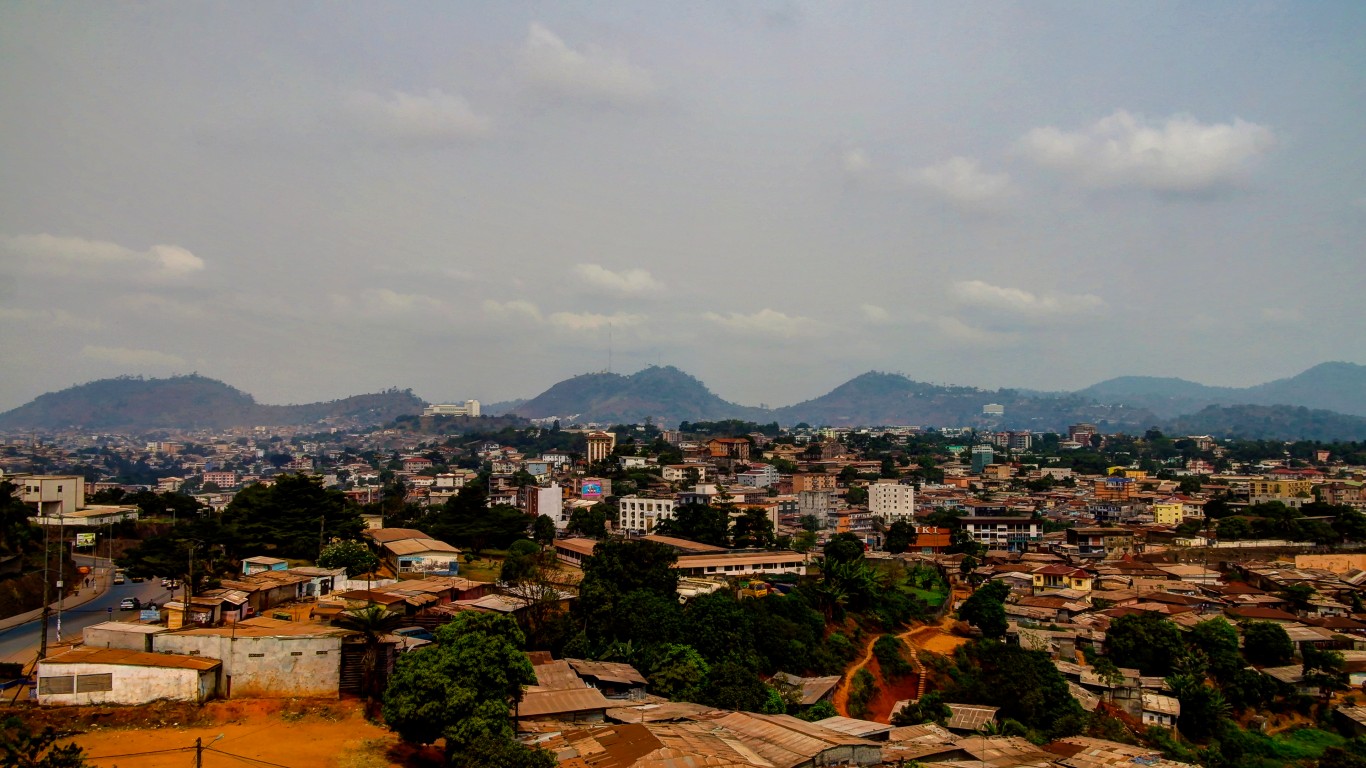
36. Cameroon
> 10-year chg. in EPI score: -2.0
> 2022 score: 30.2 – #153 out of 180
> 2012 score: 32.2 – #135 out of 178
> GDP per capita: $1,537 – #173 out of 213
> Population: 26.5 million – #52 out of 217
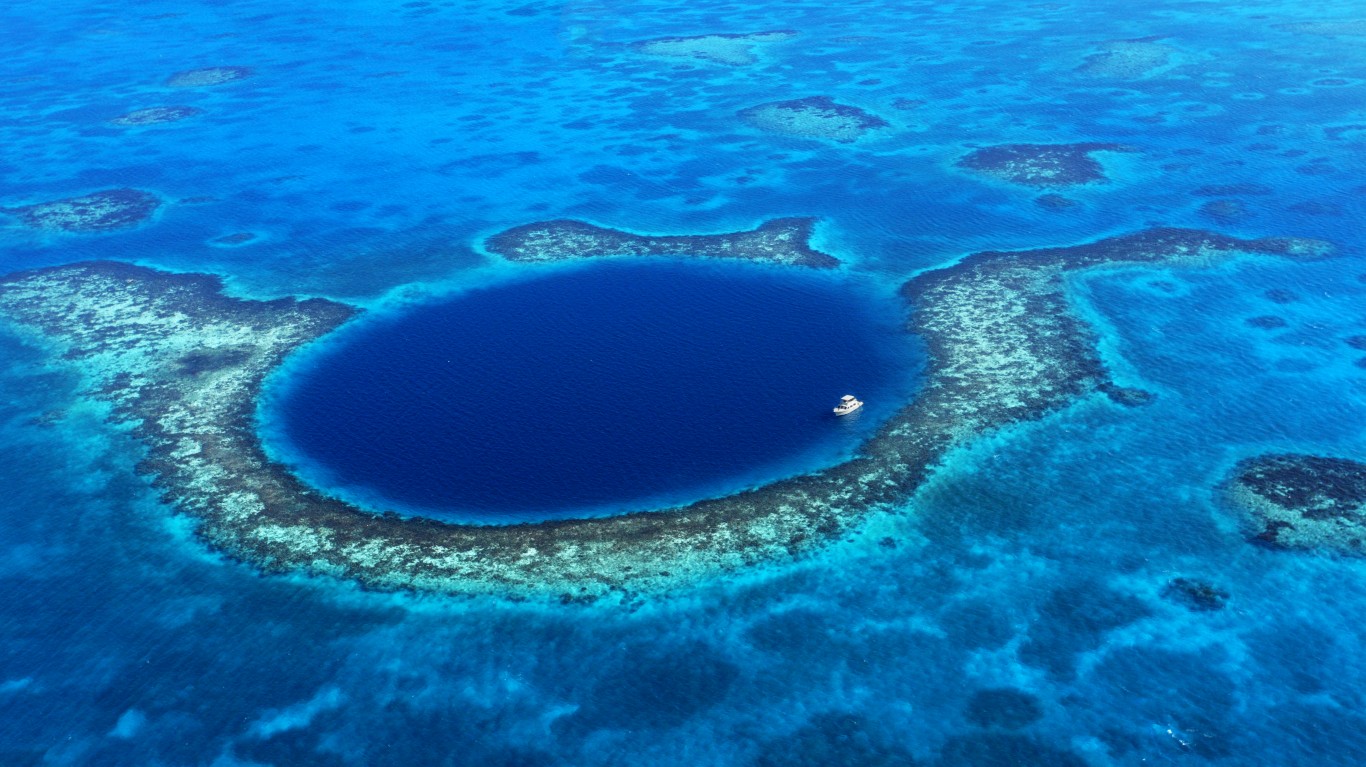
35. Belize
> 10-year chg. in EPI score: -2.1
> 2022 score: 50.0 – #49 out of 180
> 2012 score: 52.1 – #24 out of 178
> GDP per capita: $4,115 – #132 out of 213
> Population: 0.4 million – #174 out of 217
[in-text-ad]

34. Qatar
> 10-year chg. in EPI score: -2.3
> 2022 score: 33.0 – #137 out of 180
> 2012 score: 35.3 – #112 out of 178
> GDP per capita: $50,124 – #20 out of 213
> Population: 2.9 million – #138 out of 217

33. Togo
> 10-year chg. in EPI score: -2.4
> 2022 score: 34.0 – #135 out of 180
> 2012 score: 36.4 – #103 out of 178
> GDP per capita: $915 – #190 out of 213
> Population: 8.3 million – #100 out of 217
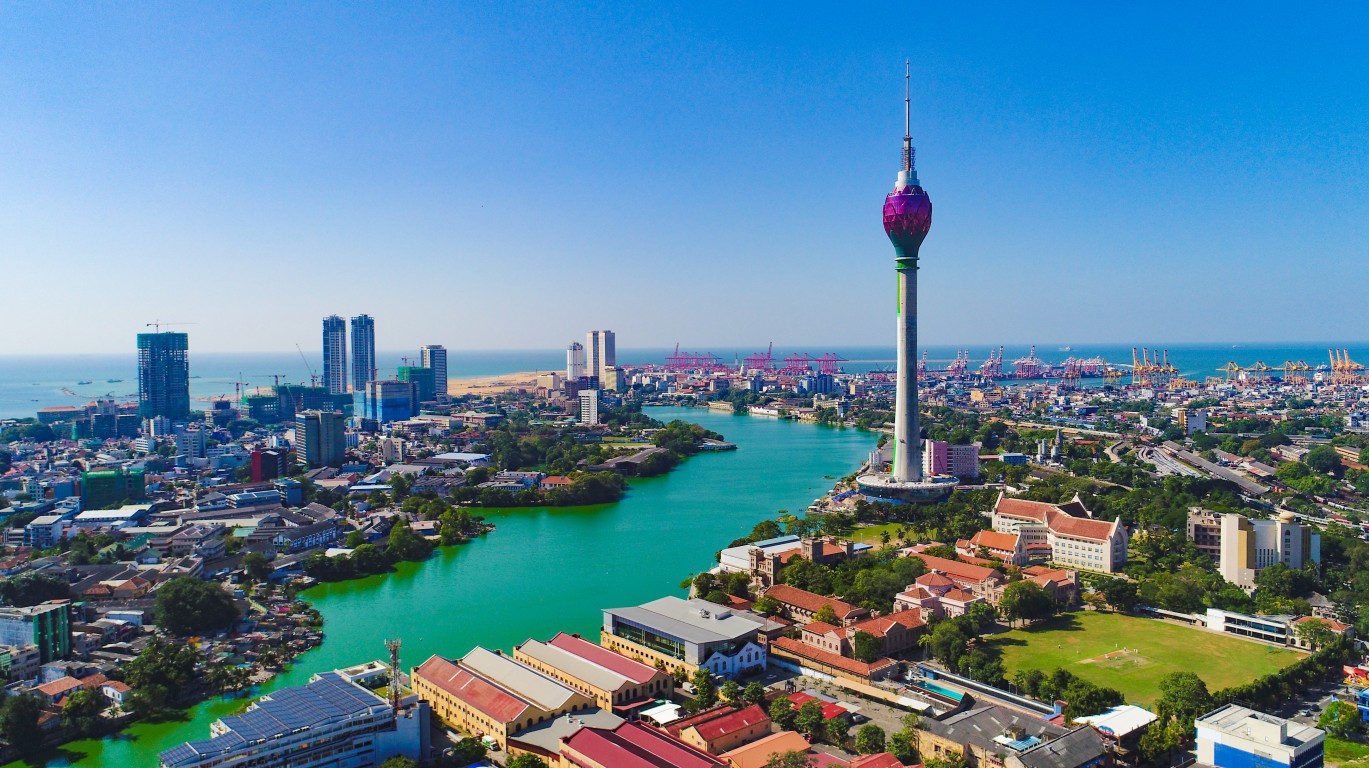
32. Sri Lanka
> 10-year chg. in EPI score: -2.6
> 2022 score: 34.7 – #132 out of 180
> 2012 score: 37.3 – #92 out of 178
> GDP per capita: $3,681 – #139 out of 213
> Population: 21.9 million – #57 out of 217
[in-text-ad-2]
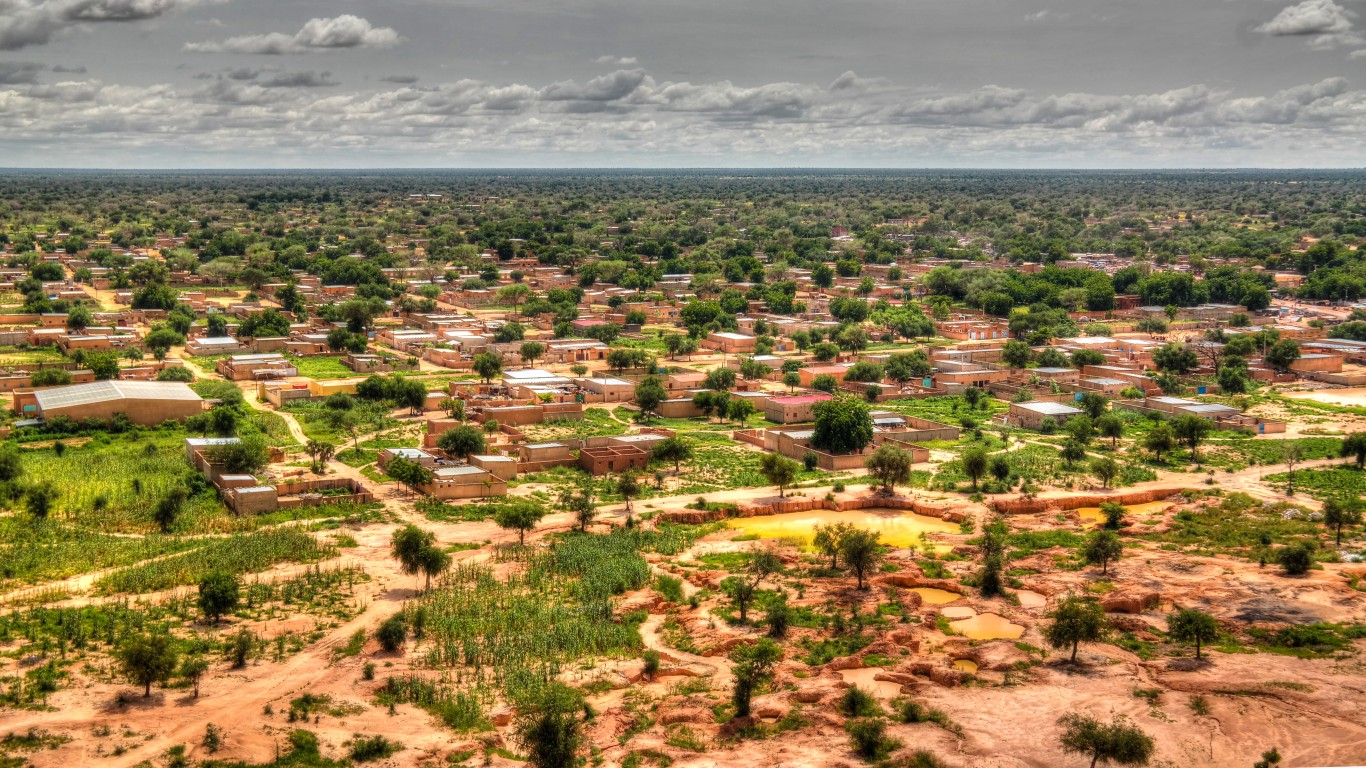
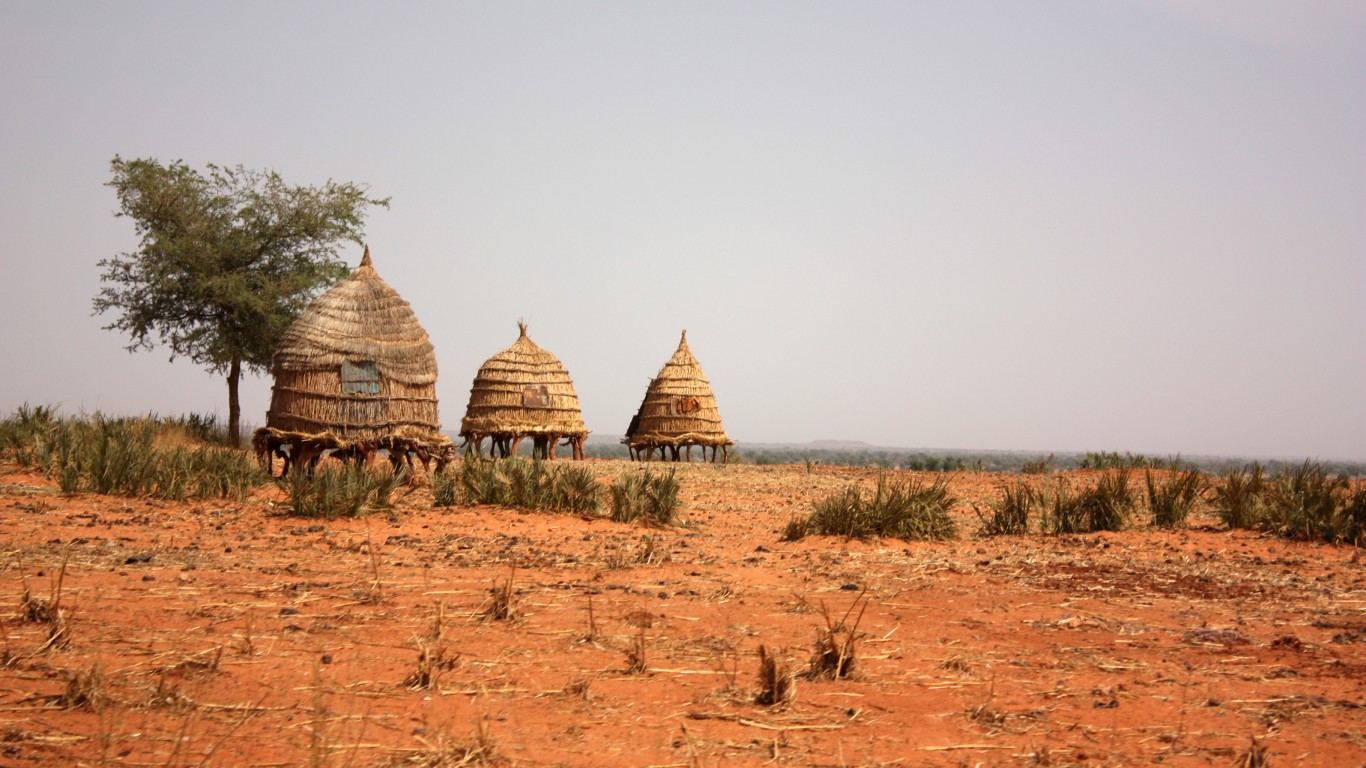
31. Niger
> 10-year chg. in EPI score: -2.8
> 2022 score: 37.7 – #110 out of 180
> 2012 score: 40.5 – #79 out of 178
> GDP per capita: $568 – #204 out of 213
> Population: 24.2 million – #56 out of 217

29. Tonga
> 10-year chg. in EPI score: -3.0
> 2022 score: 43.8 – #80 out of 180
> 2012 score: 46.8 – #46 out of 178
> GDP per capita: $4,625 – #120 out of 213
> Population: 0.1 million – #193 out of 217
[in-text-ad]

29. Guatemala
> 10-year chg. in EPI score: -3.0
> 2022 score: 28.0 – #167 out of 180
> 2012 score: 31.0 – #141 out of 178
> GDP per capita: $4,603 – #121 out of 213
> Population: 16.9 million – #68 out of 217
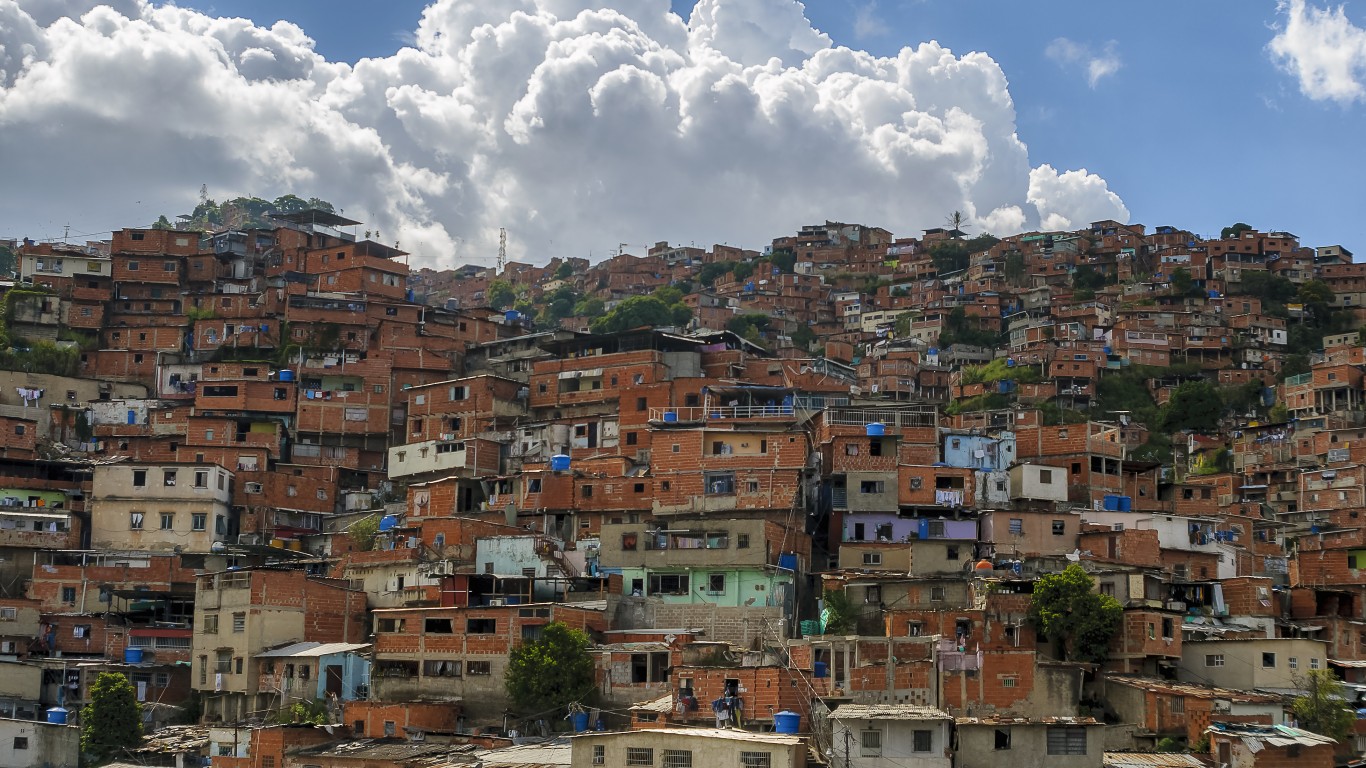
28. Dominican Republic
> 10-year chg. in EPI score: -3.1
> 2022 score: 42.2 – #89 out of 180
> 2012 score: 45.3 – #55 out of 178
> GDP per capita: $7,268 – #98 out of 213
> Population: 10.8 million – #84 out of 217

27. Mauritania
> 10-year chg. in EPI score: -3.3
> 2022 score: 28.1 – #165 out of 180
> 2012 score: 31.4 – #137 out of 178
> GDP per capita: $1,702 – #170 out of 213
> Population: 4.6 million – #126 out of 217
[in-text-ad-2]

26. Fiji
> 10-year chg. in EPI score: -3.7
> 2022 score: 31.3 – #147 out of 180
> 2012 score: 35.0 – #113 out of 178
> GDP per capita: $5,058 – #115 out of 213
> Population: 0.9 million – #161 out of 217
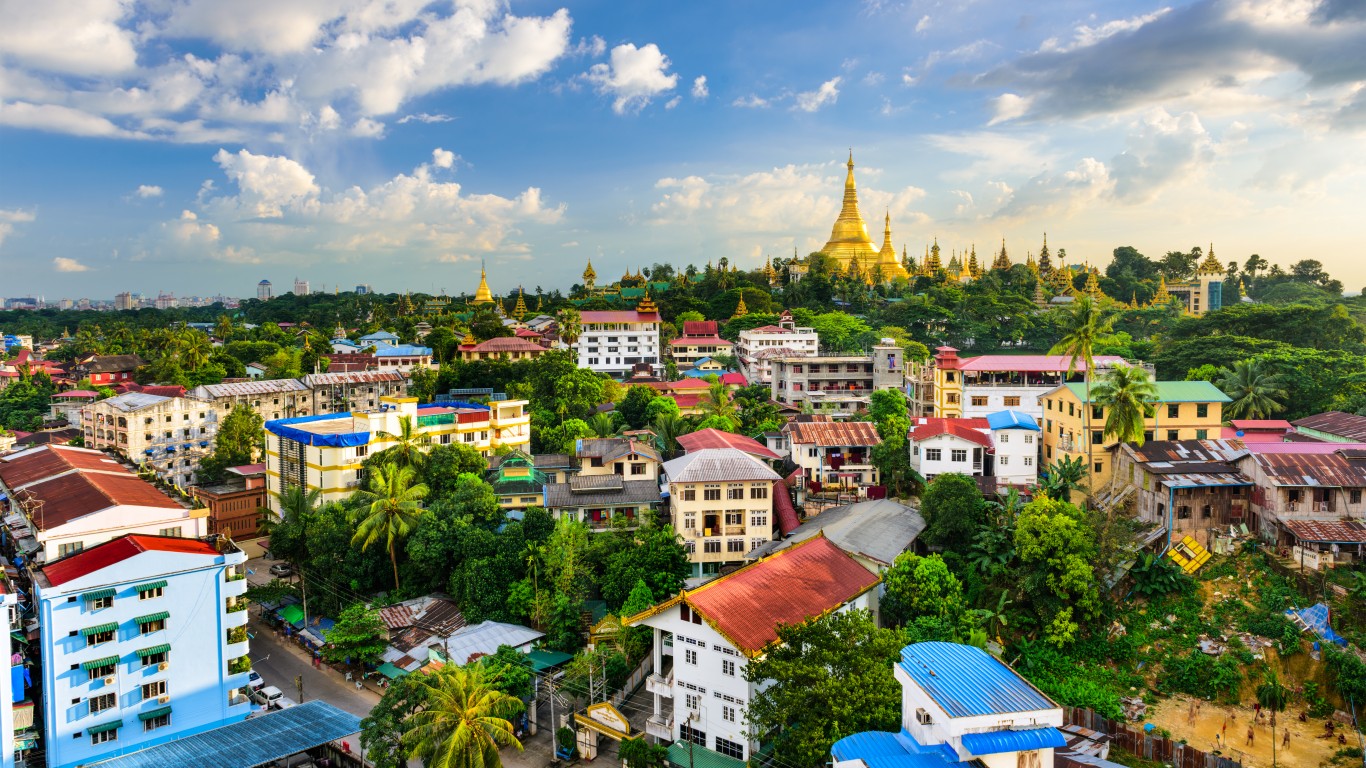
25. Myanmar
> 10-year chg. in EPI score: -3.8
> 2022 score: 19.4 – #179 out of 180
> 2012 score: 23.2 – #174 out of 178
> GDP per capita: $1,468 – #175 out of 213
> Population: 54.4 million – #26 out of 217
[in-text-ad]

23. Algeria
> 10-year chg. in EPI score: -4.0
> 2022 score: 29.6 – #155 out of 180
> 2012 score: 33.6 – #125 out of 178
> GDP per capita: $3,307 – #145 out of 213
> Population: 43.9 million – #34 out of 217
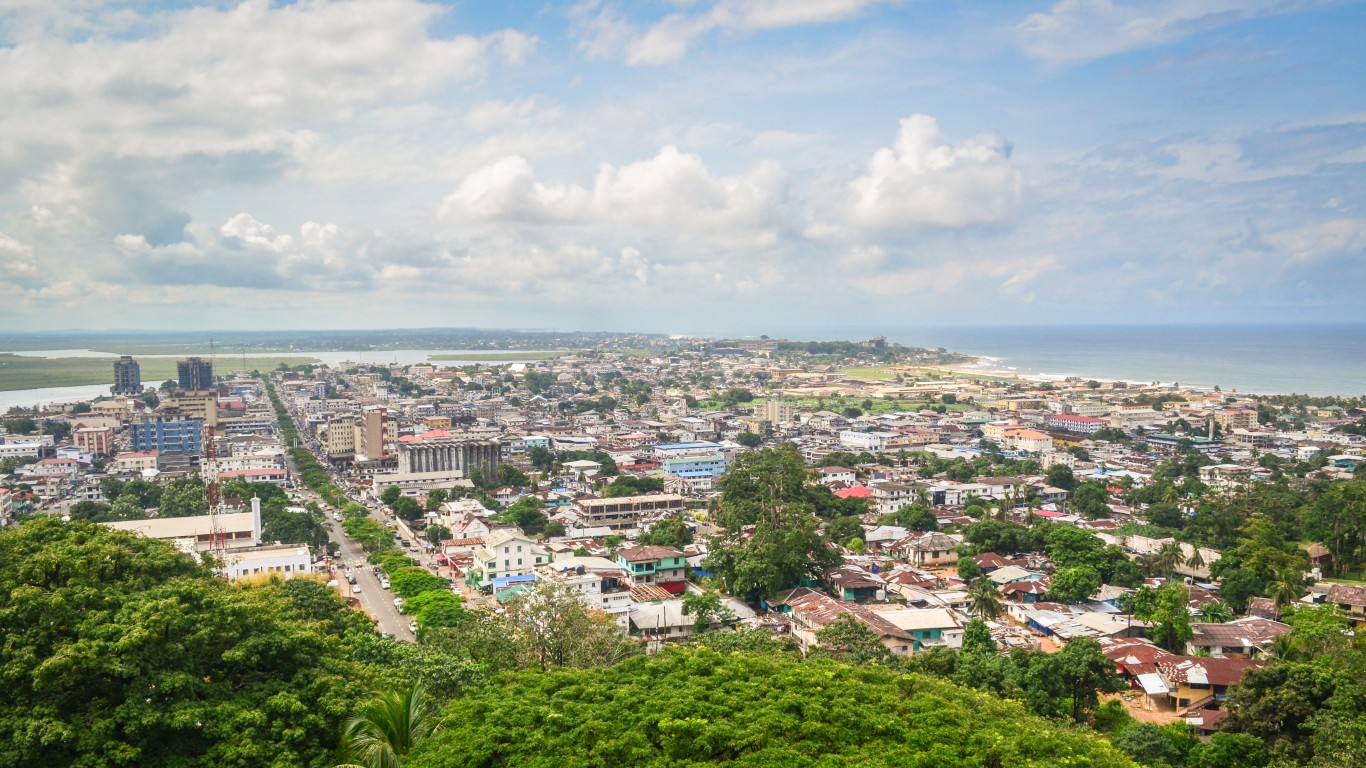
23. Liberia
> 10-year chg. in EPI score: -4.0
> 2022 score: 24.9 – #174 out of 180
> 2012 score: 28.9 – #153 out of 178
> GDP per capita: $633 – #203 out of 213
> Population: 5.1 million – #122 out of 217

22. Rwanda
> 10-year chg. in EPI score: -4.2
> 2022 score: 32.8 – #138 out of 180
> 2012 score: 37.0 – #98 out of 178
> GDP per capita: $798 – #196 out of 213
> Population: 13.0 million – #75 out of 217
[in-text-ad-2]
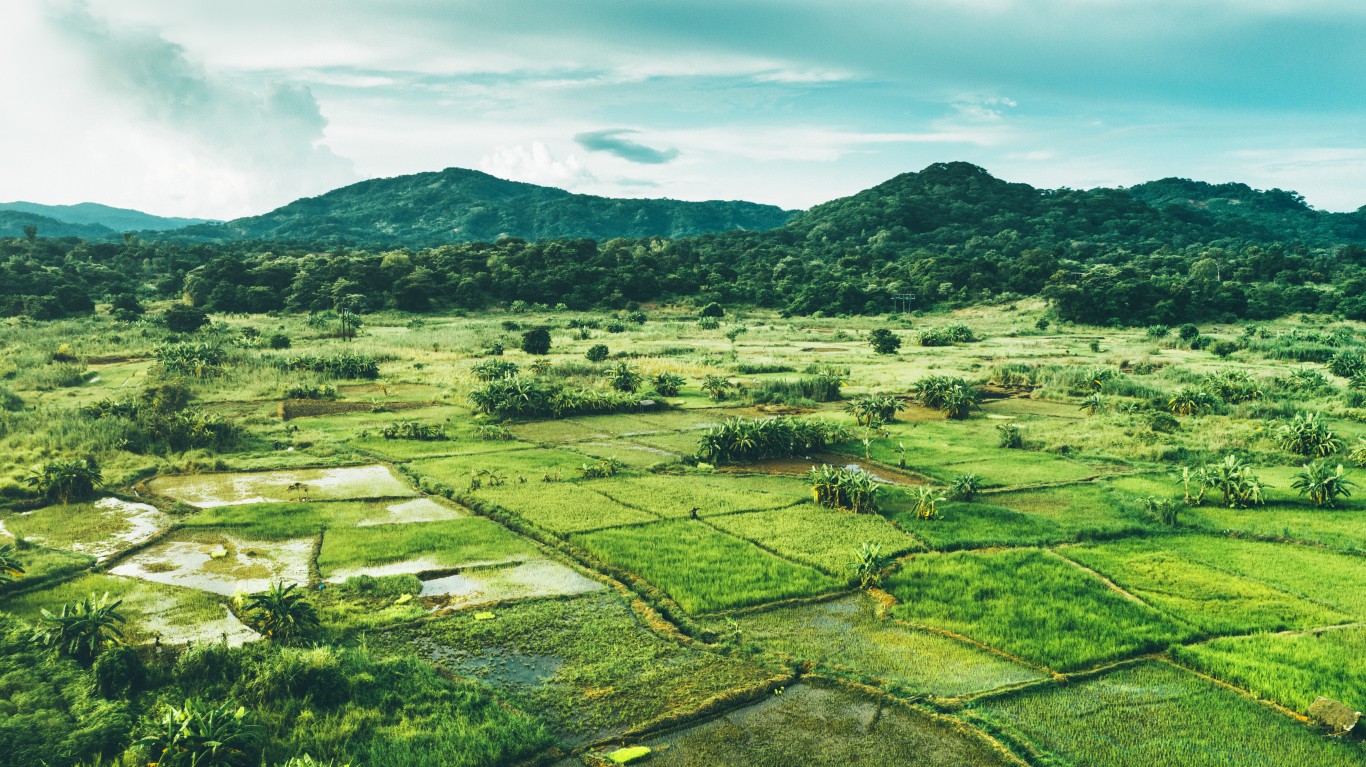
21. Malawi
> 10-year chg. in EPI score: -4.5
> 2022 score: 40.6 – #97 out of 180
> 2012 score: 45.1 – #57 out of 178
> GDP per capita: $637 – #202 out of 213
> Population: 19.1 million – #61 out of 217

20. Lebanon
> 10-year chg. in EPI score: -4.7
> 2022 score: 32.2 – #142 out of 180
> 2012 score: 36.9 – #99 out of 178
> GDP per capita: $4,650 – #119 out of 213
> Population: 6.8 million – #108 out of 217
[in-text-ad]

19. Moldova
> 10-year chg. in EPI score: -4.8
> 2022 score: 42.7 – #84 out of 180
> 2012 score: 47.5 – #41 out of 178
> GDP per capita: $4,547 – #122 out of 213
> Population: 2.6 million – #141 out of 217

18. Mongolia
> 10-year chg. in EPI score: -5.2
> 2022 score: 29.6 – #155 out of 180
> 2012 score: 34.8 – #114 out of 178
> GDP per capita: $4,061 – #134 out of 213
> Population: 3.3 million – #134 out of 217

17. Iraq
> 10-year chg. in EPI score: -5.3
> 2022 score: 27.8 – #169 out of 180
> 2012 score: 33.1 – #130 out of 178
> GDP per capita: $4,146 – #129 out of 213
> Population: 40.2 million – #36 out of 217
[in-text-ad-2]

16. Madagascar
> 10-year chg. in EPI score: -5.4
> 2022 score: 28.0 – #167 out of 180
> 2012 score: 33.4 – #127 out of 178
> GDP per capita: $472 – #210 out of 213
> Population: 27.7 million – #51 out of 217
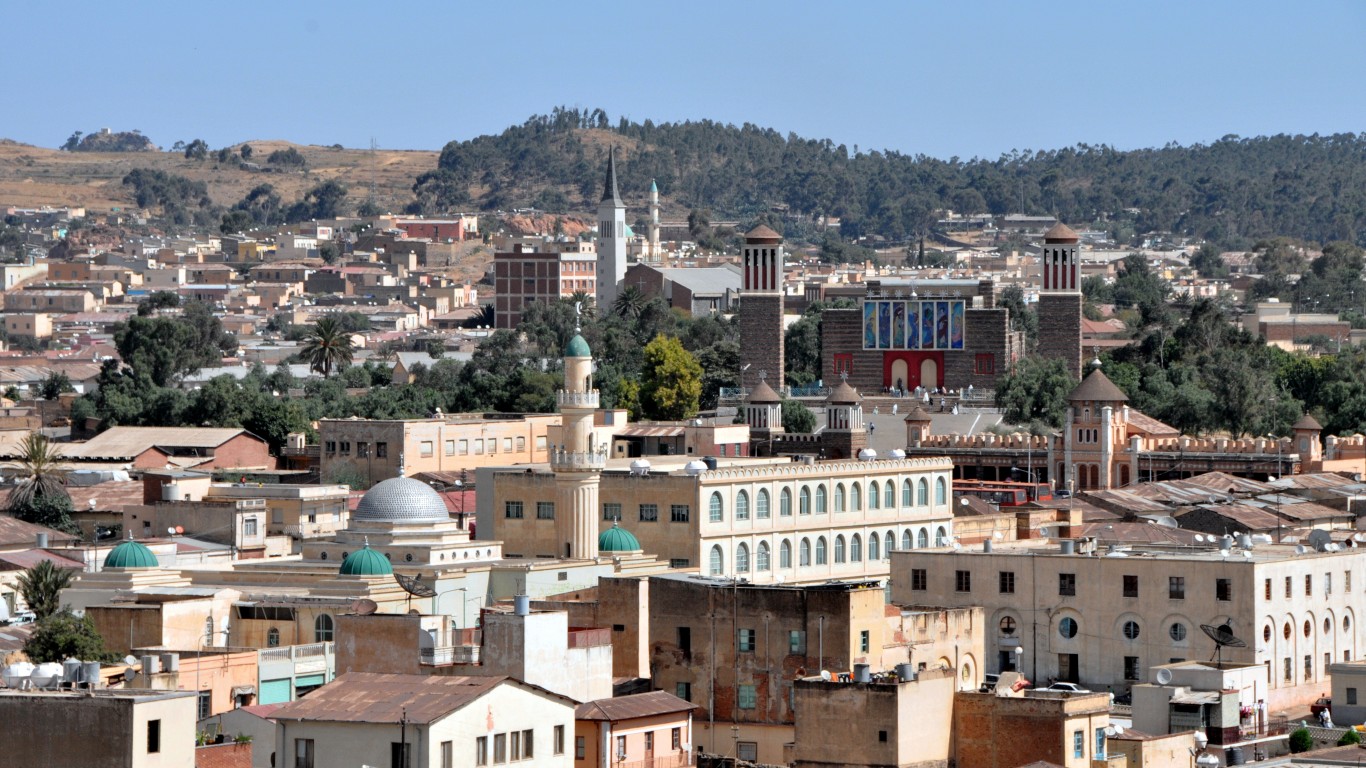
15. Eritrea
> 10-year chg. in EPI score: -5.5
> 2022 score: 31.7 – #144 out of 180
> 2012 score: 37.2 – #94 out of 178
> GDP per capita: $643 – #201 out of 213
> Population: 3.2 million – #135 out of 217
[in-text-ad]

14. Micronesia
> 10-year chg. in EPI score: -5.9
> 2022 score: 37.4 – #113 out of 180
> 2012 score: 43.3 – #68 out of 178
> GDP per capita: $3,565 – #141 out of 213
> Population: 0.1 million – #188 out of 217
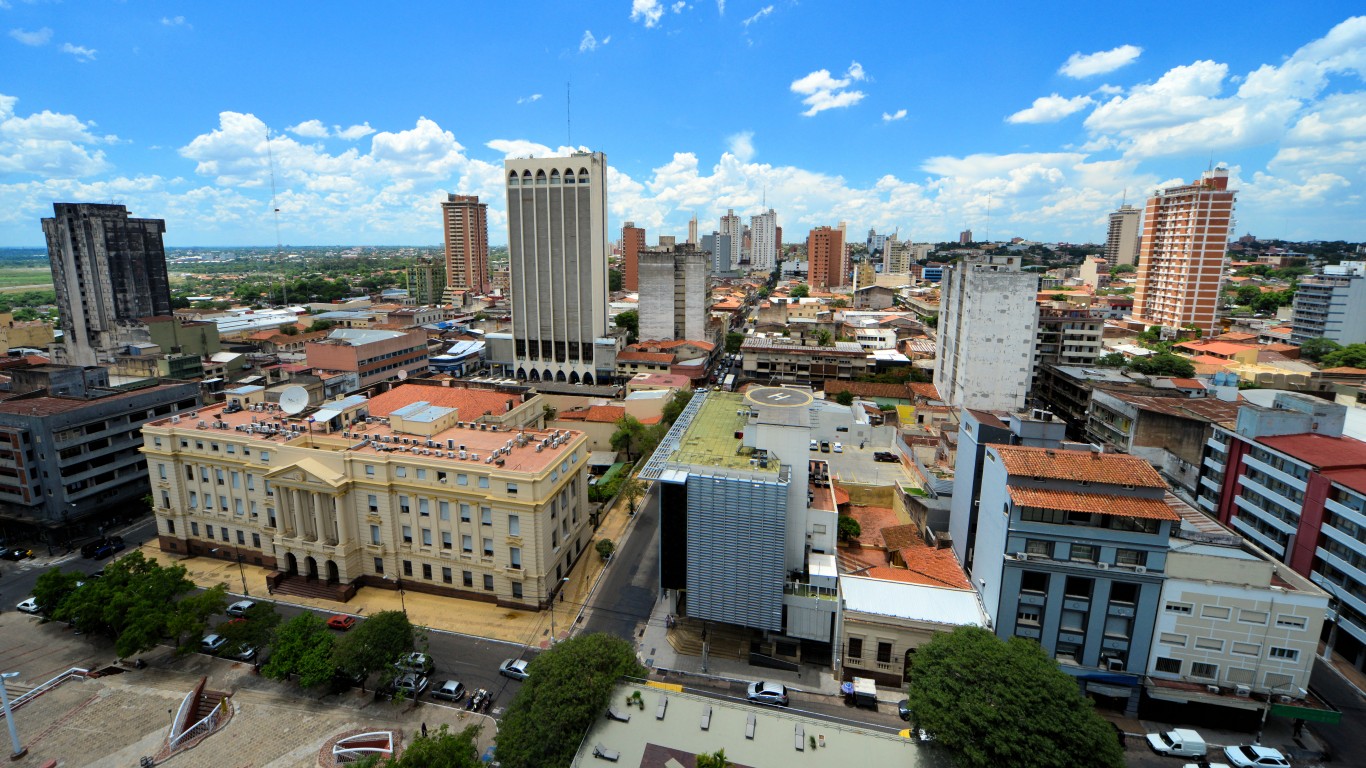
13. Paraguay
> 10-year chg. in EPI score: -6.0
> 2022 score: 40.9 – #93 out of 180
> 2012 score: 46.9 – #45 out of 178
> GDP per capita: $5,001 – #116 out of 213
> Population: 7.1 million – #104 out of 217

10. Guyana
> 10-year chg. in EPI score: -6.1
> 2022 score: 38.5 – #105 out of 180
> 2012 score: 44.6 – #60 out of 178
> GDP per capita: $6,956 – #102 out of 213
> Population: 0.8 million – #163 out of 217
[in-text-ad-2]

10. Ghana
> 10-year chg. in EPI score: -6.1
> 2022 score: 27.7 – #170 out of 180
> 2012 score: 33.8 – #124 out of 178
> GDP per capita: $2,206 – #160 out of 213
> Population: 31.1 million – #47 out of 217
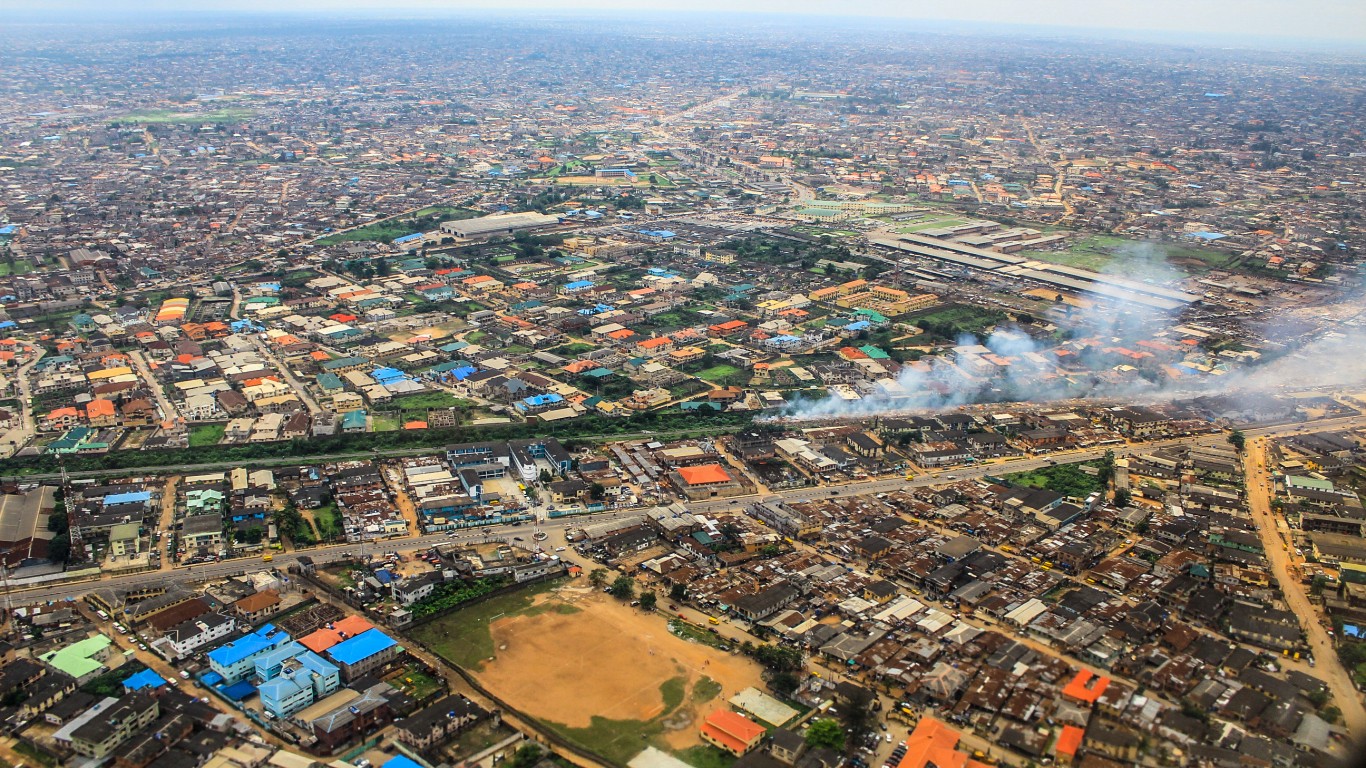
10. Nigeria
> 10-year chg. in EPI score: -6.1
> 2022 score: 28.3 – #162 out of 180
> 2012 score: 34.4 – #120 out of 178
> GDP per capita: $2,097 – #162 out of 213
> Population: 206.1 million – #7 out of 217
[in-text-ad]

9. Zambia
> 10-year chg. in EPI score: -6.9
> 2022 score: 38.4 – #106 out of 180
> 2012 score: 45.3 – #56 out of 178
> GDP per capita: $985 – #188 out of 213
> Population: 18.4 million – #64 out of 217

8. Samoa
> 10-year chg. in EPI score: -7.4
> 2022 score: 36.4 – #122 out of 180
> 2012 score: 43.8 – #63 out of 178
> GDP per capita: $4,068 – #133 out of 213
> Population: 0.2 million – #182 out of 217

7. Philippines
> 10-year chg. in EPI score: -7.5
> 2022 score: 28.9 – #158 out of 180
> 2012 score: 36.4 – #103 out of 178
> GDP per capita: $3,299 – #146 out of 213
> Population: 109.6 million – #13 out of 217
[in-text-ad-2]

6. Bhutan
> 10-year chg. in EPI score: -7.9
> 2022 score: 42.5 – #85 out of 180
> 2012 score: 50.4 – #32 out of 178
> GDP per capita: $3,001 – #151 out of 213
> Population: 0.8 million – #164 out of 217
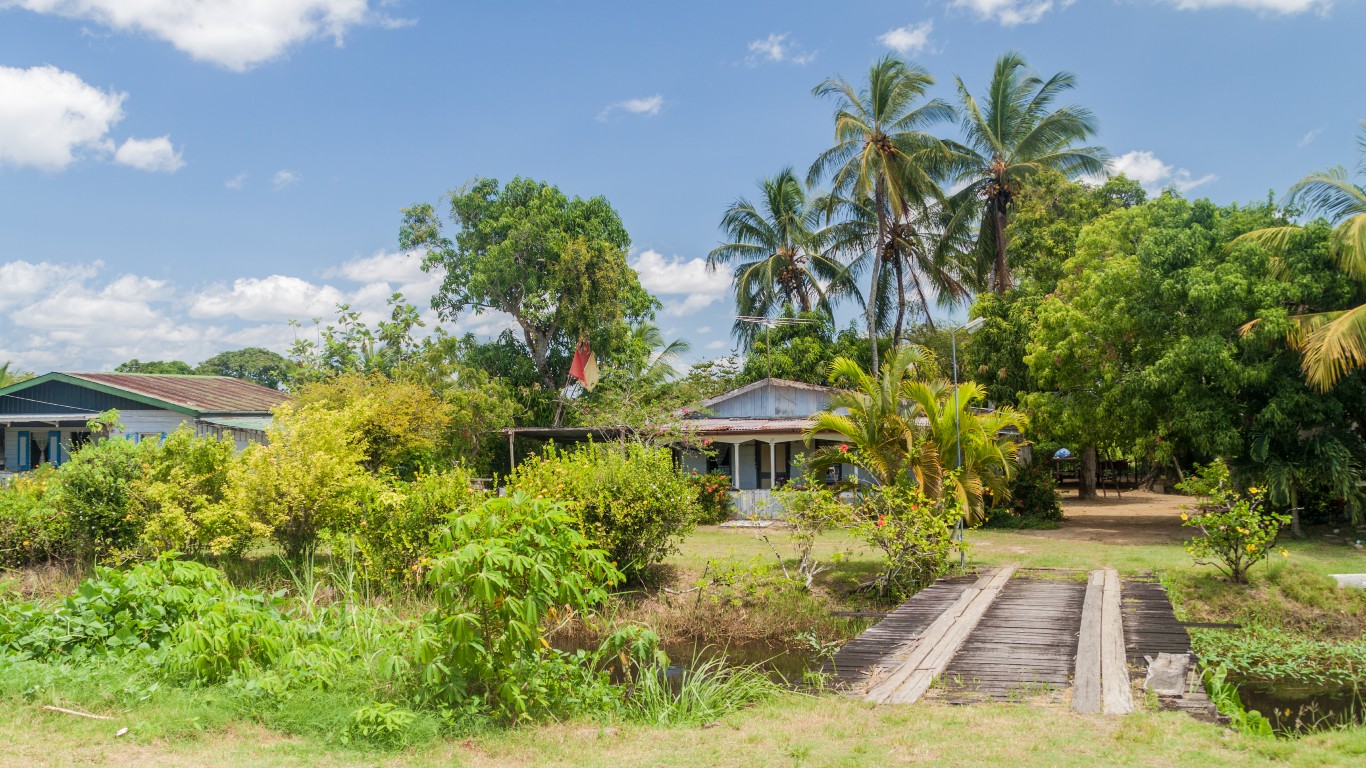
5. Suriname
> 10-year chg. in EPI score: -8.0
> 2022 score: 45.9 – #70 out of 180
> 2012 score: 53.9 – #19 out of 178
> GDP per capita: $4,917 – #117 out of 213
> Population: 0.6 million – #169 out of 217
[in-text-ad]
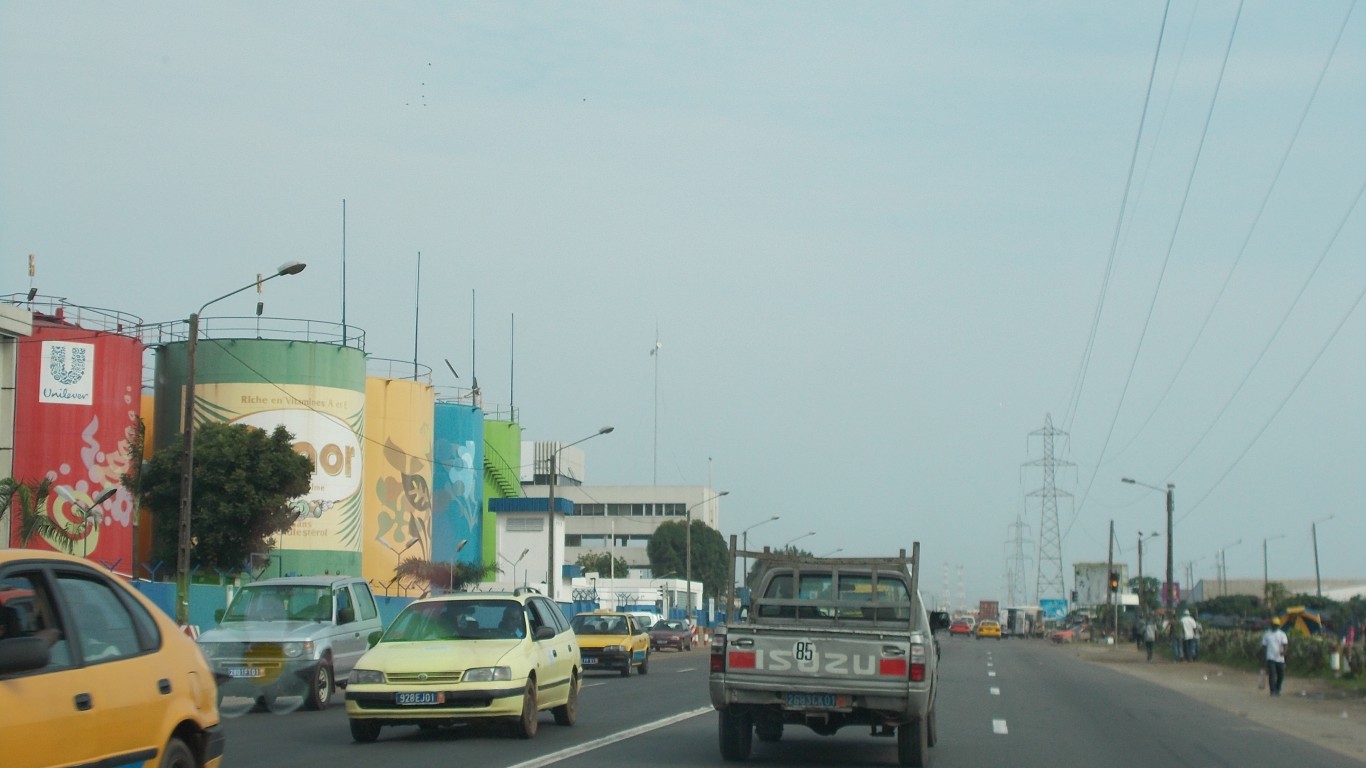
4. Cote d’Ivoire
> 10-year chg. in EPI score: -8.2
> 2022 score: 32.8 – #138 out of 180
> 2012 score: 41.0 – #74 out of 178
> GDP per capita: $2,326 – #158 out of 213
> Population: 26.4 million – #53 out of 217
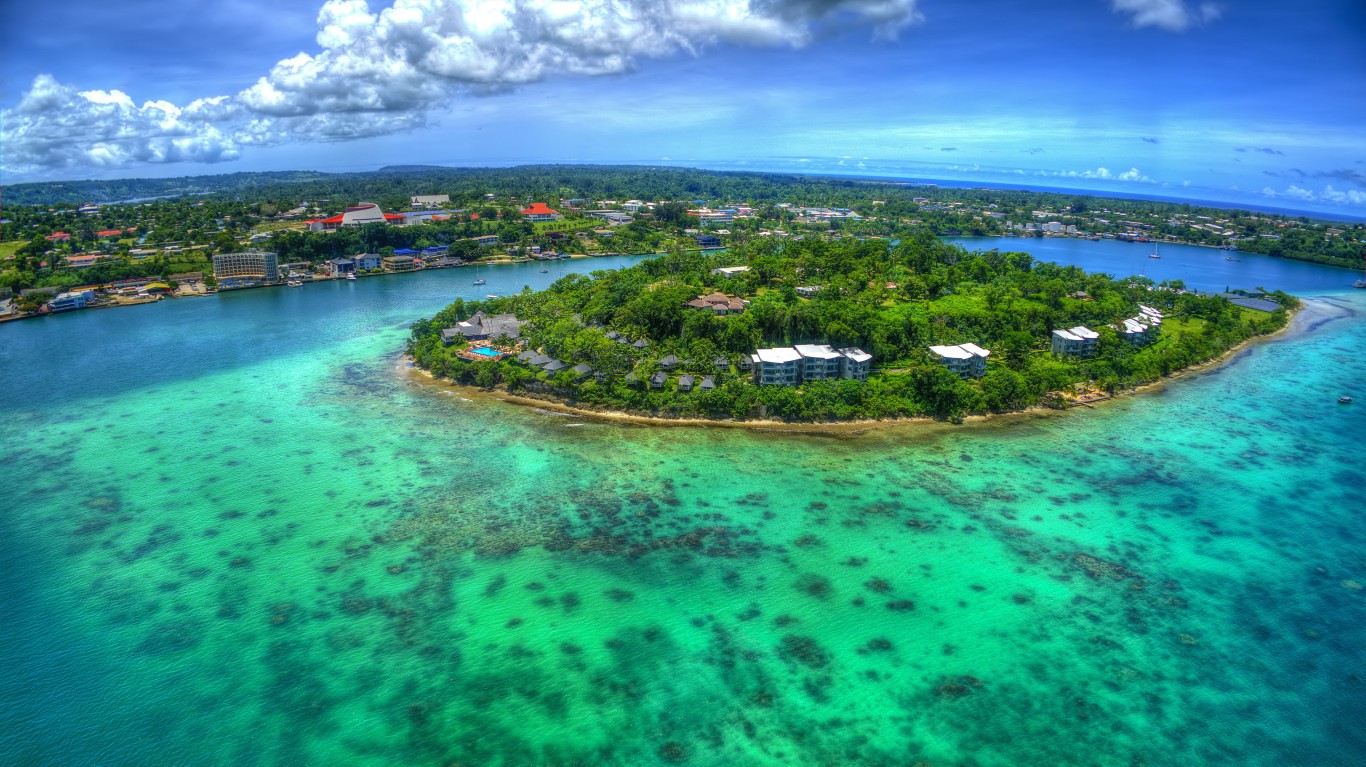
3. Vanuatu
> 10-year chg. in EPI score: -9.2
> 2022 score: 36.9 – #119 out of 180
> 2012 score: 46.1 – #50 out of 178
> GDP per capita: $2,870 – #152 out of 213
> Population: 0.3 million – #177 out of 217

2. Nepal
> 10-year chg. in EPI score: -10.3
> 2022 score: 28.3 – #162 out of 180
> 2012 score: 38.6 – #86 out of 178
> GDP per capita: $1,155 – #185 out of 213
> Population: 29.1 million – #49 out of 217
[in-text-ad-2]

1. Burundi
> 10-year chg. in EPI score: -13.0
> 2022 score: 30.5 – #151 out of 180
> 2012 score: 43.5 – #64 out of 178
> GDP per capita: $239 – #213 out of 213
> Population: 11.9 million – #77 out of 217
In 20 Years, I Haven’t Seen A Cash Back Card This Good
After two decades of reviewing financial products I haven’t seen anything like this. Credit card companies are at war, handing out free rewards and benefits to win the best customers.
A good cash back card can be worth thousands of dollars a year in free money, not to mention other perks like travel, insurance, and access to fancy lounges.
Our top pick today pays up to 5% cash back, a $200 bonus on top, and $0 annual fee. Click here to apply before they stop offering rewards this generous.
Flywheel Publishing has partnered with CardRatings for our coverage of credit card products. Flywheel Publishing and CardRatings may receive a commission from card issuers.
Thank you for reading! Have some feedback for us?
Contact the 24/7 Wall St. editorial team.
 24/7 Wall St.
 24/7 Wall St.
 24/7 Wall St.