The drone of lawn mowers heralds the arrival of better weather, longer days, and outside activities like picnics and barbecuing. But it also means the advent of summer allergies, and for many Americans, the uptick in allergen severity can keep them inside at a time when the great outdoors beckons. (Every season brings its issues. Here are the cities where people struggle the most with fall allergies.)
In some parts of the nation, allergies are more problematic than others, and one of the most common warm-weather allergies is to grass. Sufferers endure runny noses, itchy eyes, and other symptoms, and those with asthma may find their condition worsening. (Here are 16 symptoms you may not know are allergic reactions.)
To identify the 50 worst cities or metropolitan areas for grass allergies, 24/7 Tempo reviewed the 2022’s Worst Cities for Grass Allergies This Summer published by lawn care services company Lawn Love. Lawn Love ranked 125 metropolitan areas, assigning each an overall score out of 100 points – a weighted average of metrics that measure allergy risk, allergen severity, and quality of detection and treatment. The site sourced data from the American Academy of Allergy, Asthma & Immunology; Lawn Love; Pollen.com; and Urban Adaptation Assessment.
Click here to see the worst cities for people with grass allergies
Click here to see our detailed methodology
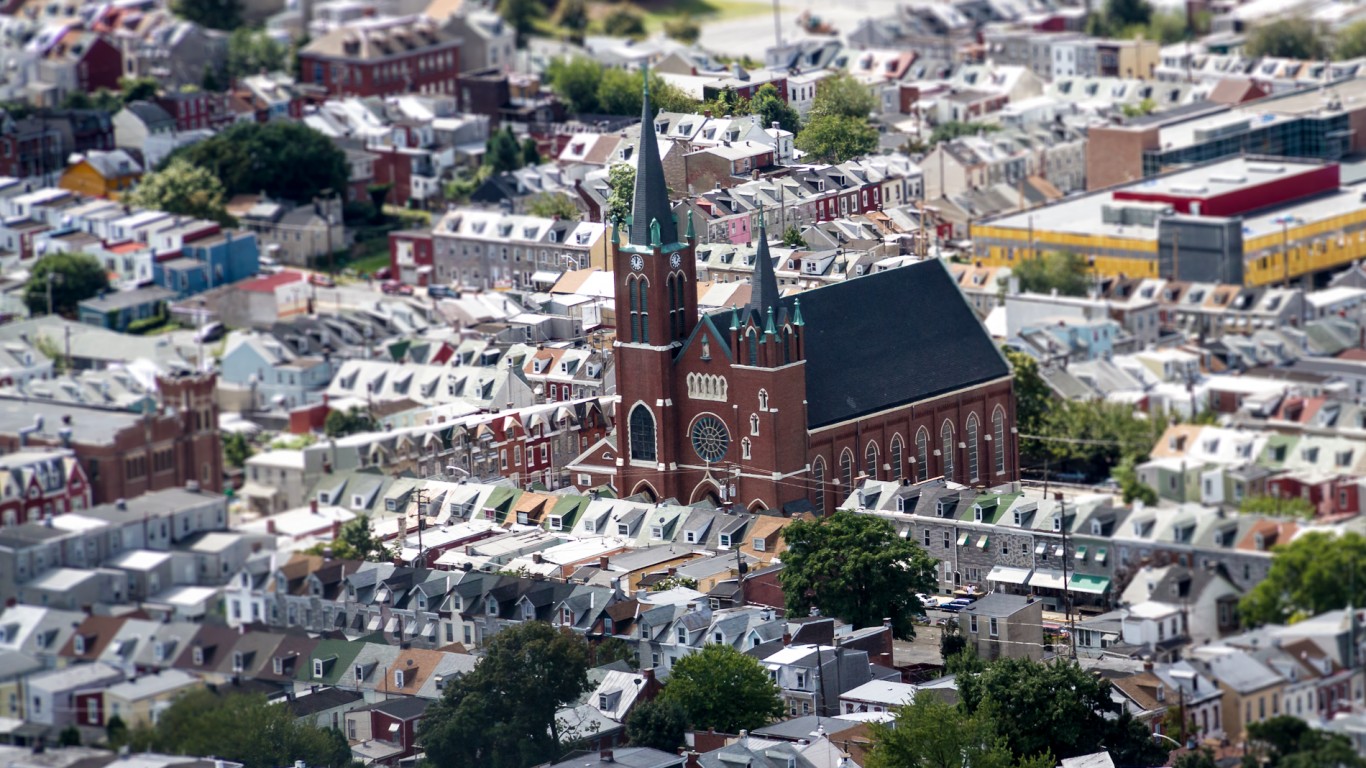
Northeasterners are most in need of stocking up on allergy meds. Five urban complexes – Lancaster, Pennsylvania.; Hartford-East Hartford-Middletown, Connecticut; Albany-Schenectady-Troy, New York; Allentown-Bethlehem-Easton, in Pennsylvania and New Jersey; and Buffalo-Cheektowaga, New York – will be the worst areas overall for grass allergy sufferers this season. Eight of the 10 worst metro areas, in fact, are in New England and Mid-Atlantic states.

50. San Diego-Chula Vista-Carlsbad, CA
> Overall score (out of 100): 52.25
> Allergy risk rank (out of 125): 64
> Allergen severity rank (out of 125): 33
> Detection and treatment rank (out of 125): 86
> Population: 3,323,970
[in-text-ad]
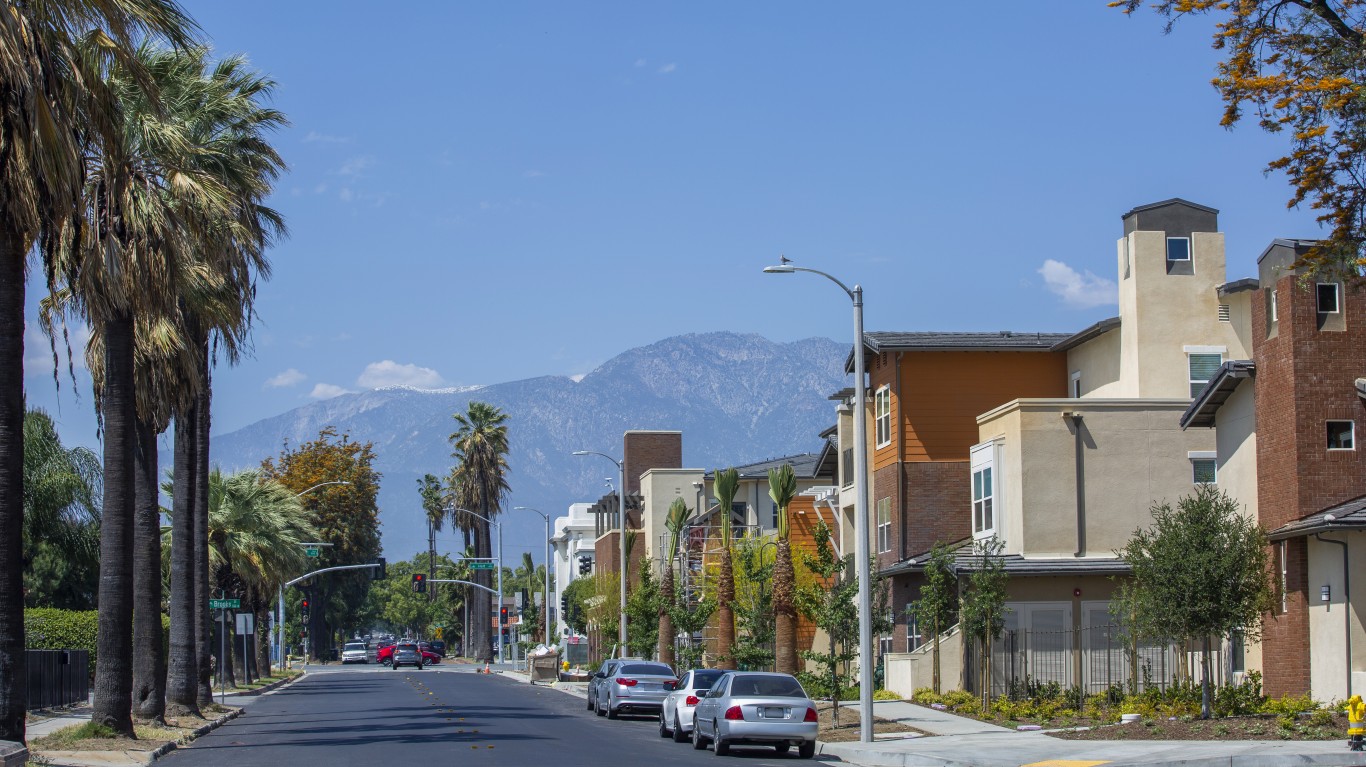
49. Riverside-San Bernardino-Ontario, CA
> Overall score (out of 100): 52.56
> Allergy risk rank (out of 125): 86
> Allergen severity rank (out of 125): 21
> Detection and treatment rank (out of 125): 70
> Population: 4,600,396
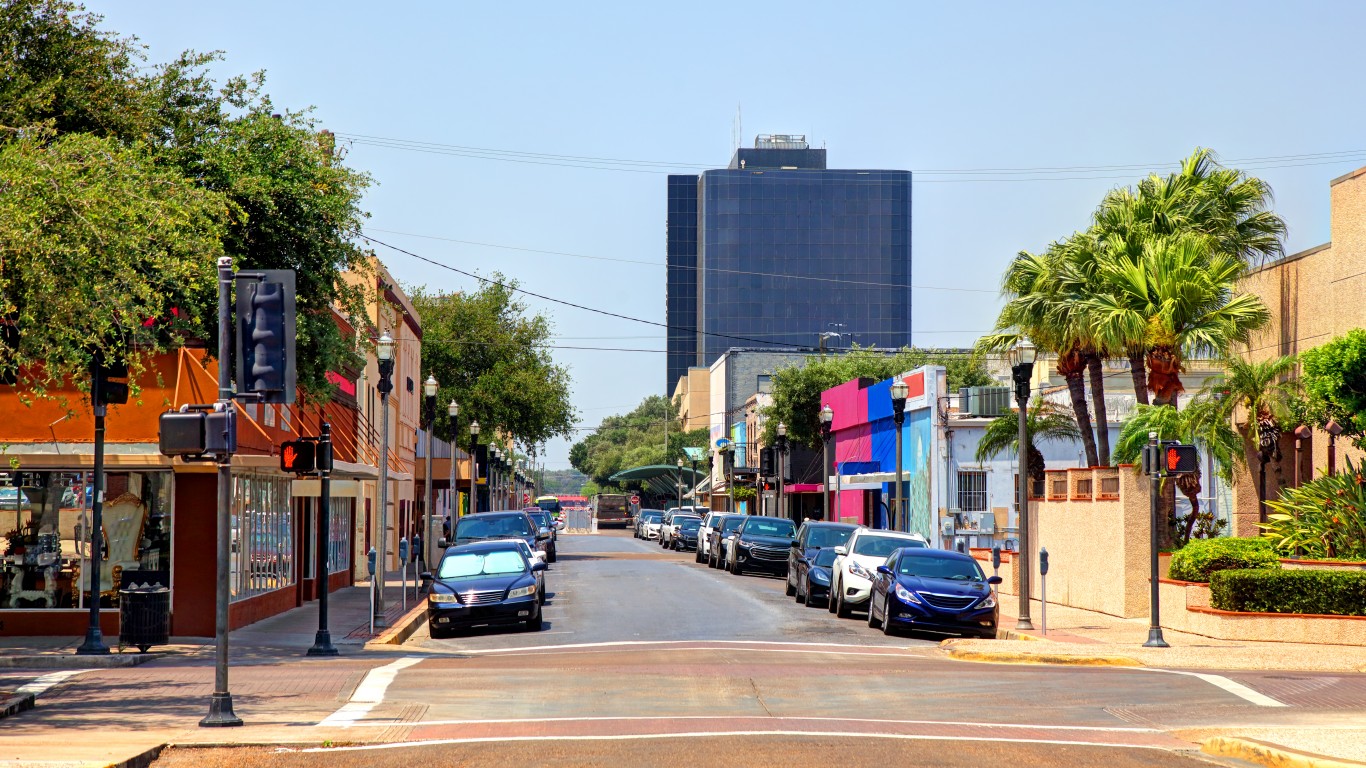
48. McAllen-Edinburg-Mission, TX
> Overall score (out of 100): 52.87
> Allergy risk rank (out of 125): 8
> Allergen severity rank (out of 125): 121
> Detection and treatment rank (out of 125): 1
> Population: 861,137
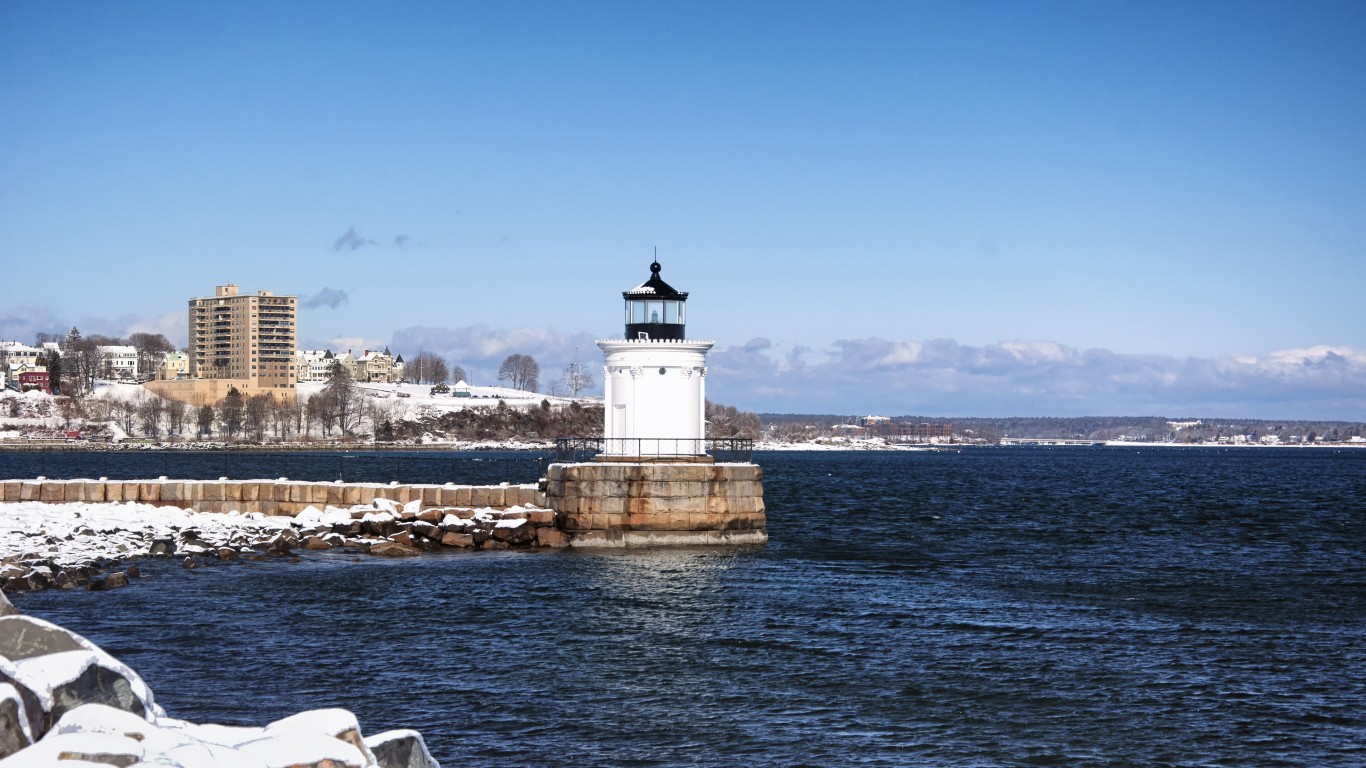
47. Portland-South Portland, ME
> Overall score (out of 100): 52.93
> Allergy risk rank (out of 125): 87
> Allergen severity rank (out of 125): 20
> Detection and treatment rank (out of 125): 58
> Population: 536,314
[in-text-ad-2]

46. San Antonio-New Braunfels, TX
> Overall score (out of 100): 52.99
> Allergy risk rank (out of 125): 12
> Allergen severity rank (out of 125): 104
> Detection and treatment rank (out of 125): 34
> Population: 2,510,211

45. Kansas City, MO-KS
> Overall score (out of 100): 53.19
> Allergy risk rank (out of 125): 58
> Allergen severity rank (out of 125): 30
> Detection and treatment rank (out of 125): 100
> Population: 2,144,129
[in-text-ad]

44. Shreveport-Bossier City, LA
> Overall score (out of 100): 53.23
> Allergy risk rank (out of 125): 20
> Allergen severity rank (out of 125): 60
> Detection and treatment rank (out of 125): 121
> Population: 397,590
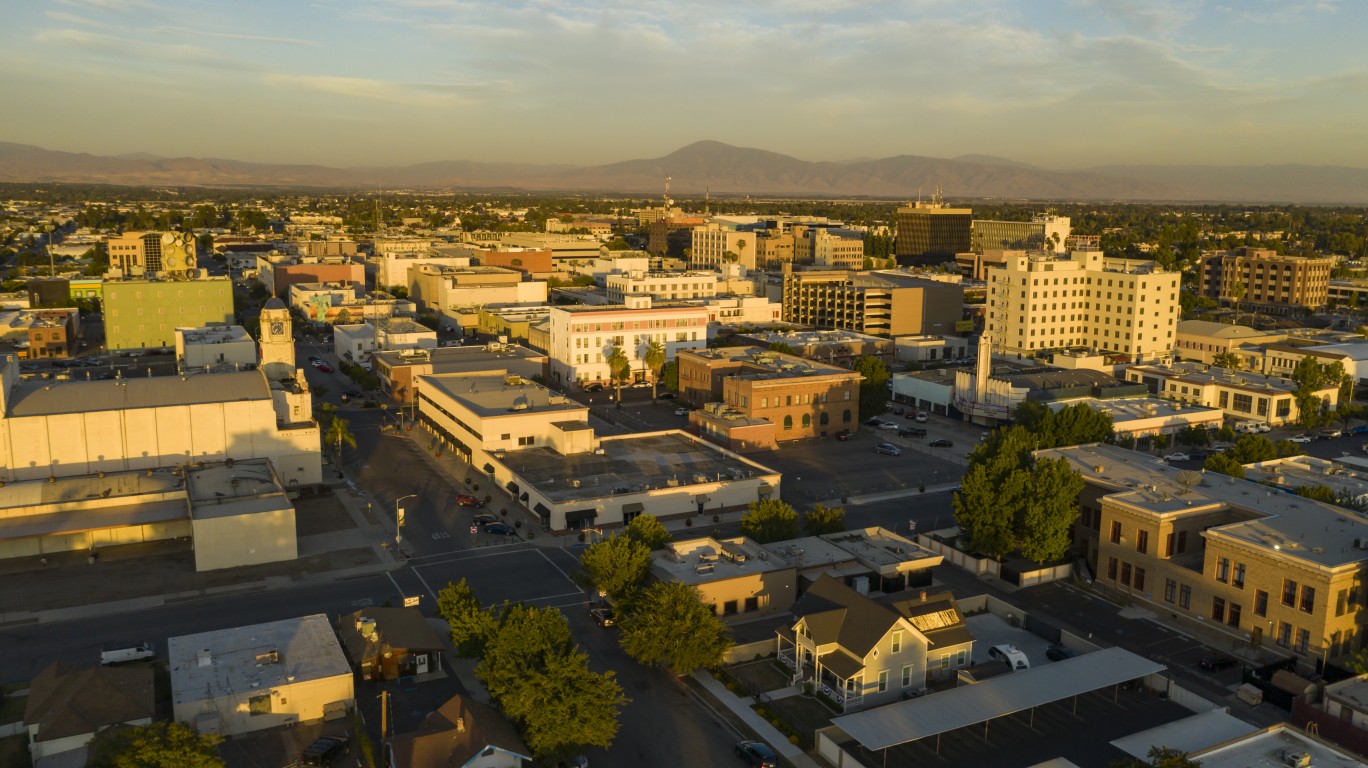
43. Bakersfield, CA
> Overall score (out of 100): 53.40
> Allergy risk rank (out of 125): 49
> Allergen severity rank (out of 125): 45
> Detection and treatment rank (out of 125): 68
> Population: 892,458
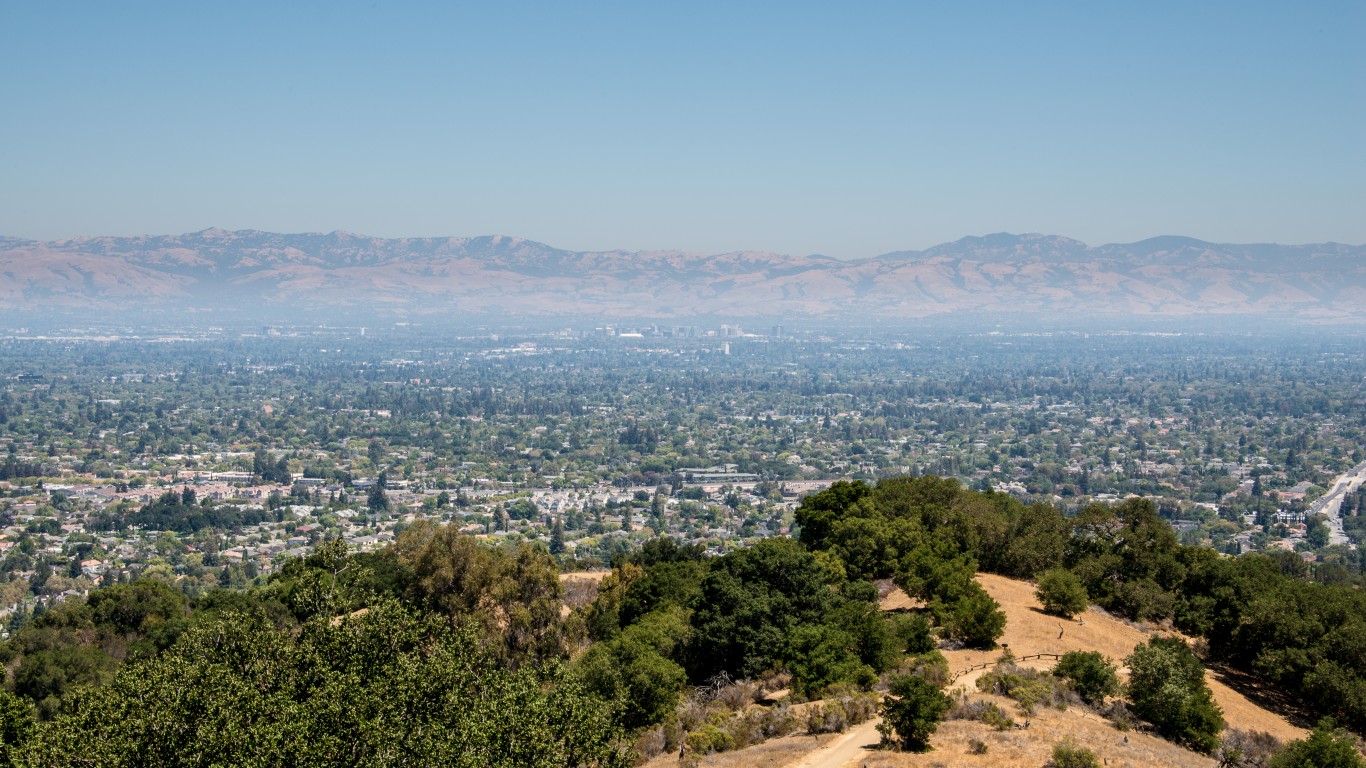
42. San Jose-Sunnyvale-Santa Clara, CA
> Overall score (out of 100): 53.48
> Allergy risk rank (out of 125): 22
> Allergen severity rank (out of 125): 70
> Detection and treatment rank (out of 125): 99
> Population: 1,985,926
[in-text-ad-2]
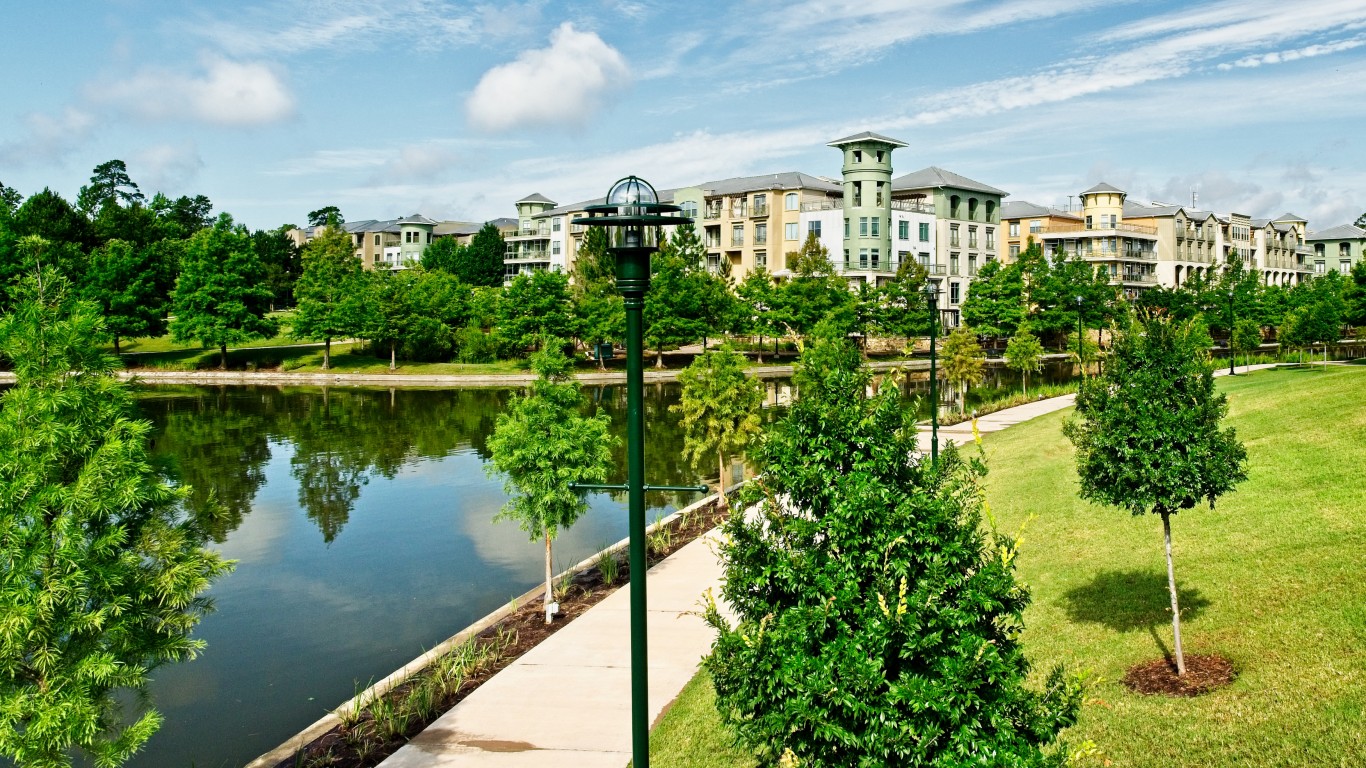
41. Houston-The Woodlands-Sugar Land, TX
> Overall score (out of 100): 53.58
> Allergy risk rank (out of 125): 14
> Allergen severity rank (out of 125): 99
> Detection and treatment rank (out of 125): 41
> Population: 6,979,613
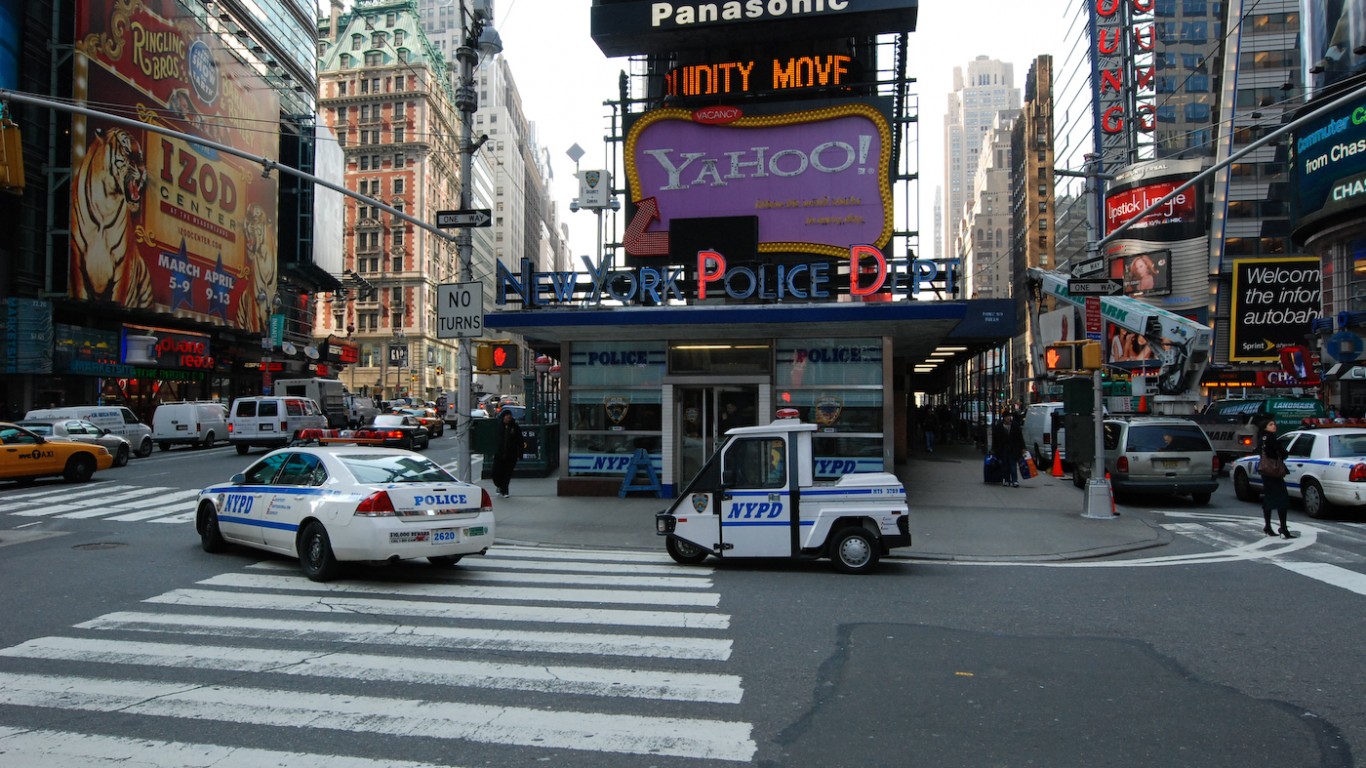
40. New York-Newark-Jersey City, NY-NJ-PA
> Overall score (out of 100): 54.21
> Allergy risk rank (out of 125): 23
> Allergen severity rank (out of 125): 67
> Detection and treatment rank (out of 125): 73
> Population: 19,261,570
[in-text-ad]

39. Cincinnati, OH-KY-IN
> Overall score (out of 100): 54.48
> Allergy risk rank (out of 125): 32
> Allergen severity rank (out of 125): 62
> Detection and treatment rank (out of 125): 62
> Population: 2,214,265

38. Greenville-Anderson, SC
> Overall score (out of 100): 54.84
> Allergy risk rank (out of 125): 28
> Allergen severity rank (out of 125): 71
> Detection and treatment rank (out of 125): 49
> Population: 908,680
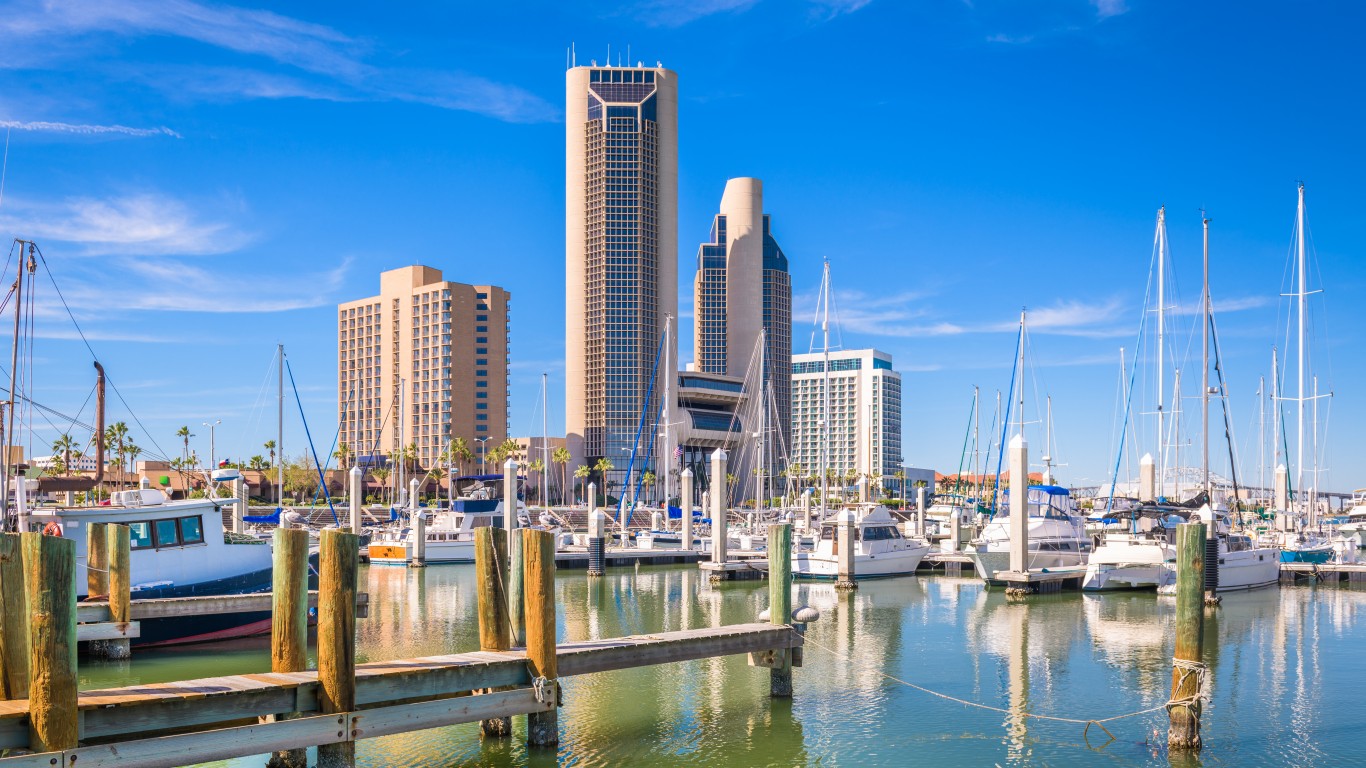
37. Corpus Christi, TX
> Overall score (out of 100): 55.08
> Allergy risk rank (out of 125): 1
> Allergen severity rank (out of 125): 120
> Detection and treatment rank (out of 125): 10
> Population: 429,120
[in-text-ad-2]

36. Stockton, CA
> Overall score (out of 100): 55.68
> Allergy risk rank (out of 125): 13
> Allergen severity rank (out of 125): 97
> Detection and treatment rank (out of 125): 14
> Population: 751,615

35. Baltimore-Columbia-Towson, MD
> Overall score (out of 100): 55.73
> Allergy risk rank (out of 125): 9
> Allergen severity rank (out of 125): 86
> Detection and treatment rank (out of 125): 109
> Population: 2,800,427
[in-text-ad]

34. San Francisco-Oakland-Berkeley, CA
> Overall score (out of 100): 55.73
> Allergy risk rank (out of 125): 30
> Allergen severity rank (out of 125): 50
> Detection and treatment rank (out of 125): 94
> Population: 4,709,220

33. Akron, OH
> Overall score (out of 100): 55.94
> Allergy risk rank (out of 125): 53
> Allergen severity rank (out of 125): 22
> Detection and treatment rank (out of 125): 85
> Population: 703,286

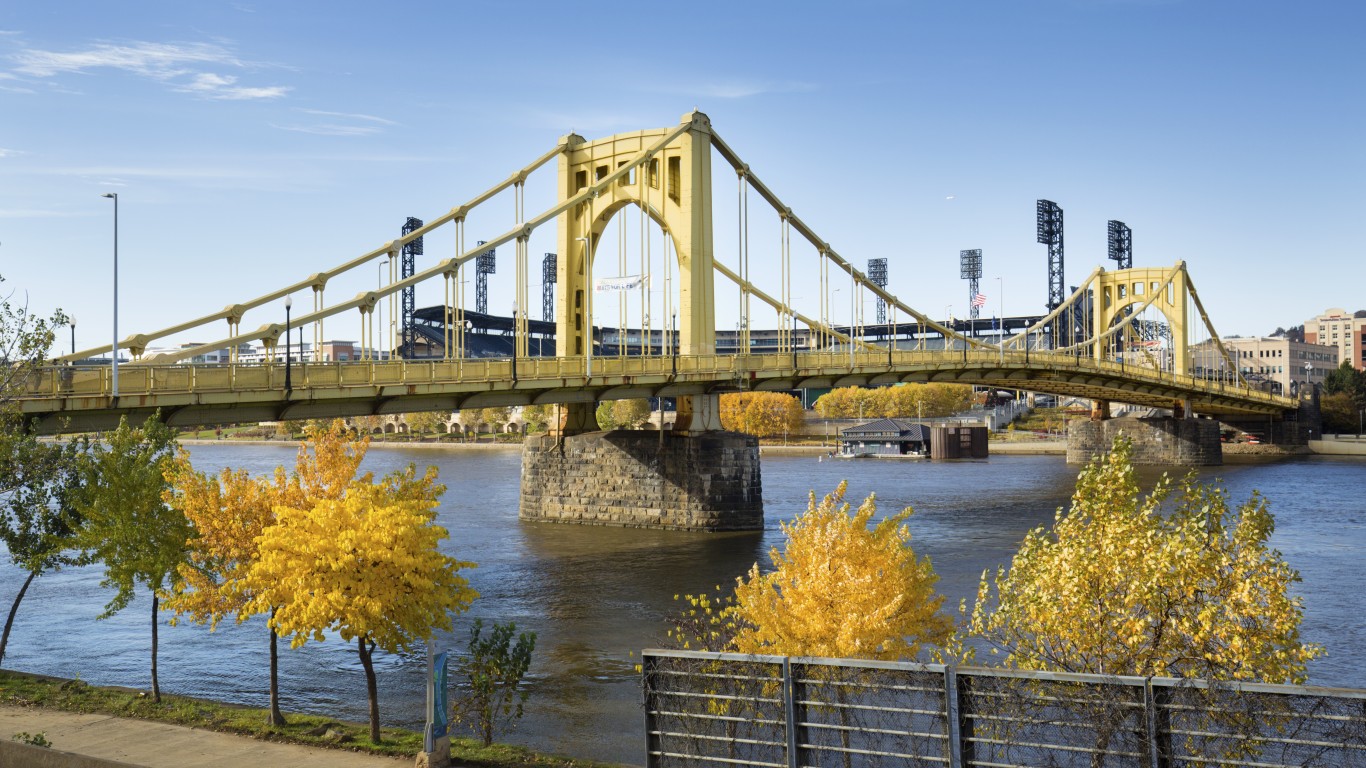
32. Pittsburgh, PA
> Overall score (out of 100): 56.07
> Allergy risk rank (out of 125): 55
> Allergen severity rank (out of 125): 17
> Detection and treatment rank (out of 125): 96
> Population: 2,324,447
[in-text-ad-2]

31. Chicago-Naperville-Elgin, IL-IN-WI
> Overall score (out of 100): 56.17
> Allergy risk rank (out of 125): 81
> Allergen severity rank (out of 125): 5
> Detection and treatment rank (out of 125): 113
> Population: 9,478,801

30. Spokane-Spokane Valley, WA
> Overall score (out of 100): 56.26
> Allergy risk rank (out of 125): 25
> Allergen severity rank (out of 125): 53
> Detection and treatment rank (out of 125): 91
> Population: 558,635
[in-text-ad]

29. Boise City, ID
> Overall score (out of 100): 56.38
> Allergy risk rank (out of 125): 27
> Allergen severity rank (out of 125): 59
> Detection and treatment rank (out of 125): 55
> Population: 730,483

28. Manchester-Nashua, NH
> Overall score (out of 100): 56.78
> Allergy risk rank (out of 125): 47
> Allergen severity rank (out of 125): 16
> Detection and treatment rank (out of 125): 118
> Population: 415,305
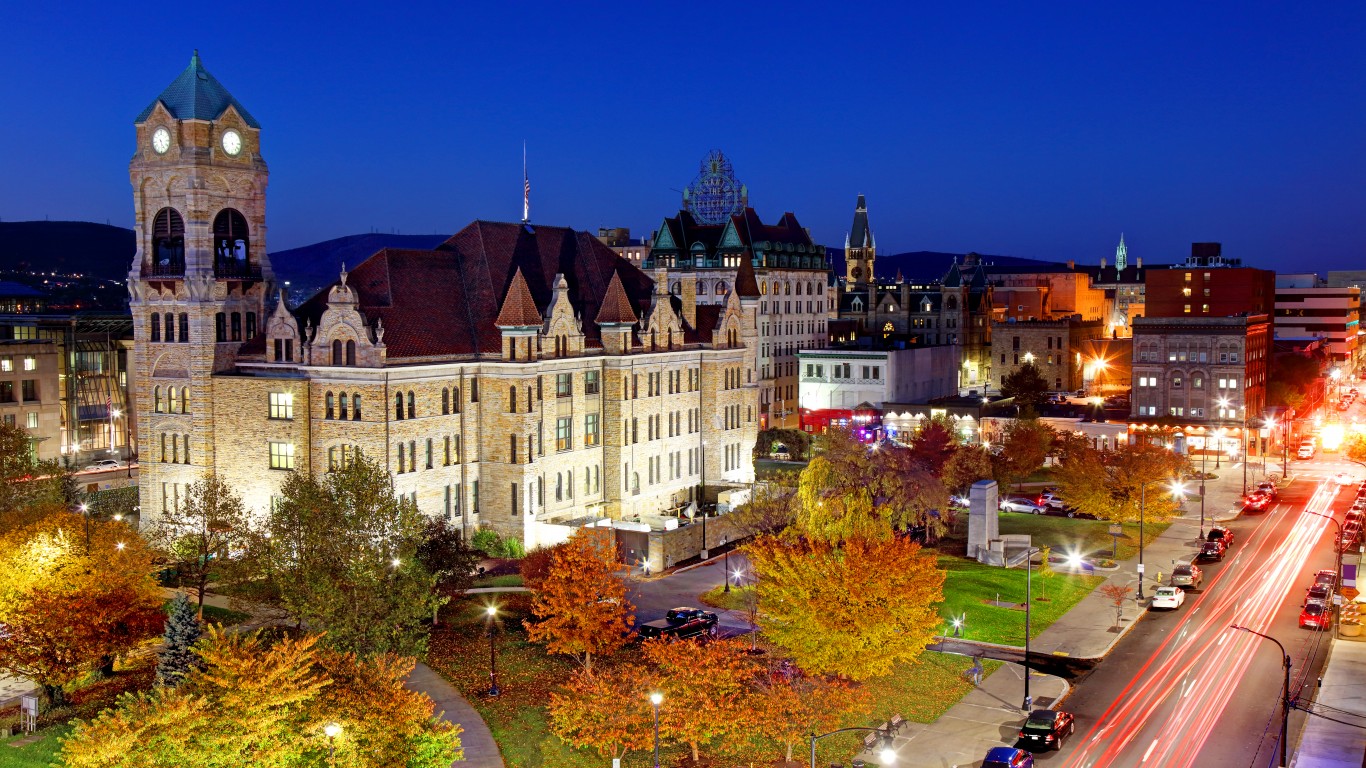
27. Scranton-Wilkes-Barre, PA
> Overall score (out of 100): 56.99
> Allergy risk rank (out of 125): 60
> Allergen severity rank (out of 125): 28
> Detection and treatment rank (out of 125): 46
> Population: 554,787
[in-text-ad-2]
26. Reading, PA
> Overall score (out of 100): 57.45
> Allergy risk rank (out of 125): 83
> Allergen severity rank (out of 125): 10
> Detection and treatment rank (out of 125): 67
> Population: 419,062

25. Knoxville, TN
> Overall score (out of 100): 57.49
> Allergy risk rank (out of 125): 52
> Allergen severity rank (out of 125): 12
> Detection and treatment rank (out of 125): 106
> Population: 861,872
[in-text-ad]

24. Memphis, TN-MS-AR
> Overall score (out of 100): 57.65
> Allergy risk rank (out of 125): 34
> Allergen severity rank (out of 125): 44
> Detection and treatment rank (out of 125): 53
> Population: 1,343,150

23. Providence-Warwick, RI-MA
> Overall score (out of 100): 58.43
> Allergy risk rank (out of 125): 46
> Allergen severity rank (out of 125): 23
> Detection and treatment rank (out of 125): 65
> Population: 1,621,099

22. Columbus, OH
> Overall score (out of 100): 58.51
> Allergy risk rank (out of 125): 37
> Allergen severity rank (out of 125): 25
> Detection and treatment rank (out of 125): 93
> Population: 2,101,543
[in-text-ad-2]

21. Harrisburg-Carlisle, PA
> Overall score (out of 100): 58.61
> Allergy risk rank (out of 125): 31
> Allergen severity rank (out of 125): 37
> Detection and treatment rank (out of 125): 74
> Population: 574,691

20. Boston-Cambridge-Newton, MA-NH
> Overall score (out of 100): 59.55
> Allergy risk rank (out of 125): 62
> Allergen severity rank (out of 125): 3
> Detection and treatment rank (out of 125): 112
> Population: 4,854,808
[in-text-ad]

19. Sacramento-Roseville-Folsom, CA
> Overall score (out of 100): 59.65
> Allergy risk rank (out of 125): 15
> Allergen severity rank (out of 125): 51
> Detection and treatment rank (out of 125): 102
> Population: 2,338,866
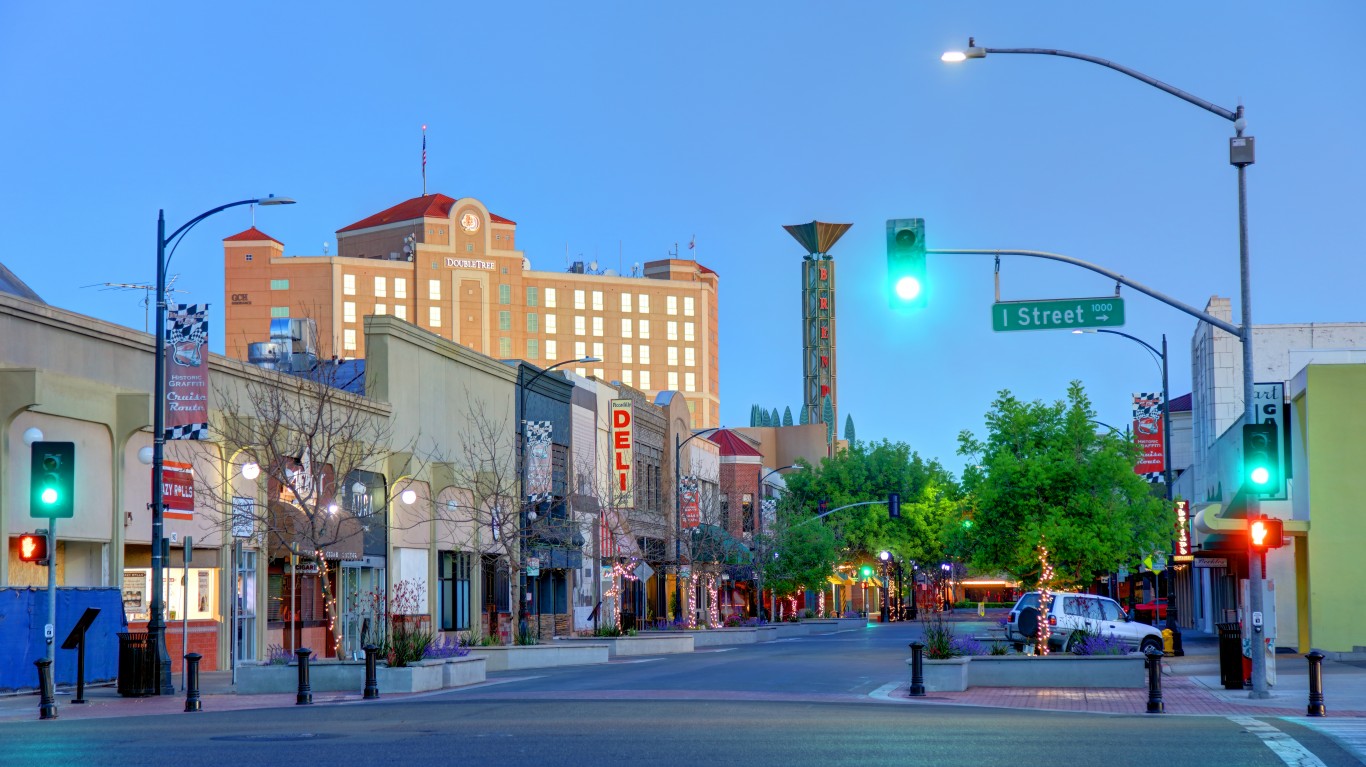
18. Modesto, CA
> Overall score (out of 100): 60.02
> Allergy risk rank (out of 125): 7
> Allergen severity rank (out of 125): 92
> Detection and treatment rank (out of 125): 21
> Population: 546,235

17. Cleveland-Elyria, OH
> Overall score (out of 100): 60.43
> Allergy risk rank (out of 125): 40
> Allergen severity rank (out of 125): 10
> Detection and treatment rank (out of 125): 104
> Population: 2,053,137
[in-text-ad-2]

16. Virginia Beach-Norfolk-Newport News, VA-NC
> Overall score (out of 100): 60.62
> Allergy risk rank (out of 125): 5
> Allergen severity rank (out of 125): 81
> Detection and treatment rank (out of 125): 63
> Population: 1,768,956

15. Worcester, MA-CT
> Overall score (out of 100): 61.03
> Allergy risk rank (out of 125): 59
> Allergen severity rank (out of 125): 4
> Detection and treatment rank (out of 125): 81
> Population: 943,312
[in-text-ad]
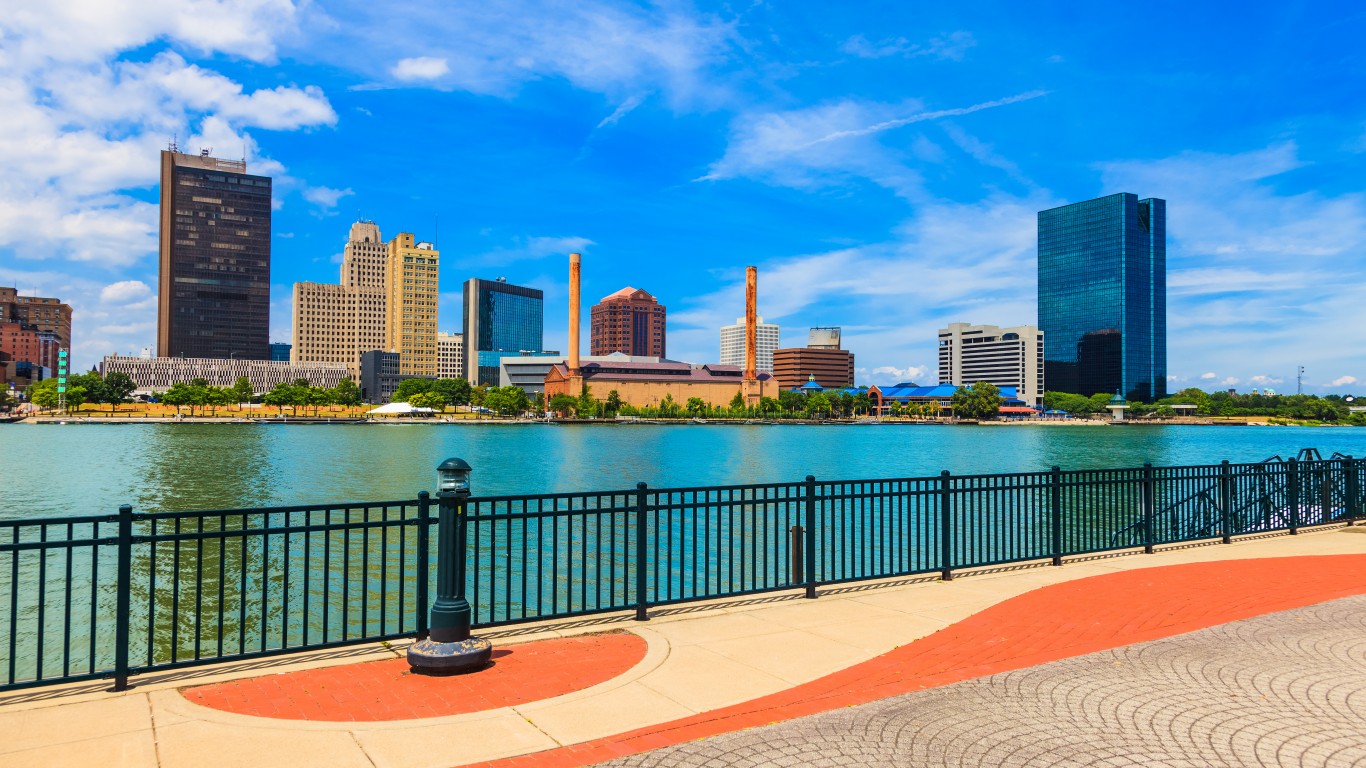
14. Toledo, OH
> Overall score (out of 100): 61.60
> Allergy risk rank (out of 125): 29
> Allergen severity rank (out of 125): 26
> Detection and treatment rank (out of 125): 54
> Population: 643,724

13. Washington-Arlington-Alexandria, DC-VA-MD-WV
> Overall score (out of 100): 62.13
> Allergy risk rank (out of 125): 11
> Allergen severity rank (out of 125): 49
> Detection and treatment rank (out of 125): 77
> Population: 6,250,309

12. Bridgeport-Stamford-Norwalk, CT
> Overall score (out of 100): 62.21
> Allergy risk rank (out of 125): 41
> Allergen severity rank (out of 125): 2
> Detection and treatment rank (out of 125): 122
> Population: 944,306
[in-text-ad-2]
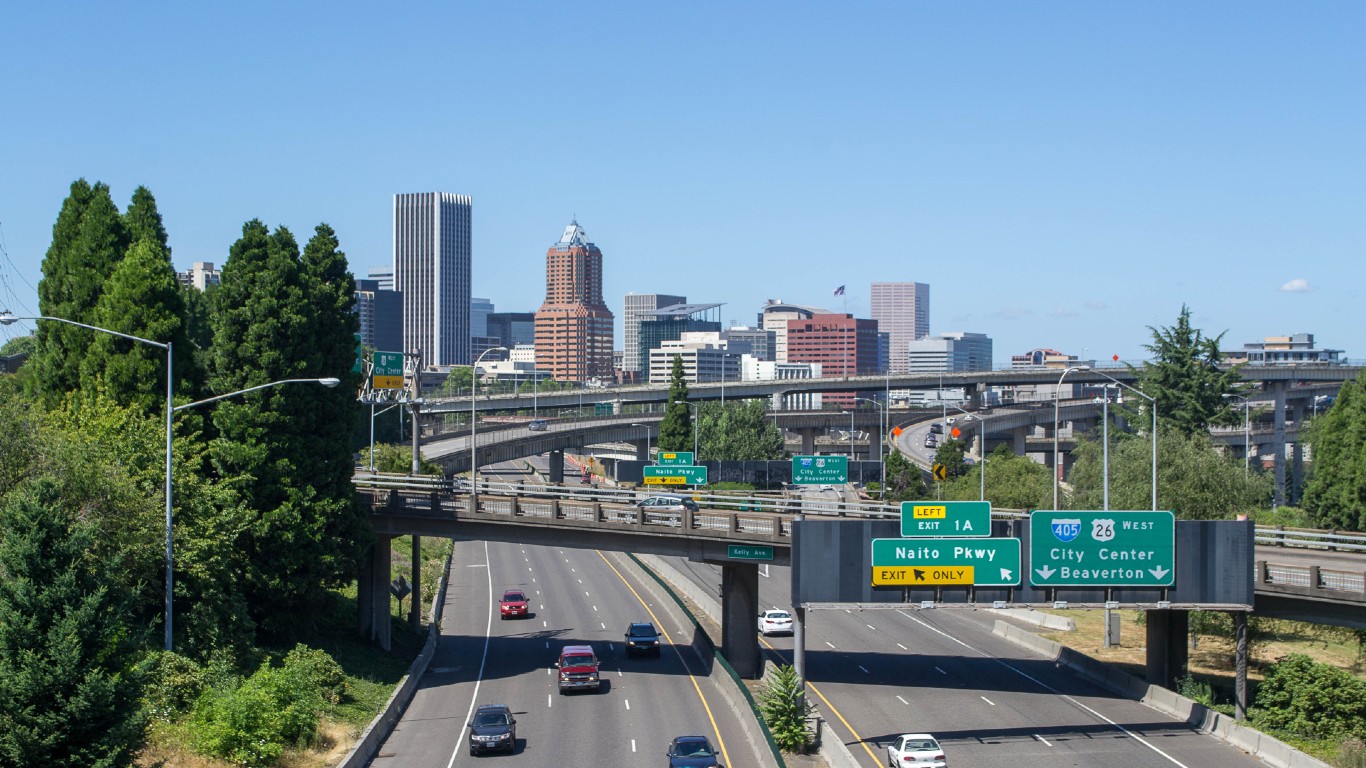
11. Portland-Vancouver-Hillsboro, OR-WA
> Overall score (out of 100): 62.39
> Allergy risk rank (out of 125): 3
> Allergen severity rank (out of 125): 75
> Detection and treatment rank (out of 125): 83
> Population: 2,472,774

10. Wichita, KS
> Overall score (out of 100): 63.58
> Allergy risk rank (out of 125): 6
> Allergen severity rank (out of 125): 80
> Detection and treatment rank (out of 125): 13
> Population: 639,668
[in-text-ad]
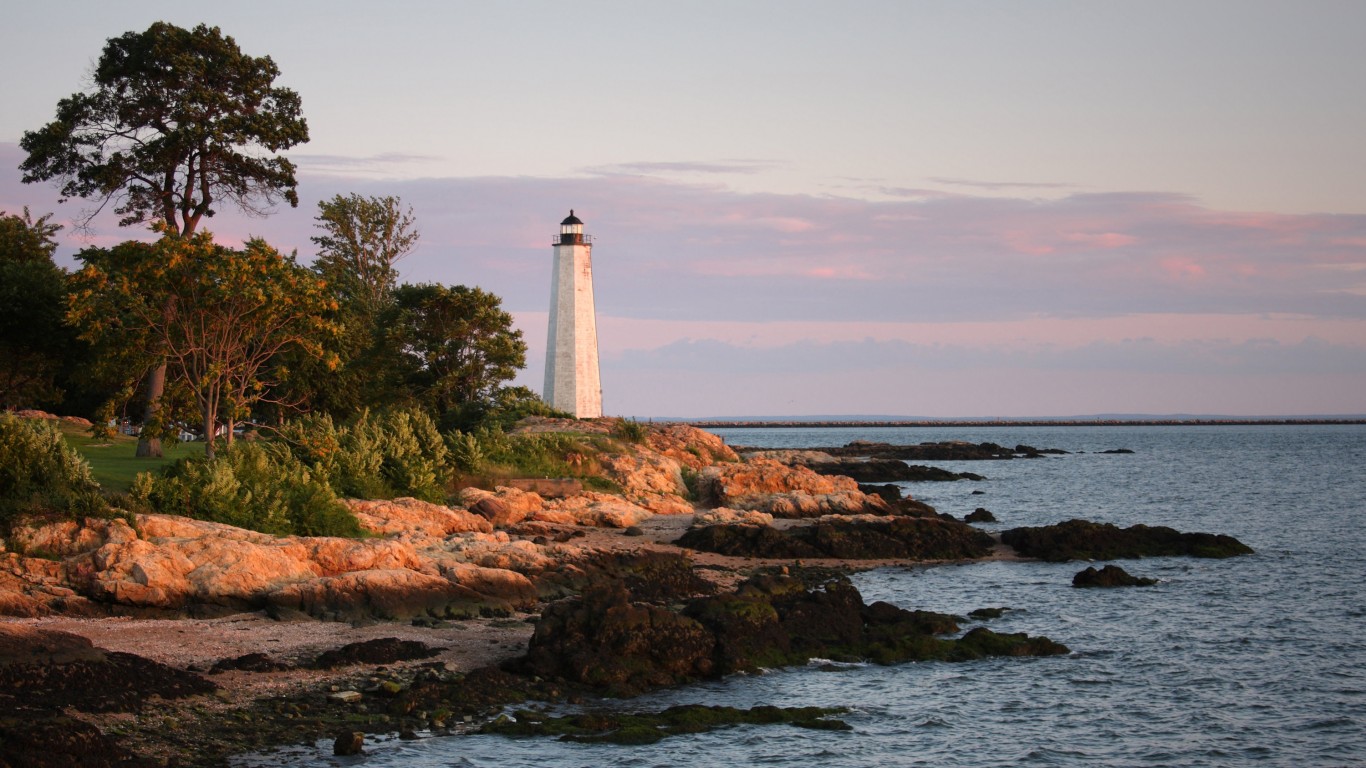
9. New Haven-Milford, CT
> Overall score (out of 100): 63.90
> Allergy risk rank (out of 125): 66
> Allergen severity rank (out of 125): 1
> Detection and treatment rank (out of 125): 98
> Population: 855,733
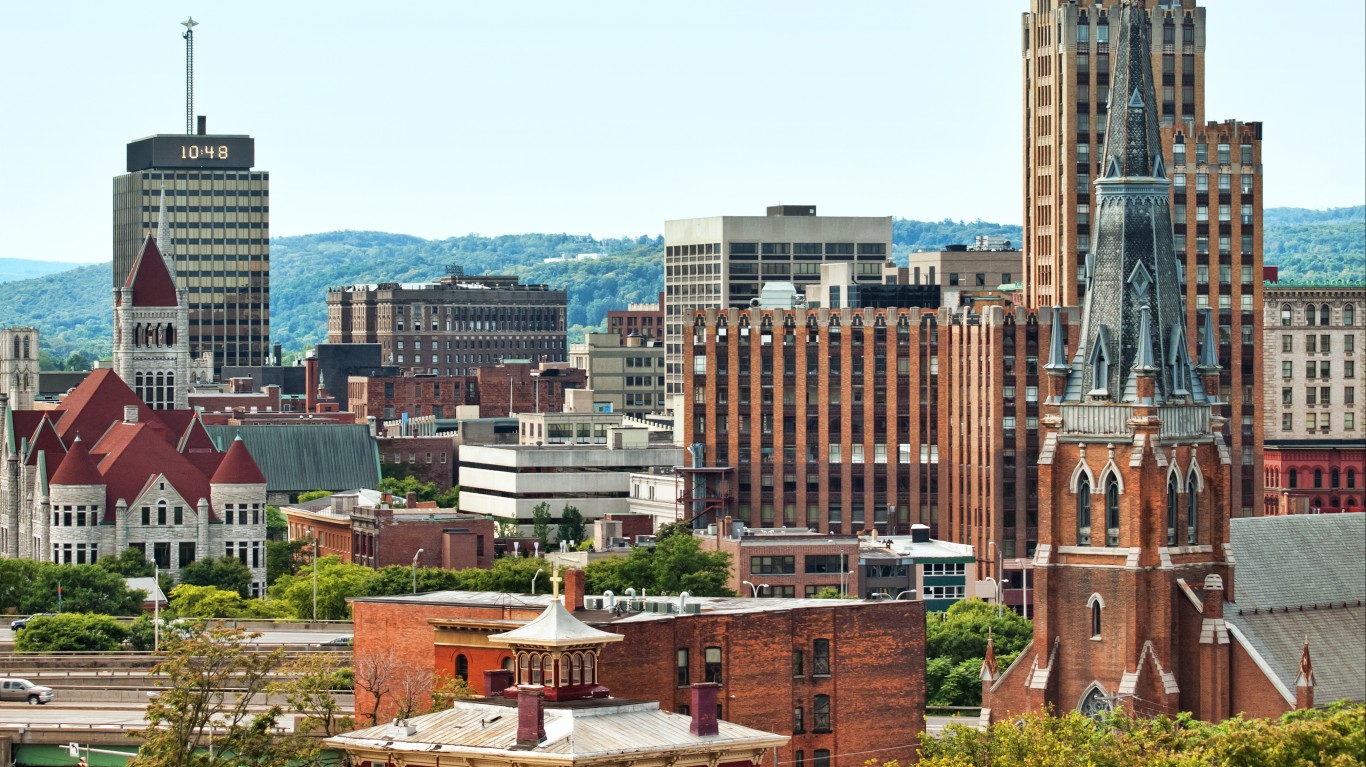
8. Syracuse, NY
> Overall score (out of 100): 64.50
> Allergy risk rank (out of 125): 33
> Allergen severity rank (out of 125): 9
> Detection and treatment rank (out of 125): 58
> Population: 650,211

7. Philadelphia-Camden-Wilmington, PA-NJ-DE-MD
> Overall score (out of 100): 64.81
> Allergy risk rank (out of 125): 21
> Allergen severity rank (out of 125): 8
> Detection and treatment rank (out of 125): 107
> Population: 6,092,403
[in-text-ad-2]
6. Santa Rosa-Petaluma, CA
> Overall score (out of 100): 64.87
> Allergy risk rank (out of 125): 24
> Allergen severity rank (out of 125): 7
> Detection and treatment rank (out of 125): 103
> Population: 496,801
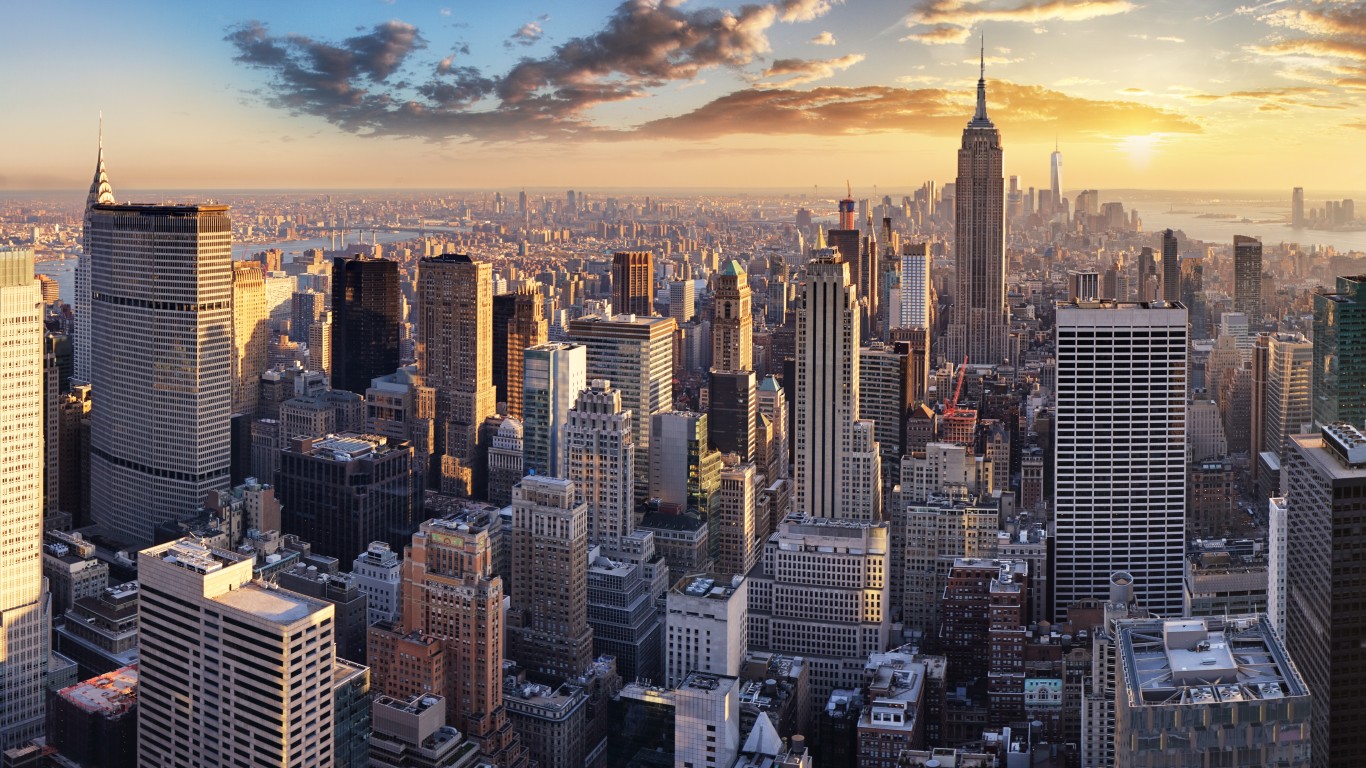
5. Buffalo-Cheektowaga, NY
> Overall score (out of 100): 65.35
> Allergy risk rank (out of 125): 18
> Allergen severity rank (out of 125): 15
> Detection and treatment rank (out of 125): 76
> Population: 1,129,018
[in-text-ad]
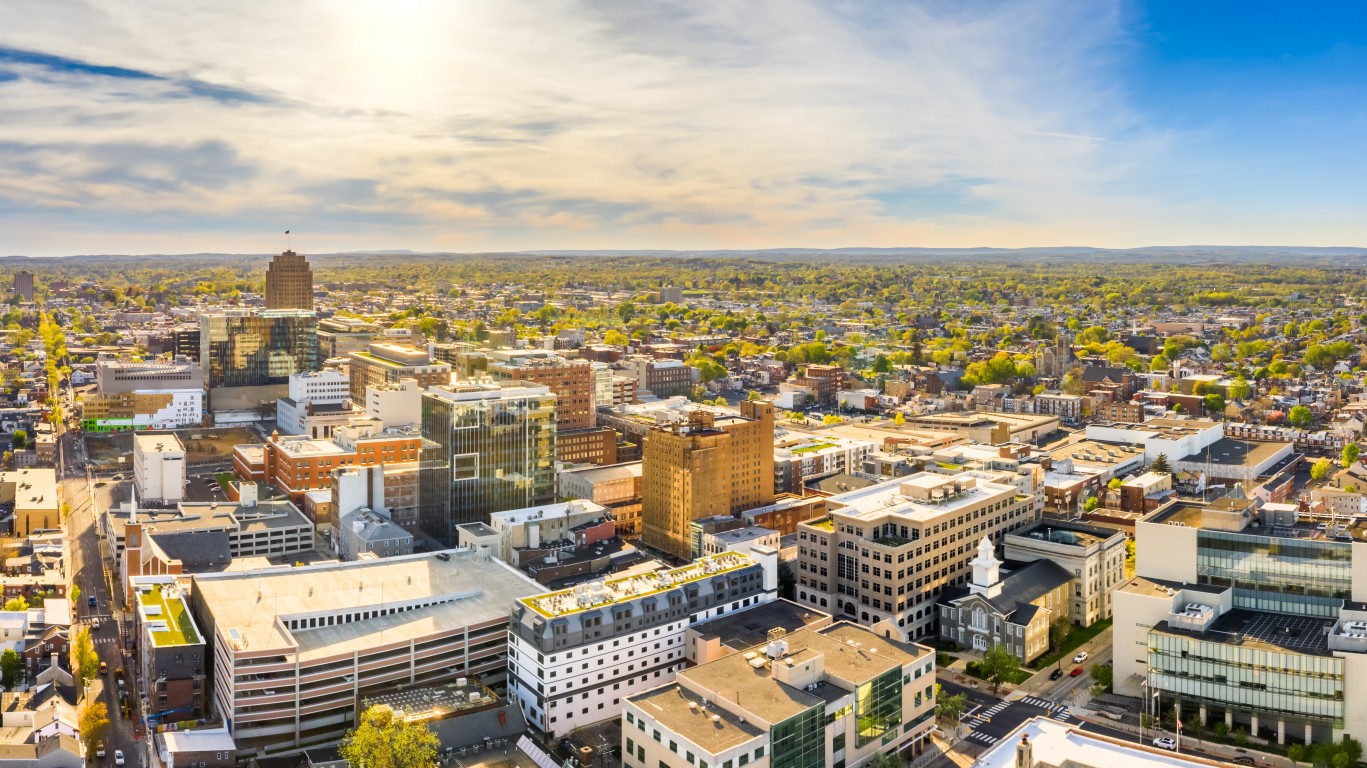
4. Allentown-Bethlehem-Easton, PA-NJ
> Overall score (out of 100): 66.35
> Allergy risk rank (out of 125): 16
> Allergen severity rank (out of 125): 13
> Detection and treatment rank (out of 125): 101
> Population: 841,265
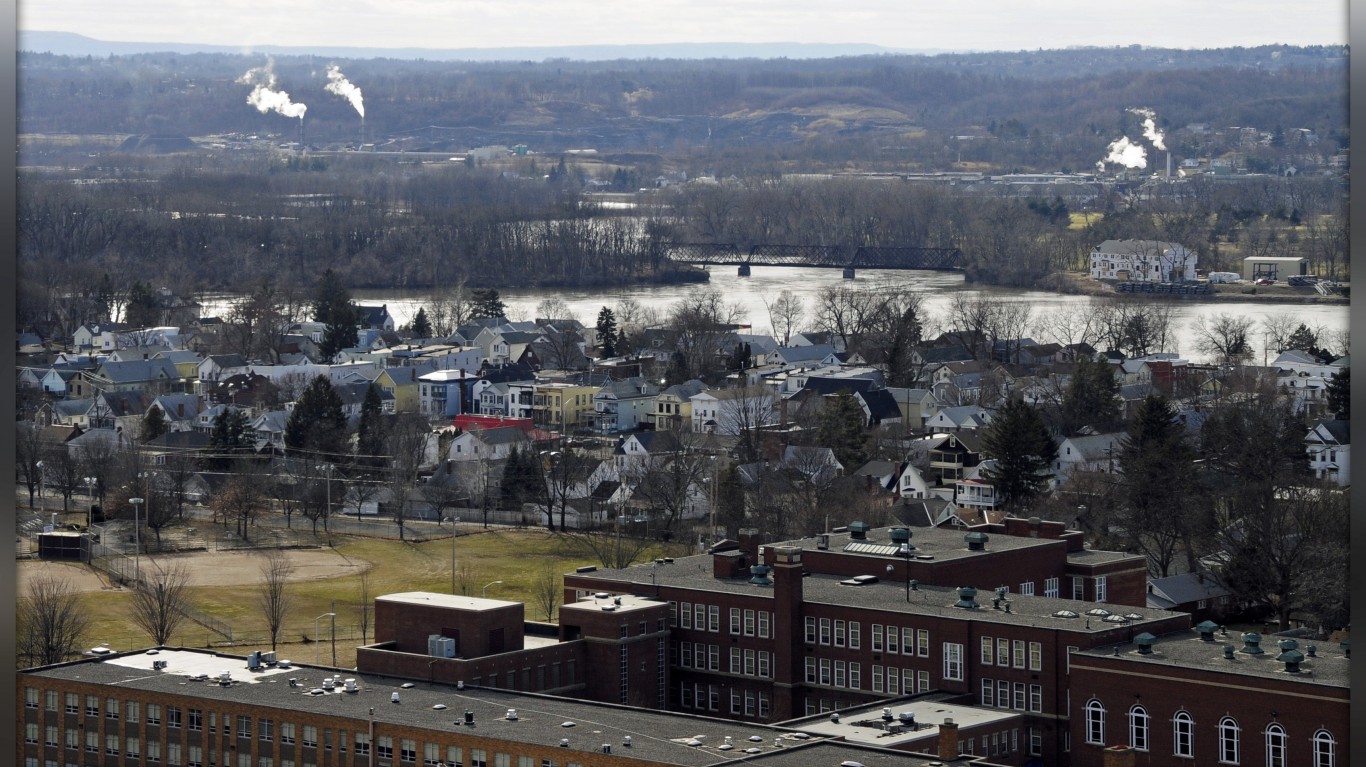
3. Albany-Schenectady-Troy, NY
> Overall score (out of 100): 69.58
> Allergy risk rank (out of 125): 2
> Allergen severity rank (out of 125): 19
> Detection and treatment rank (out of 125): 117
> Population: 880,766

2. Hartford-East Hartford-Middletown, CT
> Overall score (out of 100): 69.95
> Allergy risk rank (out of 125): 10
> Allergen severity rank (out of 125): 14
> Detection and treatment rank (out of 125): 69
> Population: 1,205,842
[in-text-ad-2]

1. Lancaster, PA
> Overall score (out of 100): 70.13
> Allergy risk rank (out of 125): 19
> Allergen severity rank (out of 125): 6
> Detection and treatment rank (out of 125): 65
> Population: 543,050
Methodology
To identify the 50 worst cities or metropolitan areas for grass allergies, 24/7 Tempo reviewed the 2022’s Worst Cities for Grass Allergies This Summer published by lawn care services company Lawn Love. Lawn Love ranked 125 metropolitan areas, assigning each an overall score out of 100 points – a weighted average of metrics that measure allergy risk, allergen severity, and quality of detection and treatment. The site sourced data from the American Academy of Allergy, Asthma & Immunology; Lawn Love; Pollen.com; and Urban Adaptation Assessment.
Allergy risk includes average forecast grass pollen index (May-August 2022), historical average mow frequency, and average climate change score. Allergen severity includes average number of significant grass allergens, average number of overall grass allergens, and average number of mild grass allergens. Detection and treatment includes the number of available allergy tests for grass allergen and the population of allergists and immunologists per 100,000 residents.
Lawn Love “selected the metro areas based on their need for lawn mowing and therefore residents’ susceptibility to grass allergies.” Data was collected for each “principal city” that makes up the MSA, with some data based on internal customer data for the period between May and August 2021. Population data came from the U.S. Census Bureau 2020 American Community Survey and is a five-year average.
It’s Your Money, Your Future—Own It (sponsor)
Retirement can be daunting, but it doesn’t need to be.
Imagine having an expert in your corner to help you with your financial goals. Someone to help you determine if you’re ahead, behind, or right on track. With SmartAsset, that’s not just a dream—it’s reality. This free tool connects you with pre-screened financial advisors who work in your best interests. It’s quick, it’s easy, so take the leap today and start planning smarter!
Don’t waste another minute; get started right here and help your retirement dreams become a retirement reality.
Thank you for reading! Have some feedback for us?
Contact the 24/7 Wall St. editorial team.
 24/7 Wall St.
 24/7 Wall St.
 24/7 Wall St.
 24/7 Wall St.