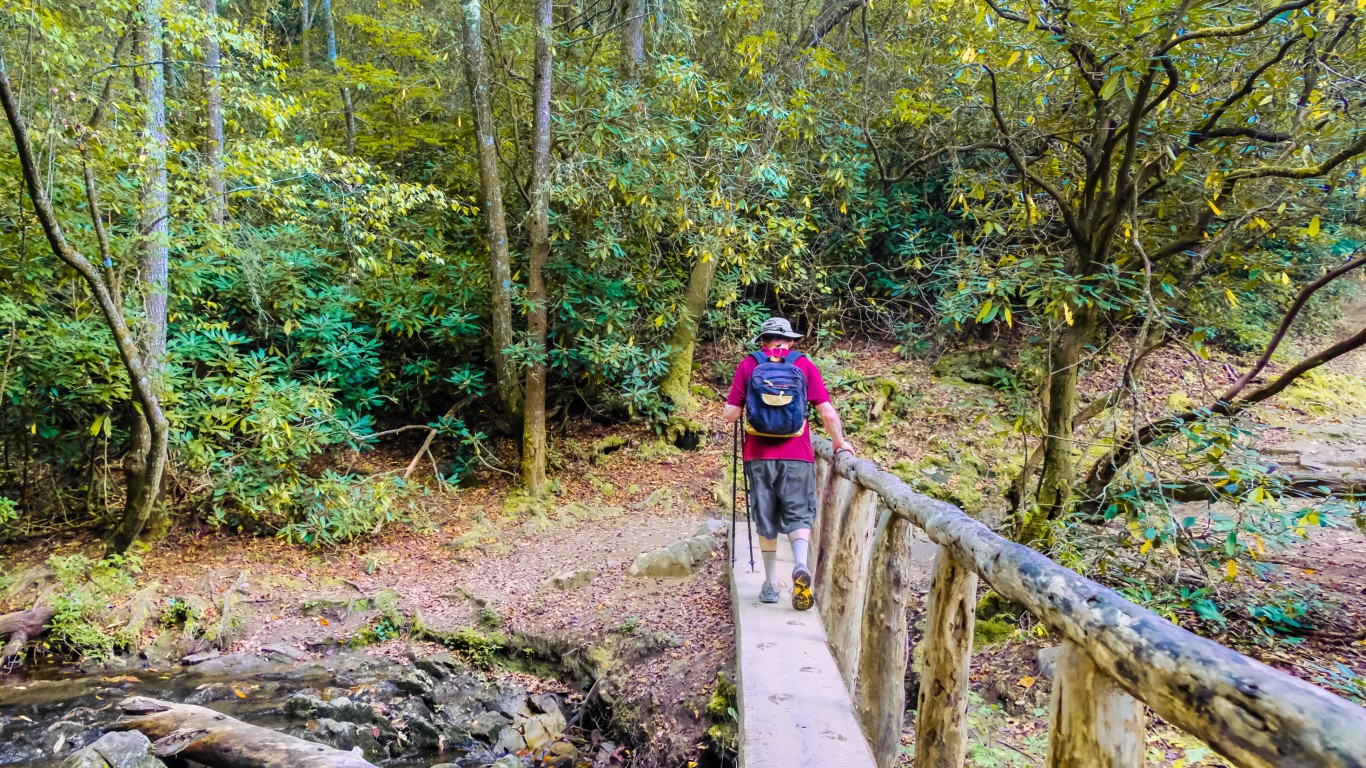
In 2020, COVID-19 shut down facilities in most of America’s National Parks and National Preserves, with visits falling by about a third overall compared to 2019. The good news is that in 2021, the parks rebounded, enjoying some 297.1 million visits – an increase of 25% or 60 million over 2020.
While this increase is encouraging, however, it was uneven. Though some of the best-known parks had record visitation in 2021, numbers across the entire National Park System remained below pre-pandemic totals. Of the 423 parks in the National Park System, just 25 received more than 50% of the system’s total recreation visits in 2021. What this summer holds for the parks in another question. Beyond the lingering effects of the pandemic, visits will doubtless be limited by the soaring cost of gasoline. (Things could be worse. These are the countries with the worst inflation in the world.)
The National Parks suggests park visitors create what they call a circle of discovery to explore lesser-visited locations while on an excursion at a more well-known park. For example, a visit to Redwoods State and National Parks offers an opportunity to explore Whiskeytown National Recreation Area and Oregon Caves National Monument and Preserve. If you plan on taking a trip to Great Smoky Mountains National Park, consider visiting Cumberland Gap National Historical Park or Little River Canyon National Preserve – the latter of which posted the biggest visit increase over five years of any park on the list. (These are the National Parks that have grown most in popularity since 1980.)
To identify the most popular national parks in 2021, 24/7 Tempo reviewed the record of last year’s recreational visits published in the National Park Service’s annual visitation report, as well as National ParkS data for visits in 2017. The National ParkS aggregates visitation data for various government land designations and visitation purposes. Only National Parks and National Preserves were considered. Designations such as National Monuments and National Historic Sites, which are frequently contained within National Parks and are often limited to single structures, were excluded. Parks that changed their reporting practices were not comparable to previous years, and therefore were also excluded.
Click here to see America’s most visited National Parks in 2021
The top five most-visited national parks are ones Americans are most familiar with – Zion, Yellowstone, Grand Canyon, Rocky Mountain, and Grand Teton – but a number of others saw significant numbers of visits, too.
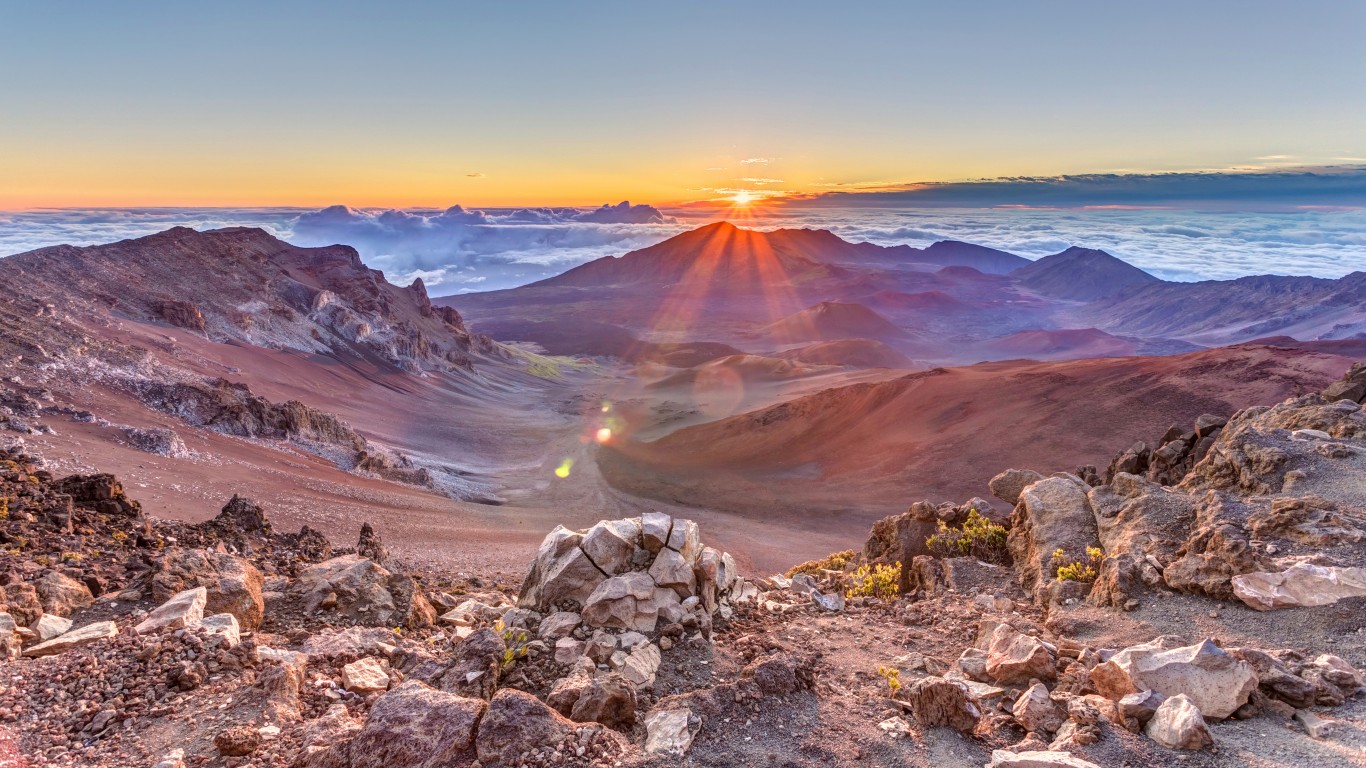
25. Haleakala National Park
> Recreation visits in 2021: 853,181
> Share of all National Park recreation visits in 2021: 0.29% — #25 largest out of 52
> Recreation visits in 2017: 1,112,390 — #21 most
> Share of all National Park recreation visits in 2017: 0.34% — #21 most
> 5-year change in visits -23.3% — #10 largest decline
[in-text-ad]
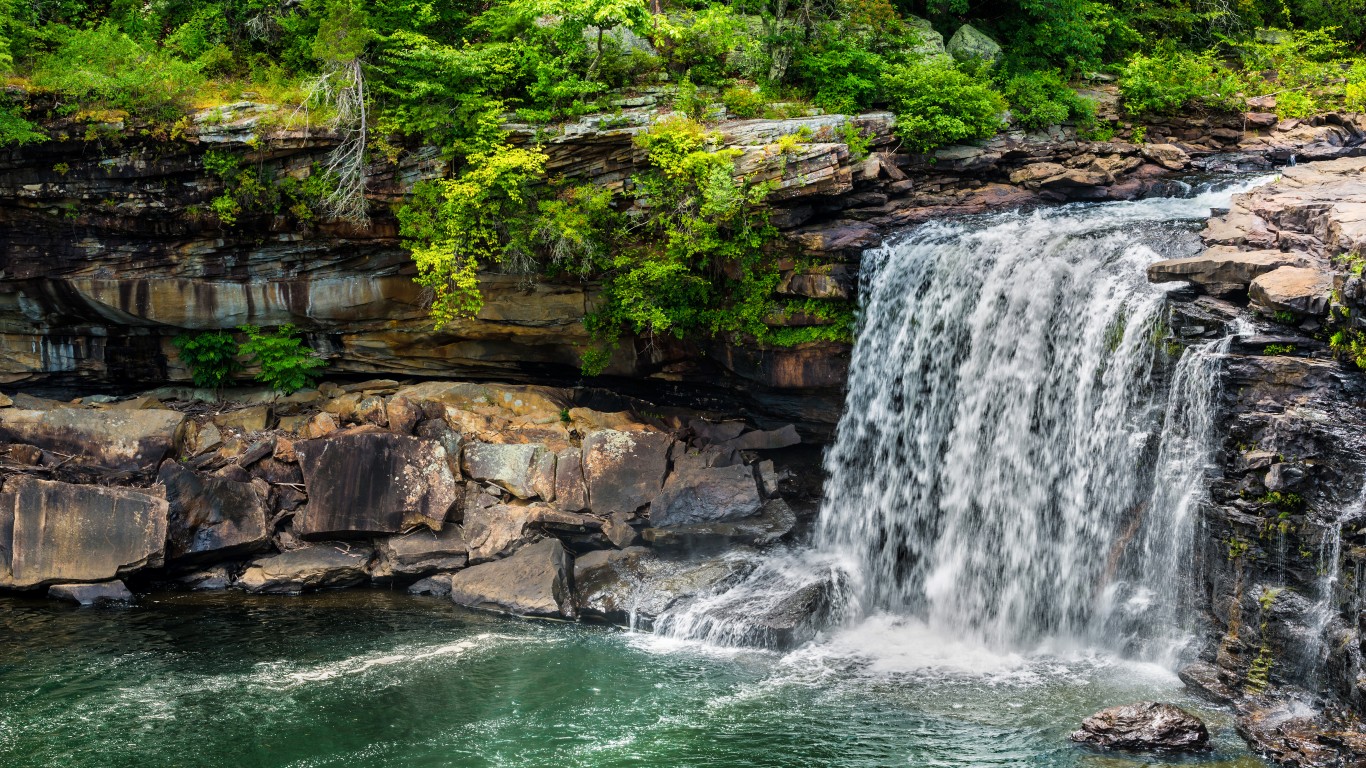
24. Little River Canyon National Preserve
> Recreation visits in 2021: 862,606
> Share of all National Park recreation visits in 2021: 0.29% — #24 largest out of 52
> Recreation visits in 2017: 367,058 — #37 most
> Share of all National Park recreation visits in 2017: 0.11% — #37 most
> 5-year change in visits 135.0% — #1 largest increase
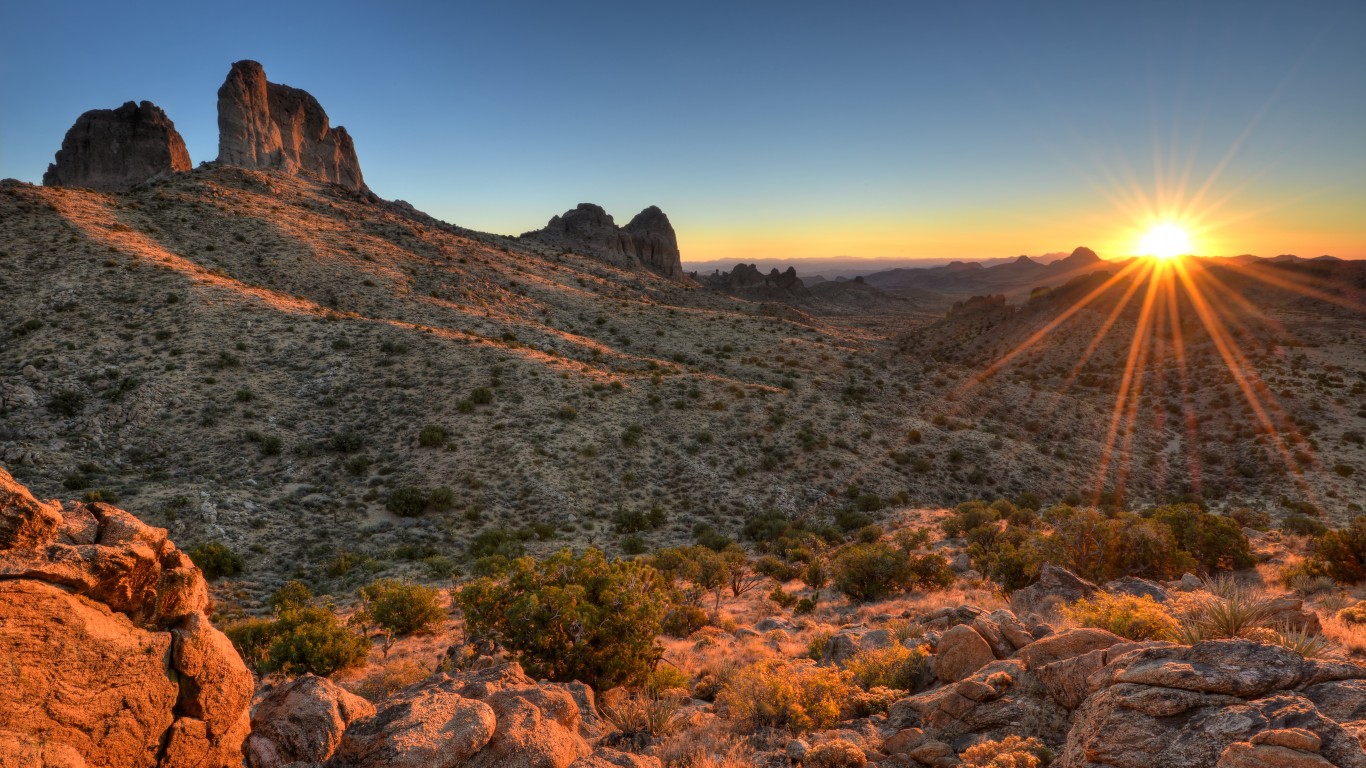
23. Mojave National Preserve
> Recreation visits in 2021: 866,635
> Share of all National Park recreation visits in 2021: 0.29% — #23 largest out of 52
> Recreation visits in 2017: 716,604 — #24 most
> Share of all National Park recreation visits in 2017: 0.22% — #24 most
> 5-year change in visits 20.9% — #12 largest increase
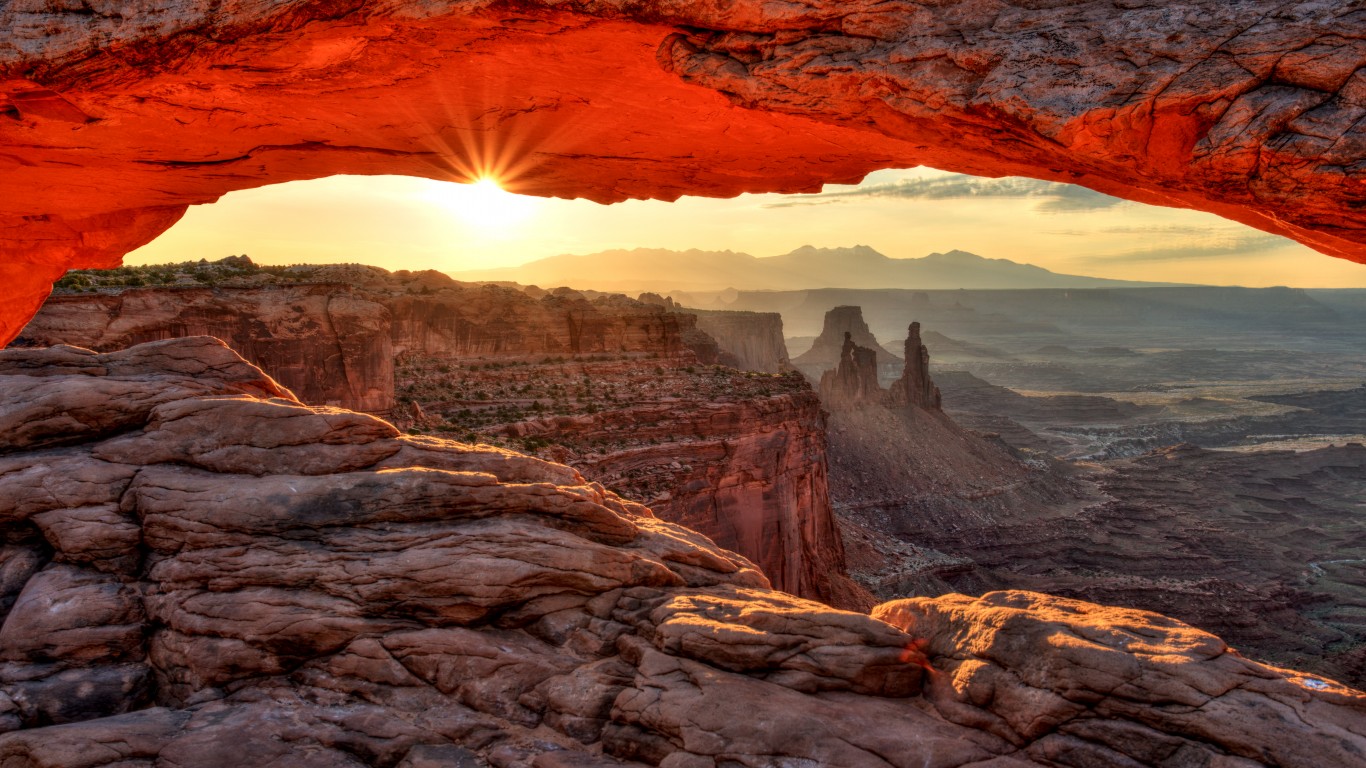
22. Canyonlands National Park
> Recreation visits in 2021: 911,594
> Share of all National Park recreation visits in 2021: 0.31% — #22 largest out of 52
> Recreation visits in 2017: 742,271 — #23 most
> Share of all National Park recreation visits in 2017: 0.22% — #23 most
> 5-year change in visits 22.8% — #10 largest increase
[in-text-ad-2]
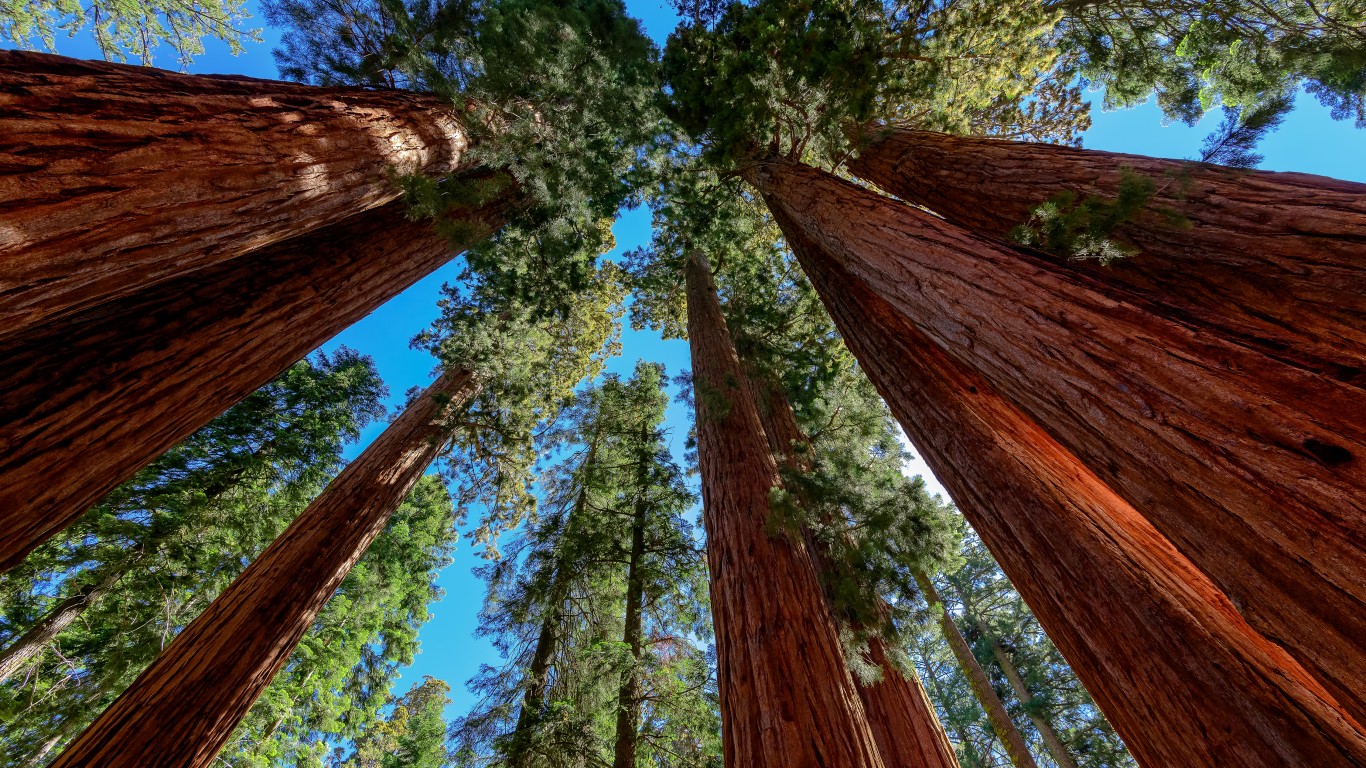
21. Sequoia National Park
> Recreation visits in 2021: 1,059,548
> Share of all National Park recreation visits in 2021: 0.36% — #21 largest out of 52
> Recreation visits in 2017: 1,291,256 — #19 most
> Share of all National Park recreation visits in 2017: 0.39% — #19 most
> 5-year change in visits -17.9% — #14 largest decline
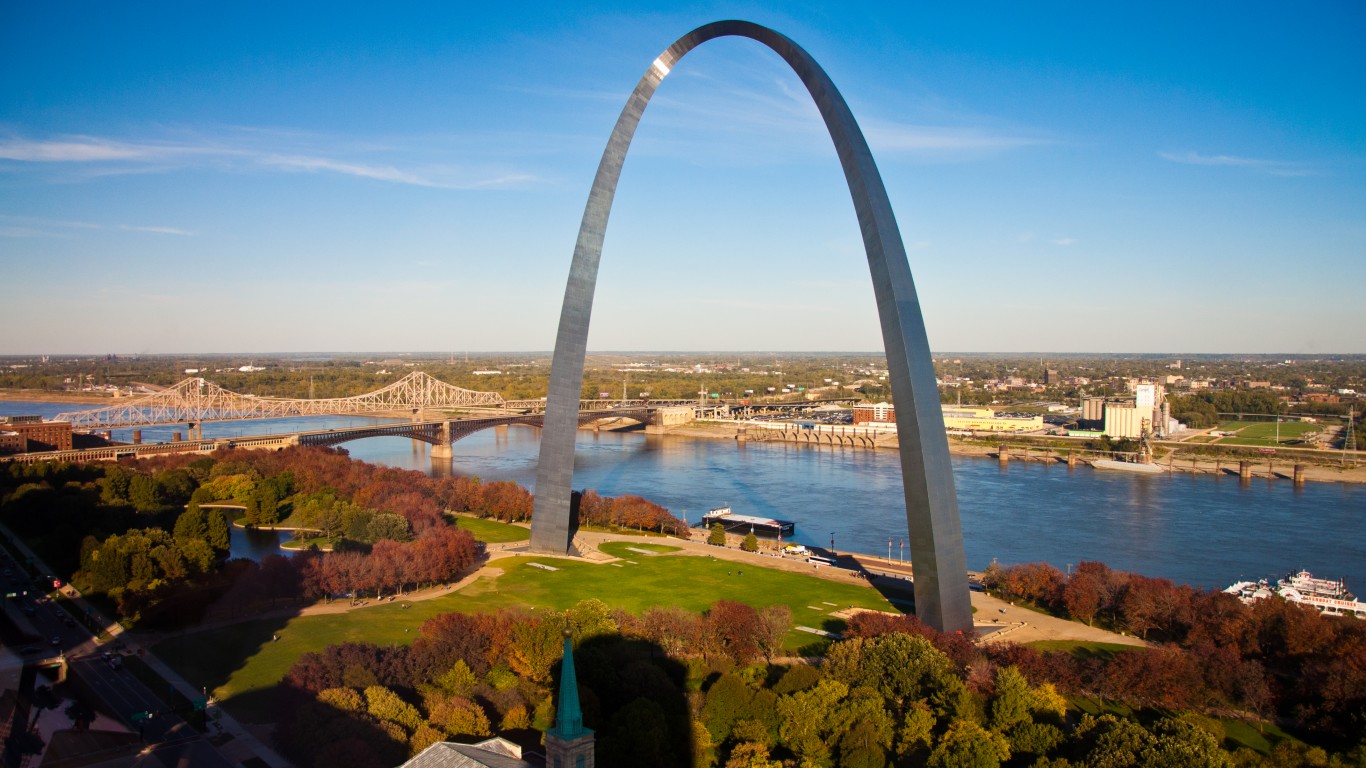
20. Gateway Arch National Park
> Recreation visits in 2021: 1,145,081
> Share of all National Park recreation visits in 2021: 0.39% — #20 largest out of 52
> Recreation visits in 2017: 9,190,610 — #1 most
> Share of all National Park recreation visits in 2017: 2.78% — #1 most
> 5-year change in visits -87.5% — #1 largest decline
[in-text-ad]
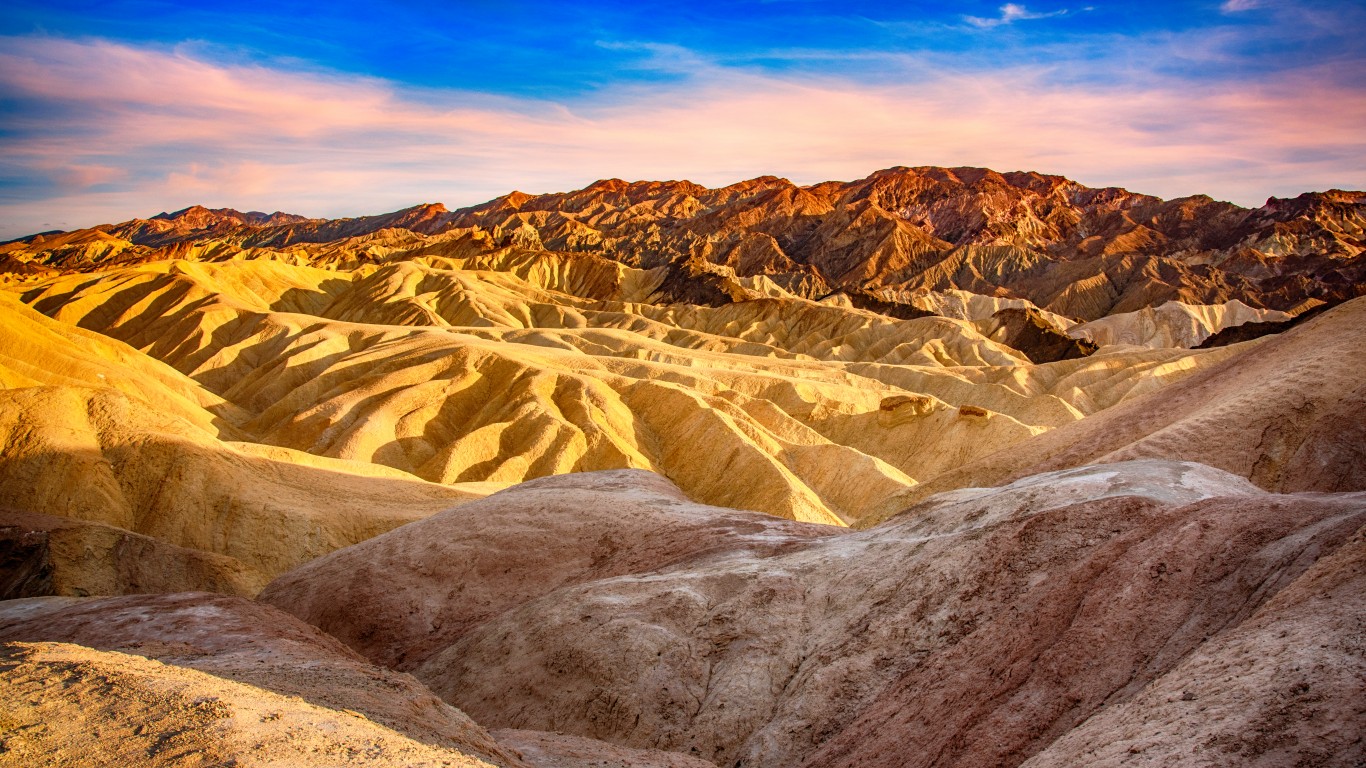
19. Death Valley National Park
> Recreation visits in 2021: 1,146,551
> Share of all National Park recreation visits in 2021: 0.39% — #19 largest out of 52
> Recreation visits in 2017: 1,294,827 — #18 most
> Share of all National Park recreation visits in 2017: 0.39% — #18 most
> 5-year change in visits -11.5% — #17 largest decline
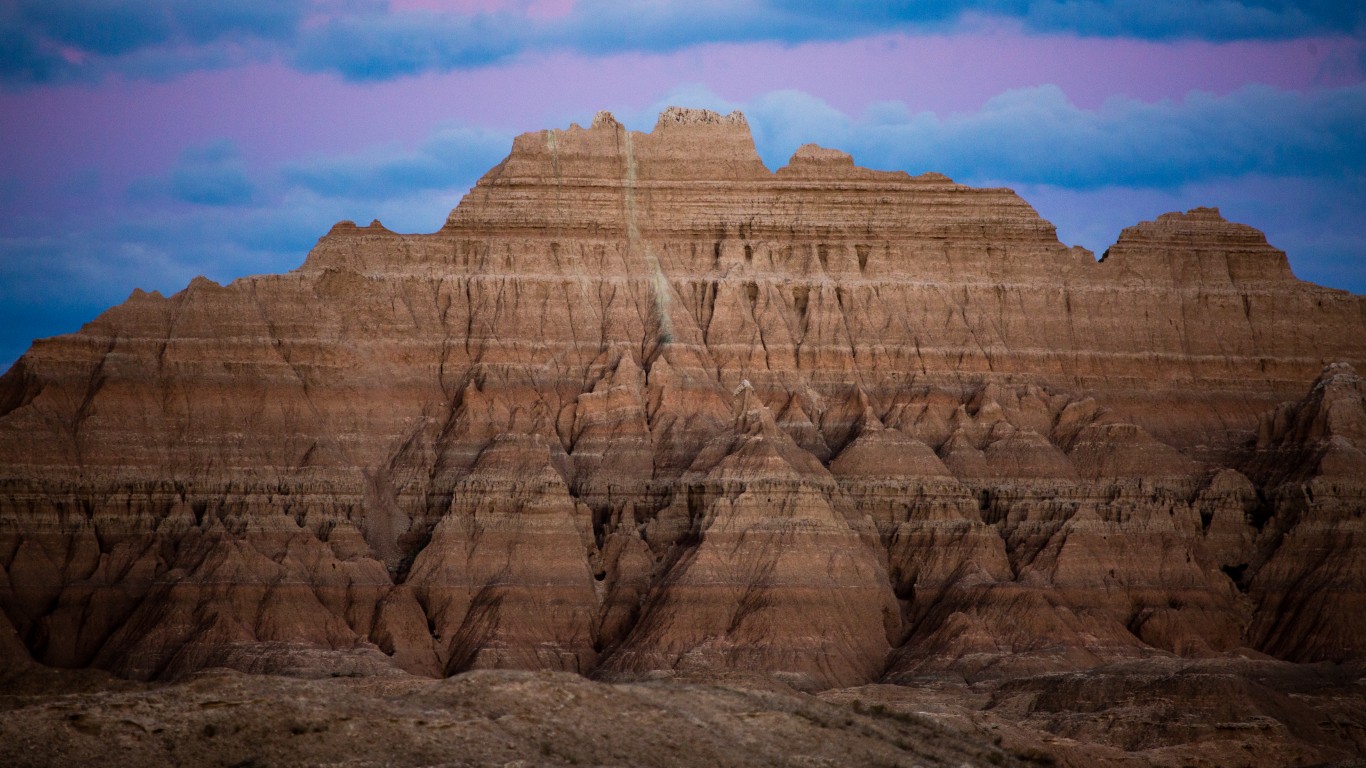
18. Badlands National Park
> Recreation visits in 2021: 1,224,226
> Share of all National Park recreation visits in 2021: 0.41% — #18 largest out of 52
> Recreation visits in 2017: 1,054,325 — #22 most
> Share of all National Park recreation visits in 2017: 0.32% — #22 most
> 5-year change in visits 16.1% — #17 largest increase
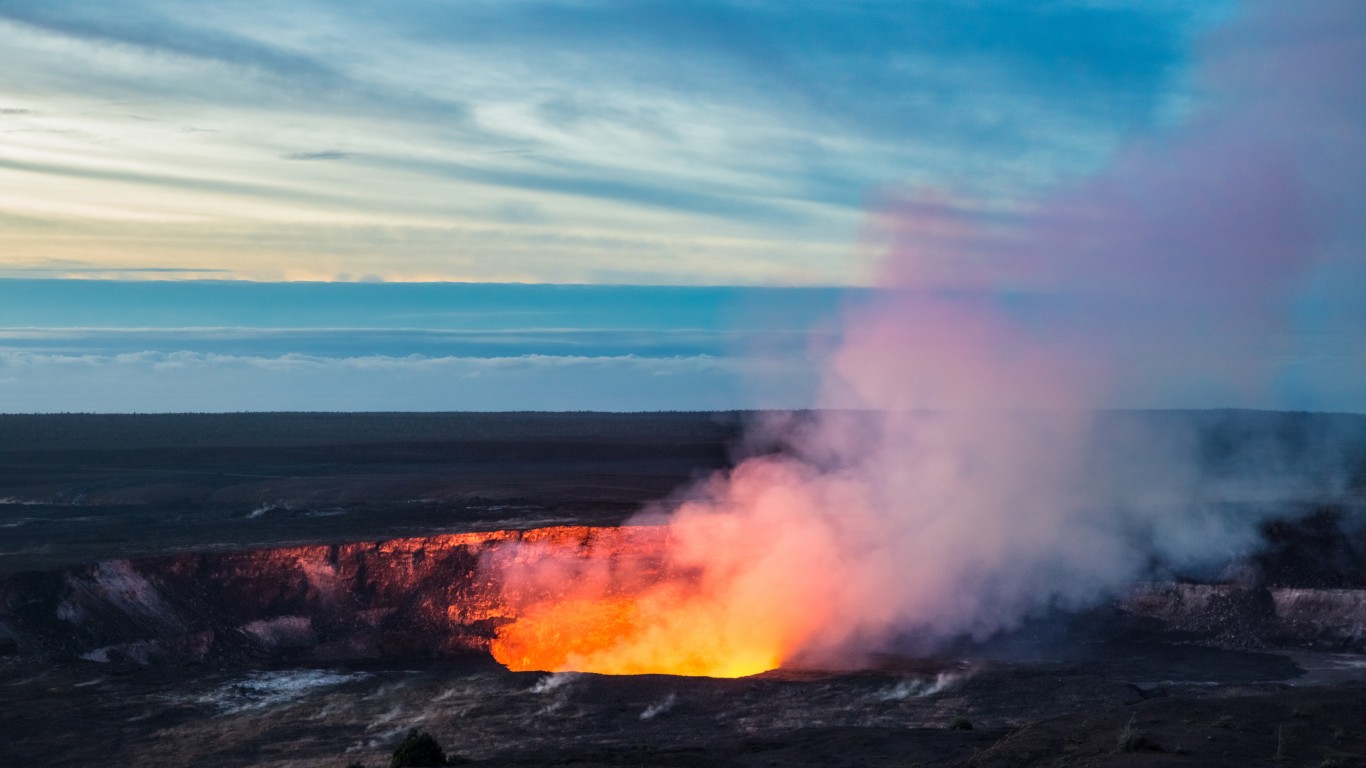
17. Hawaii Volcanoes National Park
> Recreation visits in 2021: 1,262,747
> Share of all National Park recreation visits in 2021: 0.43% — #17 largest out of 52
> Recreation visits in 2017: 2,016,702 — #14 most
> Share of all National Park recreation visits in 2017: 0.61% — #14 most
> 5-year change in visits -37.4% — #3 largest decline
[in-text-ad-2]
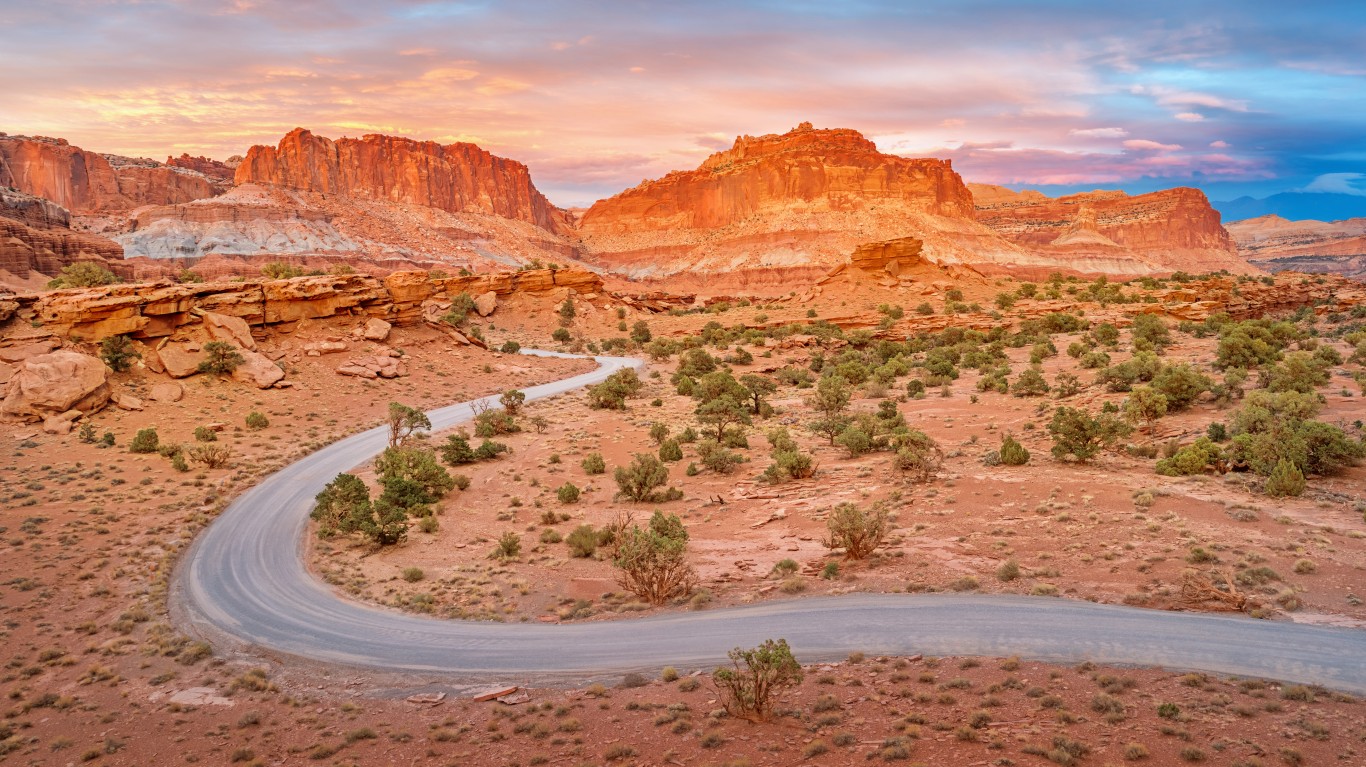
16. Capitol Reef National Park
> Recreation visits in 2021: 1,405,353
> Share of all National Park recreation visits in 2021: 0.47% — #16 largest out of 52
> Recreation visits in 2017: 1,150,165 — #20 most
> Share of all National Park recreation visits in 2017: 0.35% — #20 most
> 5-year change in visits 22.2% — #11 largest increase
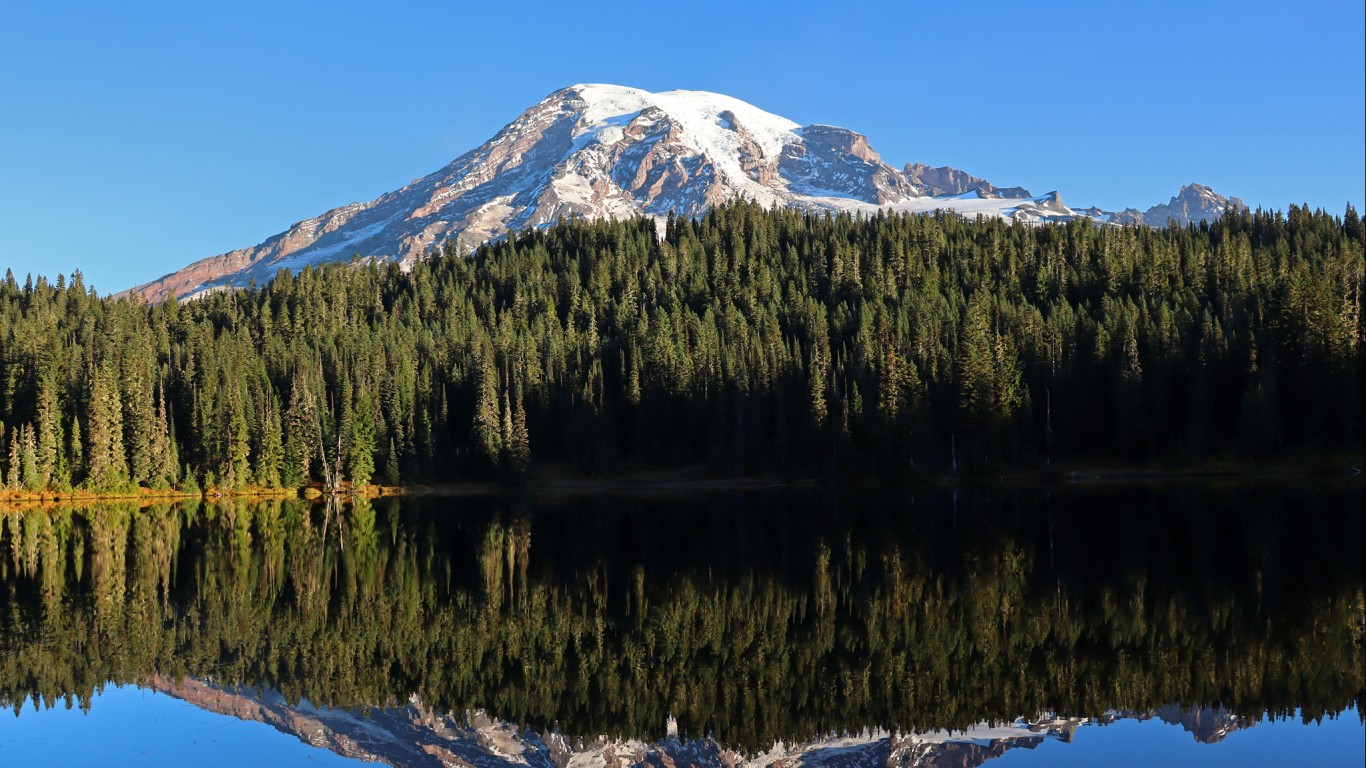
15. Mount Rainier National Park
> Recreation visits in 2021: 1,670,063
> Share of all National Park recreation visits in 2021: 0.56% — #15 largest out of 52
> Recreation visits in 2017: 1,415,867 — #17 most
> Share of all National Park recreation visits in 2017: 0.43% — #17 most
> 5-year change in visits 18.0% — #14 largest increase
[in-text-ad]
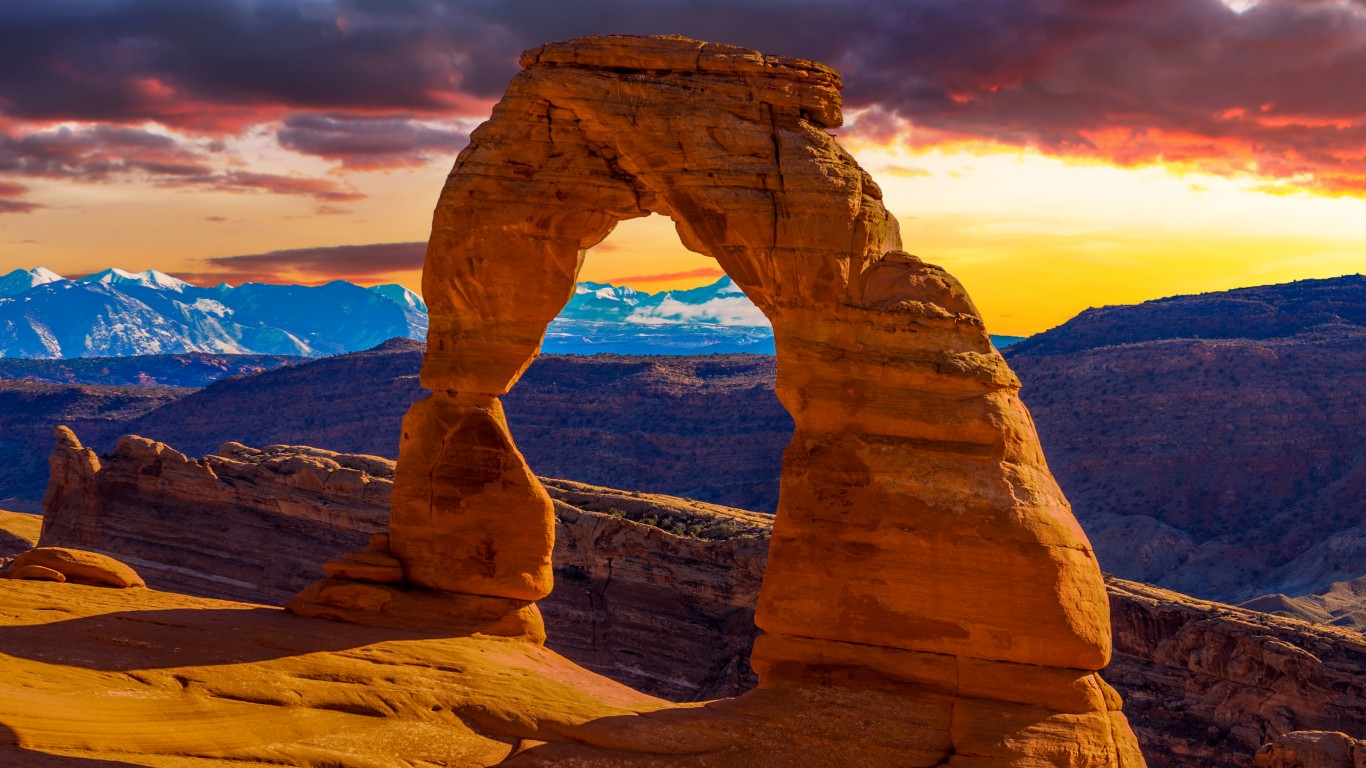
14. Arches National Park
> Recreation visits in 2021: 1,806,865
> Share of all National Park recreation visits in 2021: 0.61% — #14 largest out of 52
> Recreation visits in 2017: 1,539,028 — #16 most
> Share of all National Park recreation visits in 2017: 0.47% — #16 most
> 5-year change in visits 17.4% — #15 largest increase
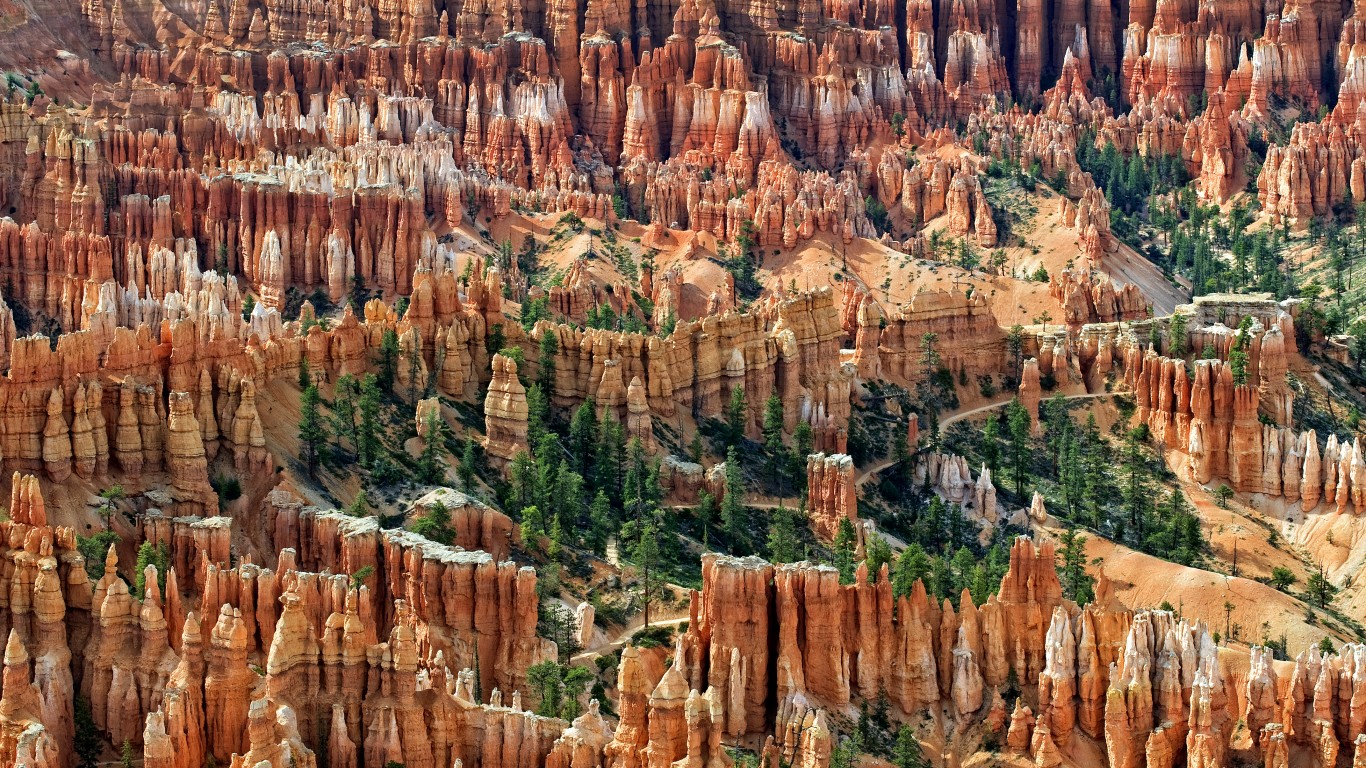
13. Bryce Canyon National Park
> Recreation visits in 2021: 2,104,600
> Share of all National Park recreation visits in 2021: 0.71% — #13 largest out of 52
> Recreation visits in 2017: 2,571,684 — #11 most
> Share of all National Park recreation visits in 2017: 0.78% — #11 most
> 5-year change in visits -18.2% — #13 largest decline
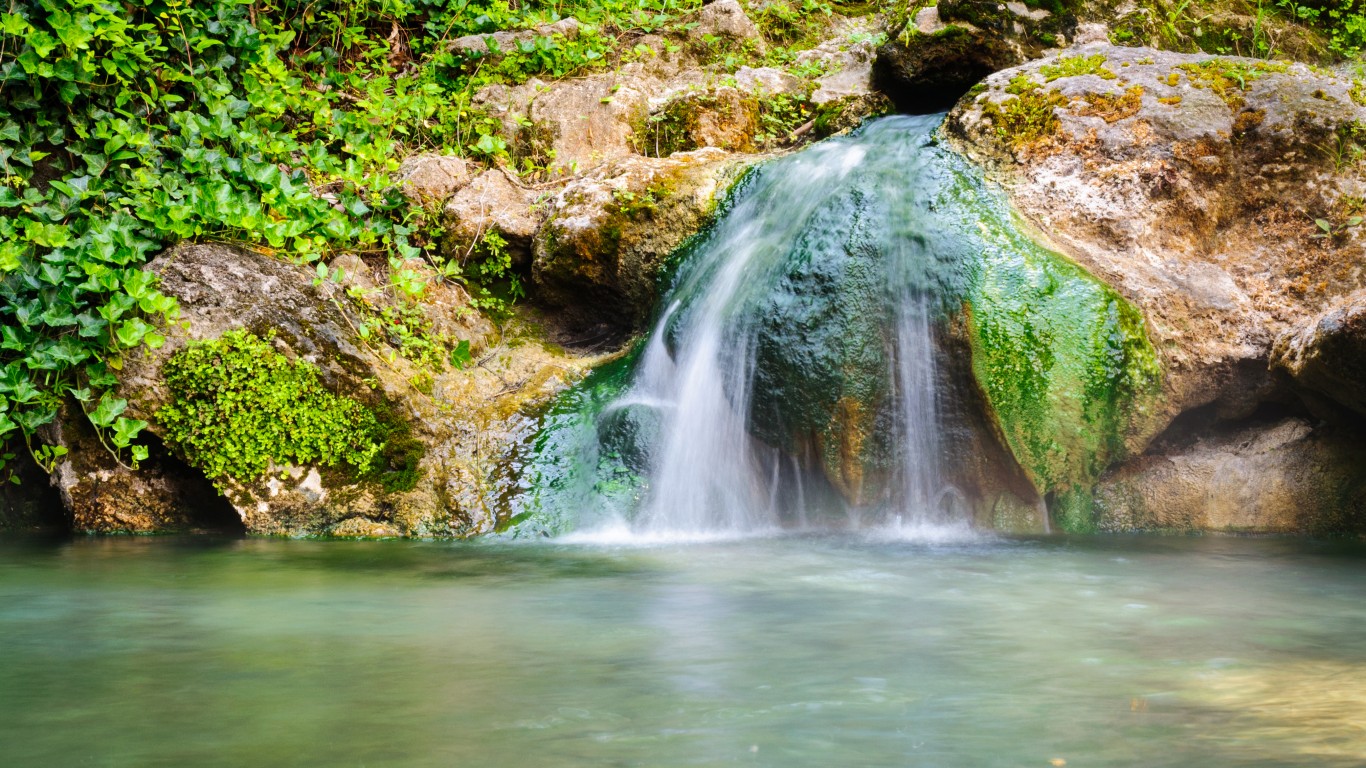
12. Hot Springs National Park
> Recreation visits in 2021: 2,162,884
> Share of all National Park recreation visits in 2021: 0.73% — #12 largest out of 52
> Recreation visits in 2017: 1,561,616 — #15 most
> Share of all National Park recreation visits in 2017: 0.47% — #15 most
> 5-year change in visits 38.5% — #6 largest increase
[in-text-ad-2]
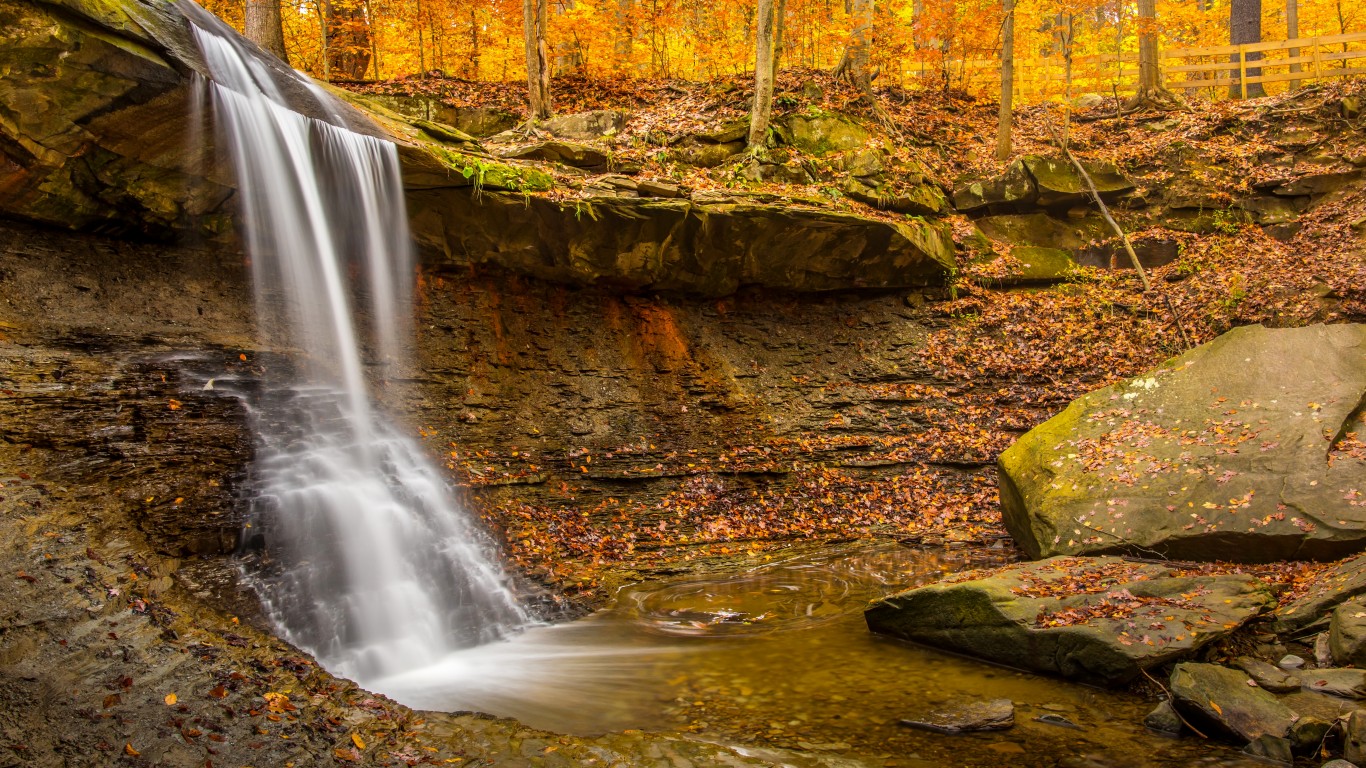
11. Cuyahoga Valley National Park
> Recreation visits in 2021: 2,575,275
> Share of all National Park recreation visits in 2021: 0.87% — #11 largest out of 52
> Recreation visits in 2017: 2,226,879 — #12 most
> Share of all National Park recreation visits in 2017: 0.67% — #12 most
> 5-year change in visits 15.6% — #18 largest increase
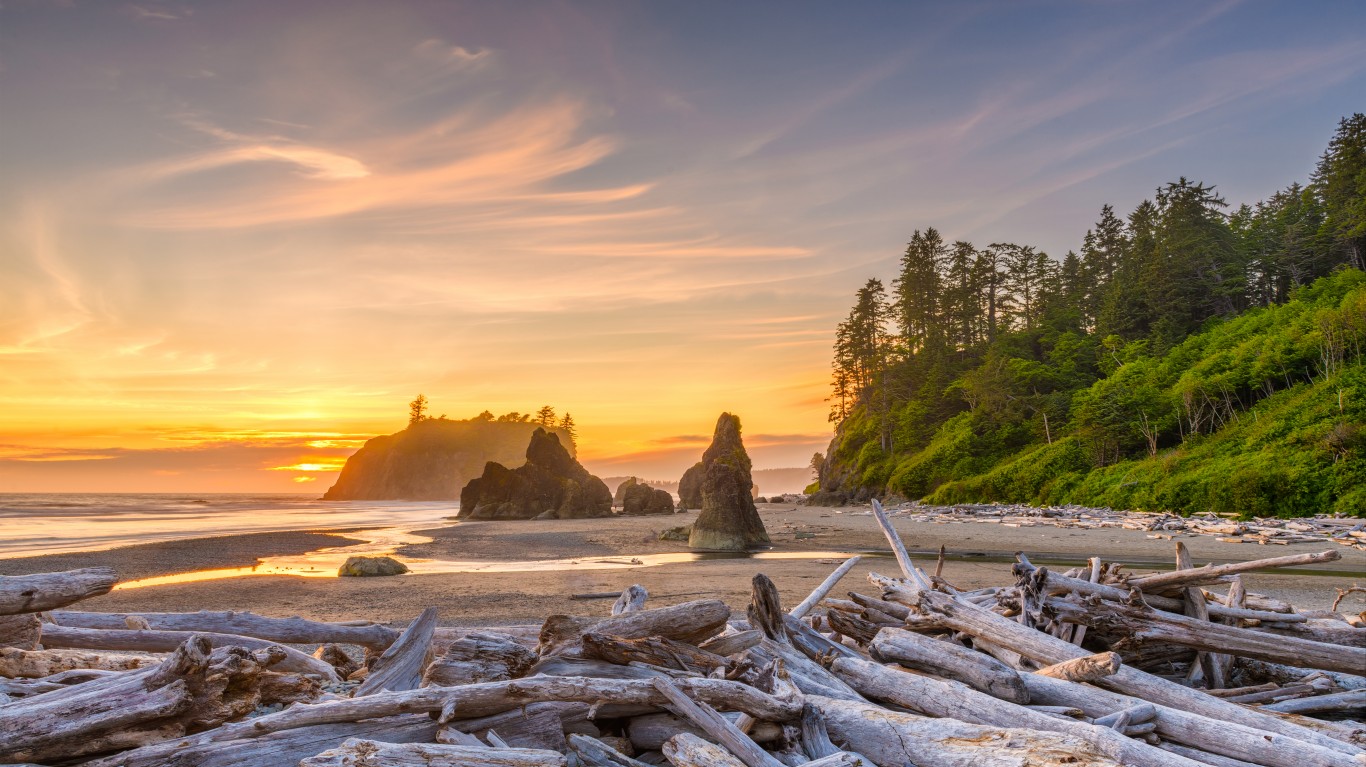
10. Olympic National Park
> Recreation visits in 2021: 2,718,925
> Share of all National Park recreation visits in 2021: 0.92% — #10 largest out of 52
> Recreation visits in 2017: 3,401,996 — #7 most
> Share of all National Park recreation visits in 2017: 1.03% — #7 most
> 5-year change in visits -20.1% — #11 largest decline
[in-text-ad]
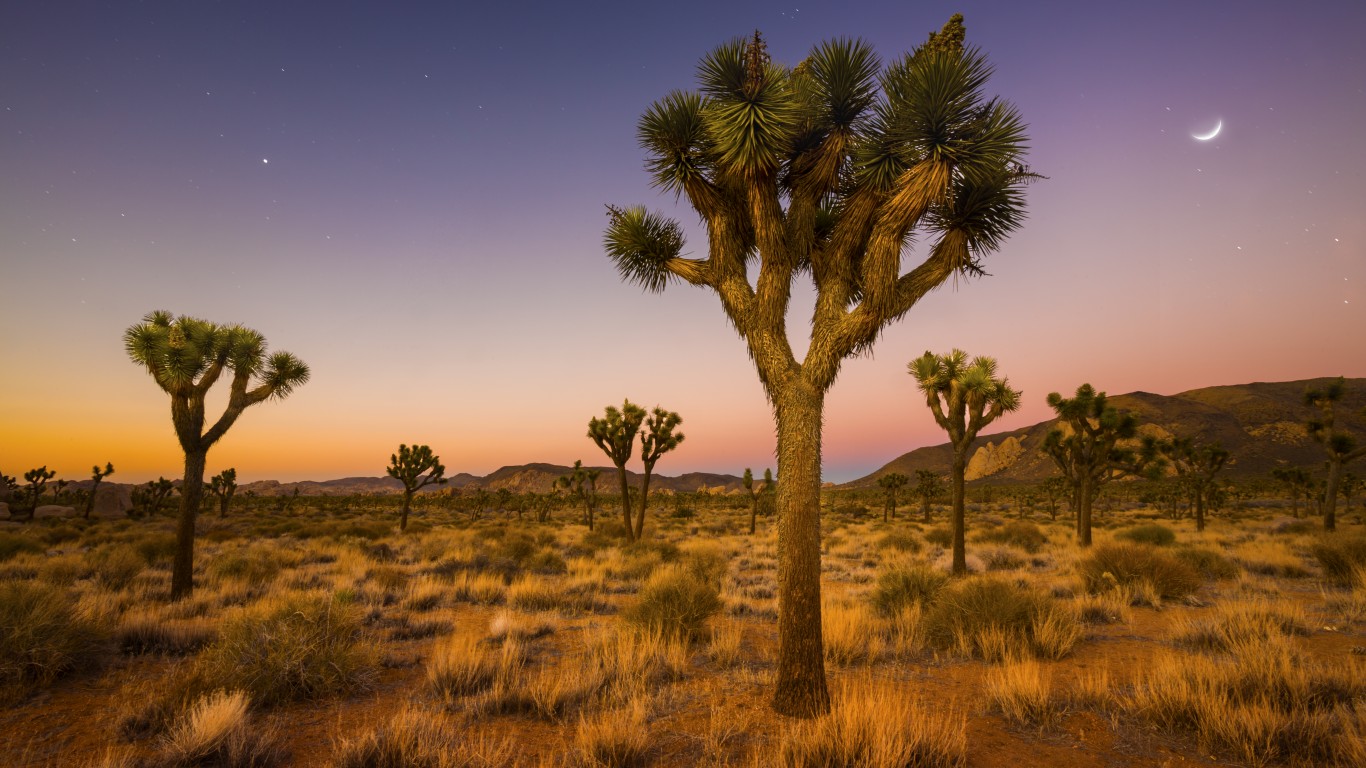
9. Joshua Tree National Park
> Recreation visits in 2021: 3,064,400
> Share of all National Park recreation visits in 2021: 1.03% — #9 largest out of 52
> Recreation visits in 2017: 2,853,619 — #10 most
> Share of all National Park recreation visits in 2017: 0.86% — #10 most
> 5-year change in visits 7.4% — #24 largest increase
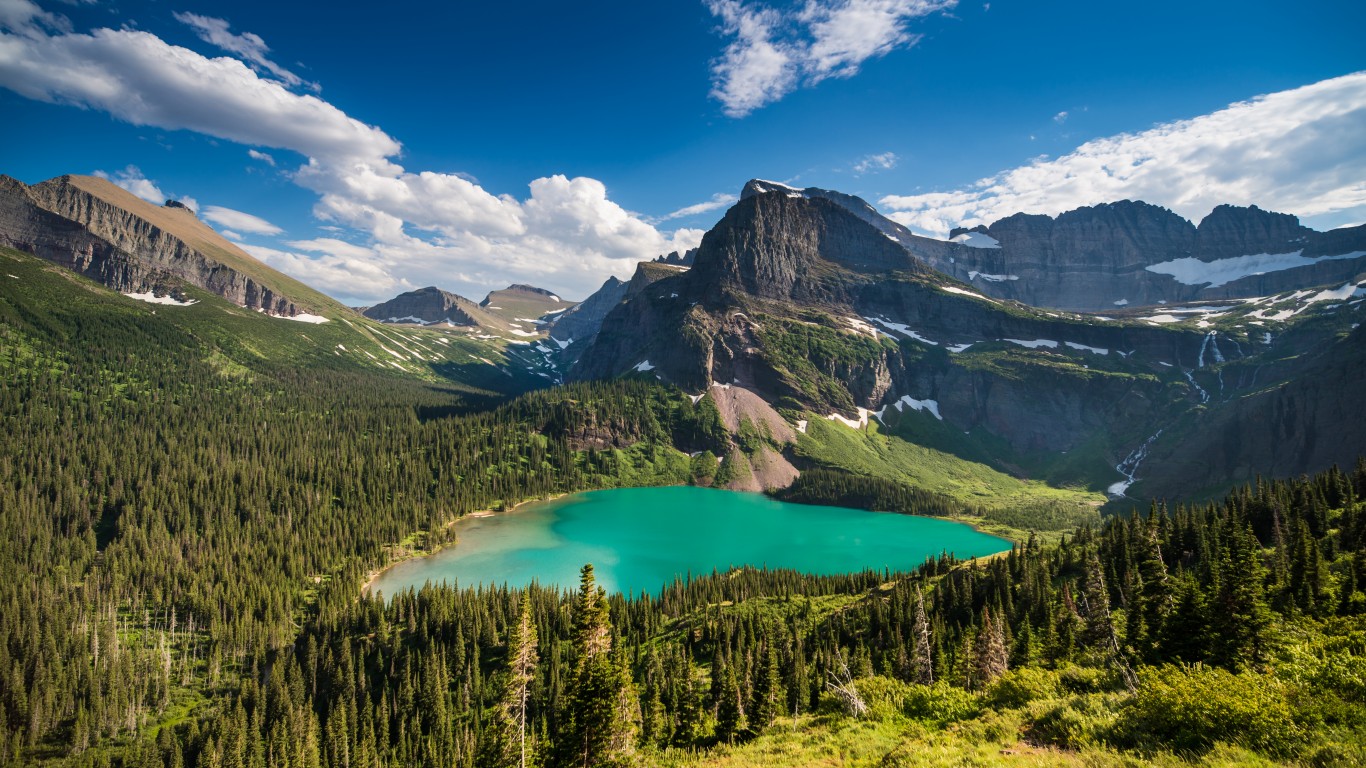
8. Glacier National Park
> Recreation visits in 2021: 3,081,656
> Share of all National Park recreation visits in 2021: 1.04% — #8 largest out of 52
> Recreation visits in 2017: 3,305,512 — #9 most
> Share of all National Park recreation visits in 2017: 1.00% — #9 most
> 5-year change in visits -6.8% — #21 largest decline
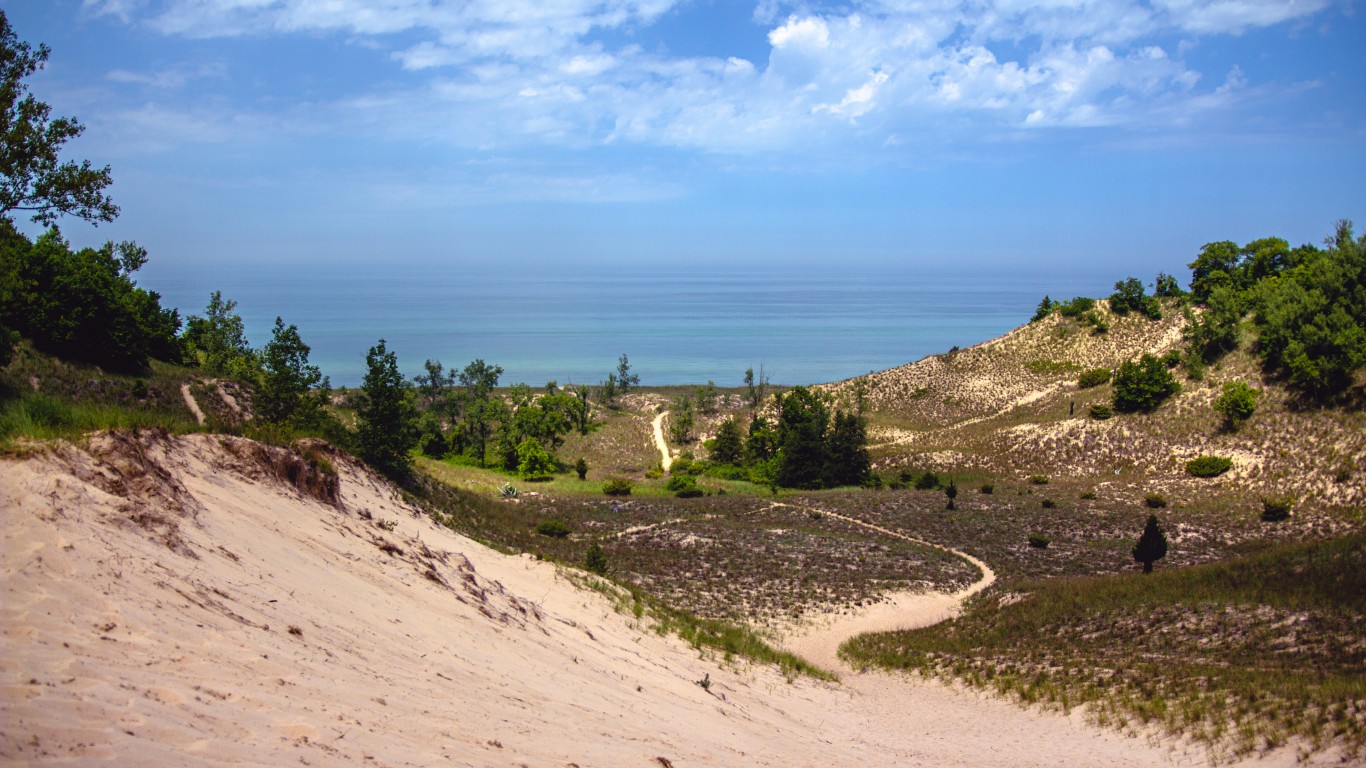
7. Indiana Dunes National Park
> Recreation visits in 2021: 3,177,210
> Share of all National Park recreation visits in 2021: 1.07% — #7 largest out of 52
> Recreation visits in 2017: 2,158,471 — #13 most
> Share of all National Park recreation visits in 2017: 0.65% — #13 most
> 5-year change in visits 47.2% — #5 largest increase
[in-text-ad-2]
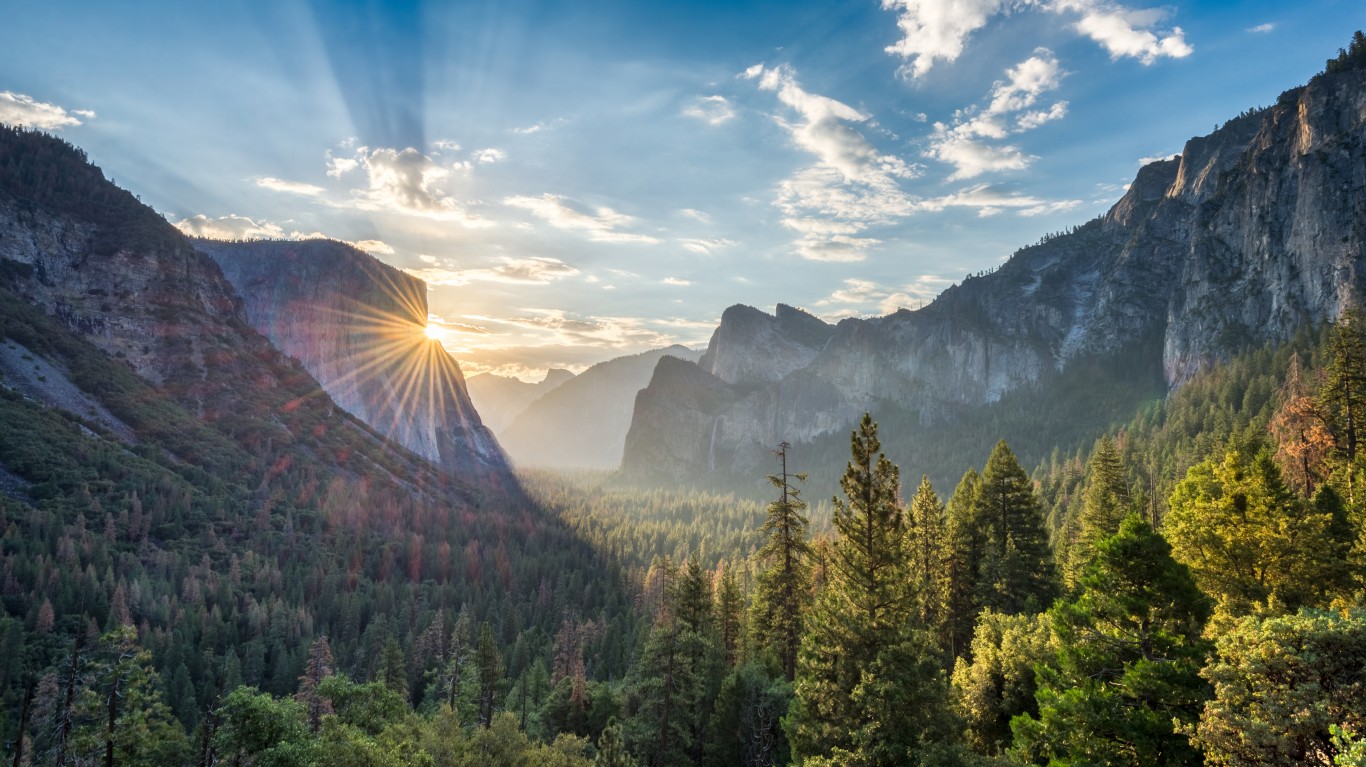
6. Yosemite National Park
> Recreation visits in 2021: 3,287,595
> Share of all National Park recreation visits in 2021: 1.11% — #6 largest out of 52
> Recreation visits in 2017: 4,336,890 — #5 most
> Share of all National Park recreation visits in 2017: 1.31% — #5 most
> 5-year change in visits -24.2% — #8 largest decline
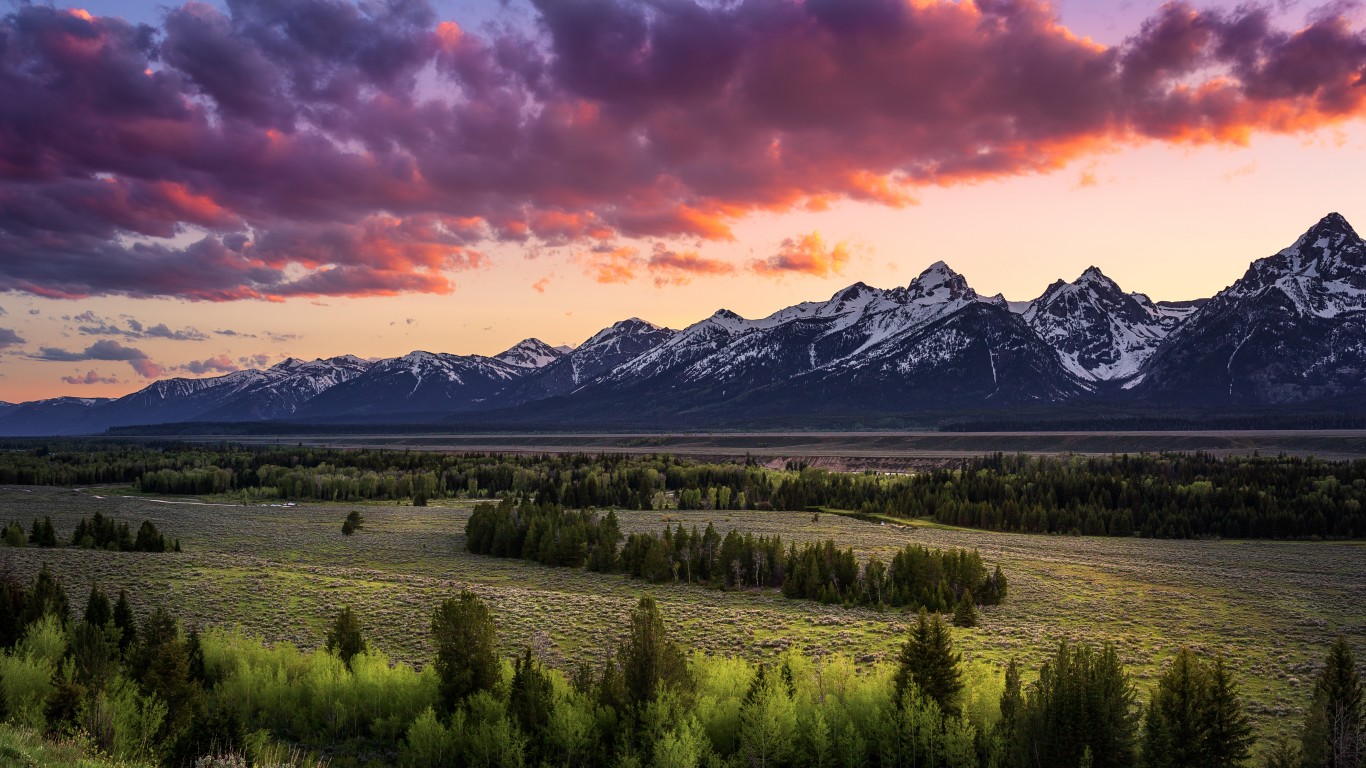
5. Grand Teton National Park
> Recreation visits in 2021: 3,885,230
> Share of all National Park recreation visits in 2021: 1.31% — #5 largest out of 52
> Recreation visits in 2017: 3,317,000 — #8 most
> Share of all National Park recreation visits in 2017: 1.00% — #8 most
> 5-year change in visits 17.1% — #16 largest increase
[in-text-ad]
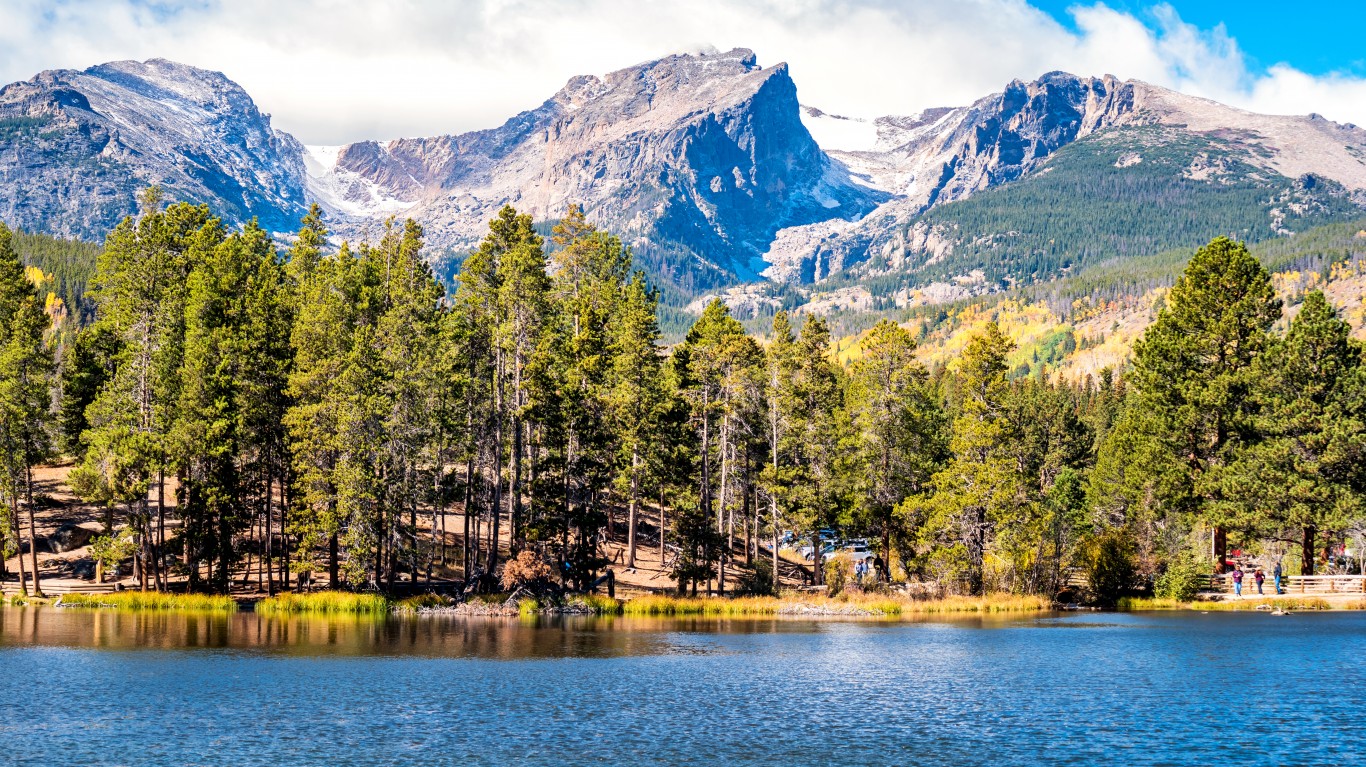
4. Rocky Mountain National Park
> Recreation visits in 2021: 4,434,848
> Share of all National Park recreation visits in 2021: 1.49% — #4 largest out of 52
> Recreation visits in 2017: 4,437,215 — #4 most
> Share of all National Park recreation visits in 2017: 1.34% — #4 most
> 5-year change in visits -0.1% — #23 largest decline
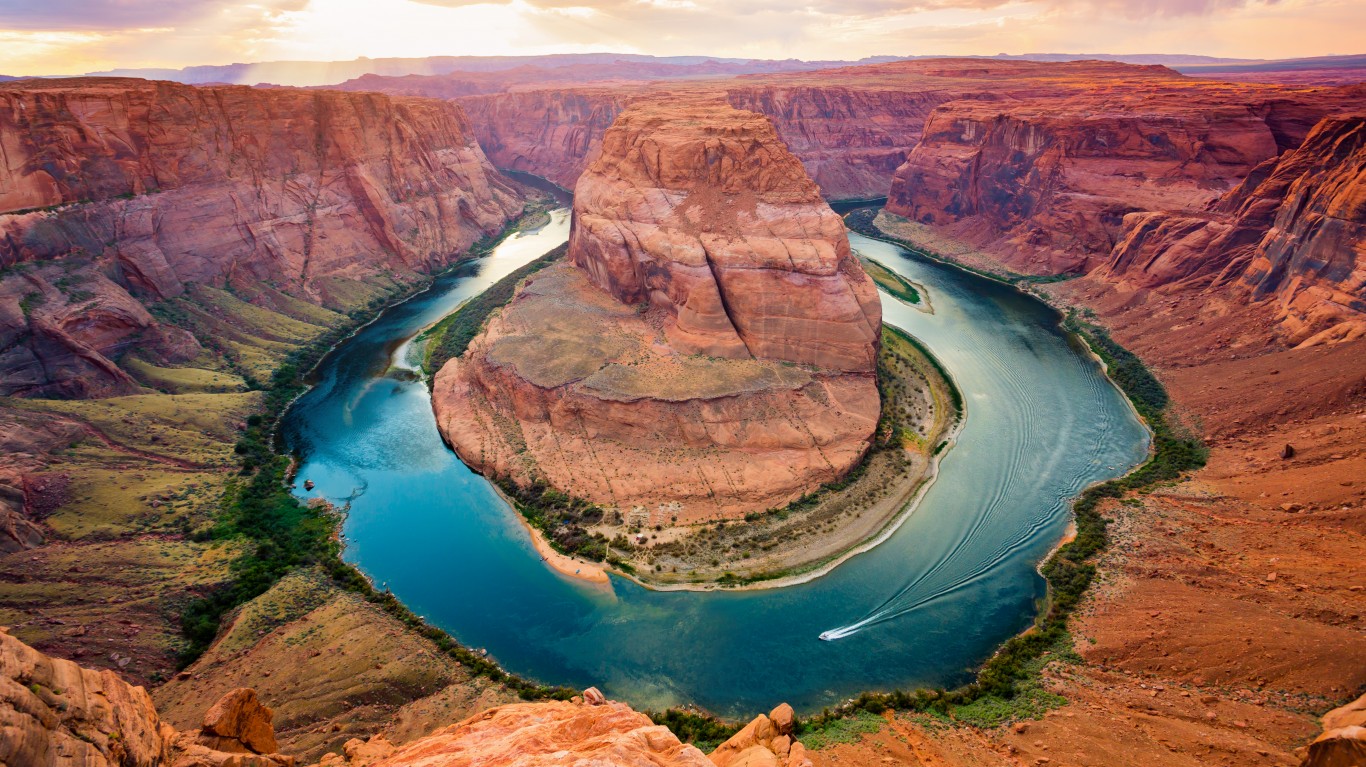
3. Grand Canyon National Park
> Recreation visits in 2021: 4,532,677
> Share of all National Park recreation visits in 2021: 1.53% — #3 largest out of 52
> Recreation visits in 2017: 6,254,238 — #2 most
> Share of all National Park recreation visits in 2017: 1.89% — #2 most
> 5-year change in visits -27.5% — #6 largest decline
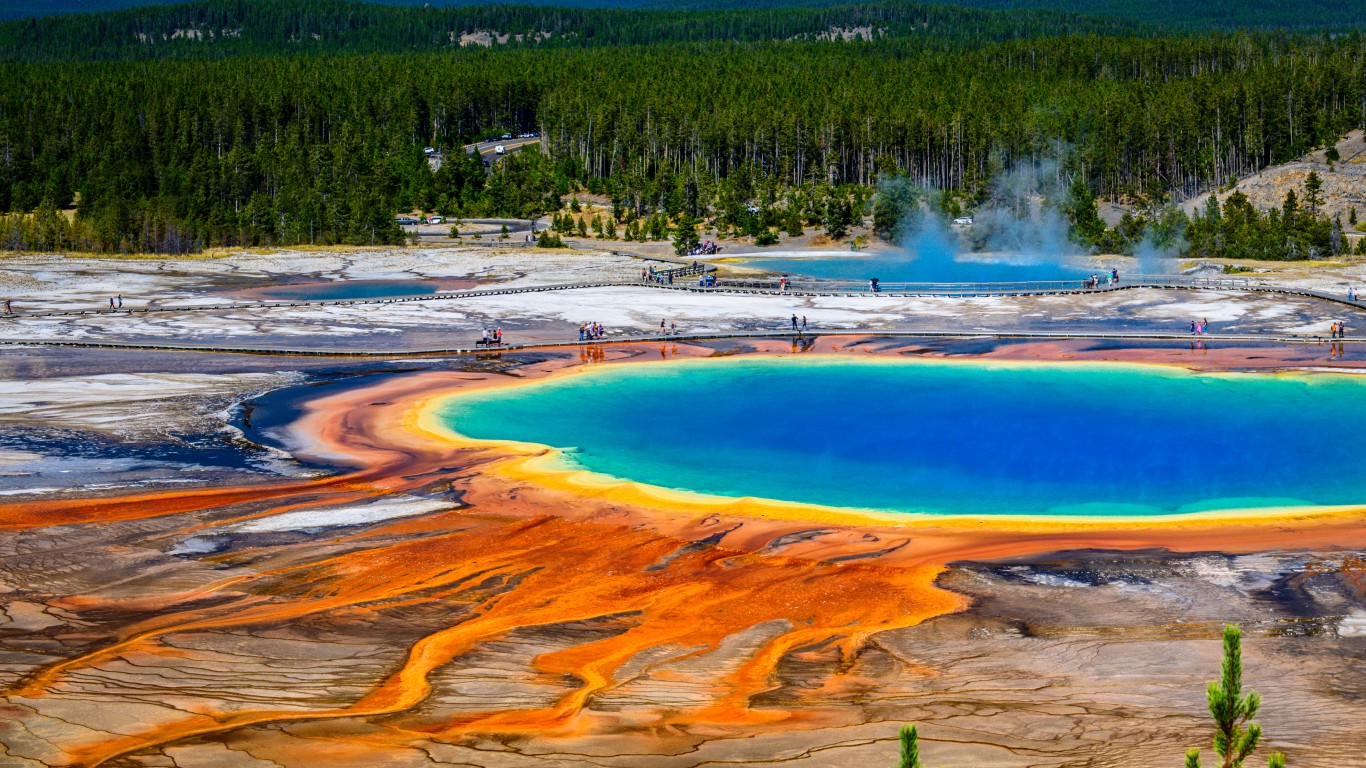
2. Yellowstone National Park
> Recreation visits in 2021: 4,860,242
> Share of all National Park recreation visits in 2021: 1.64% — #2 largest out of 52
> Recreation visits in 2017: 4,116,524 — #6 most
> Share of all National Park recreation visits in 2017: 1.24% — #6 most
> 5-year change in visits 18.1% — #13 largest increase
[in-text-ad-2]
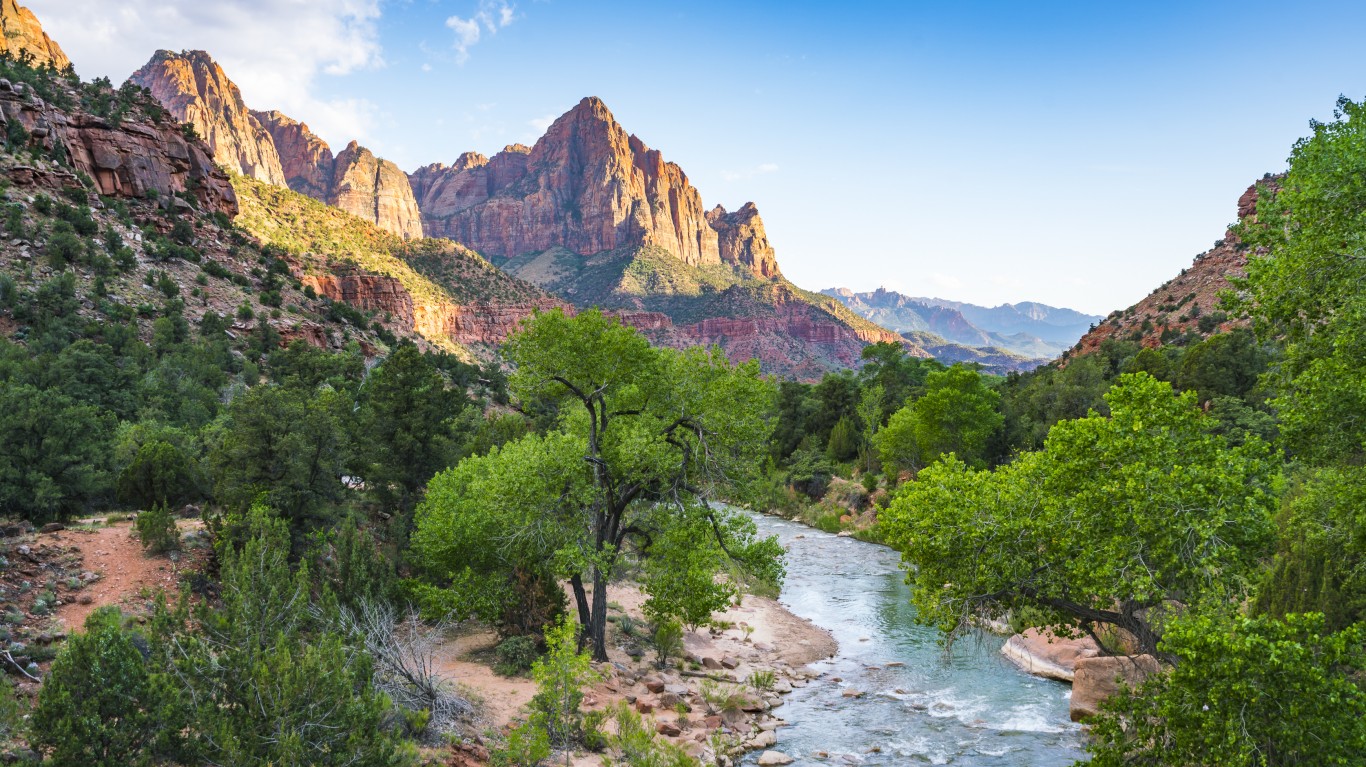
1. Zion National Park
> Recreation visits in 2021: 5,039,835
> Share of all National Park recreation visits in 2021: 1.70% — #1 largest out of 52
> Recreation visits in 2017: 4,504,812 — #3 most
> Share of all National Park recreation visits in 2017: 1.36% — #3 most
> 5-year change in visits 11.9% — #22 largest increase
The Average American Has No Idea How Much Money You Can Make Today (Sponsor)
The last few years made people forget how much banks and CD’s can pay. Meanwhile, interest rates have spiked and many can afford to pay you much more, but most are keeping yields low and hoping you won’t notice.
But there is good news. To win qualified customers, some accounts are paying almost 10x the national average! That’s an incredible way to keep your money safe and earn more at the same time. Our top pick for high yield savings accounts includes other benefits as well. You can earn up to 3.80% with a Checking & Savings Account today Sign up and get up to $300 with direct deposit. No account fees. FDIC Insured.
Click here to see how much more you could be earning on your savings today. It takes just a few minutes to open an account to make your money work for you.
Our top pick for high yield savings accounts includes other benefits as well. You can earn up to 4.00% with a Checking & Savings Account from Sofi. Sign up and get up to $300 with direct deposit. No account fees. FDIC Insured.
Thank you for reading! Have some feedback for us?
Contact the 24/7 Wall St. editorial team.
 24/7 Wall St.
 24/7 Wall St.
 24/7 Wall St.
