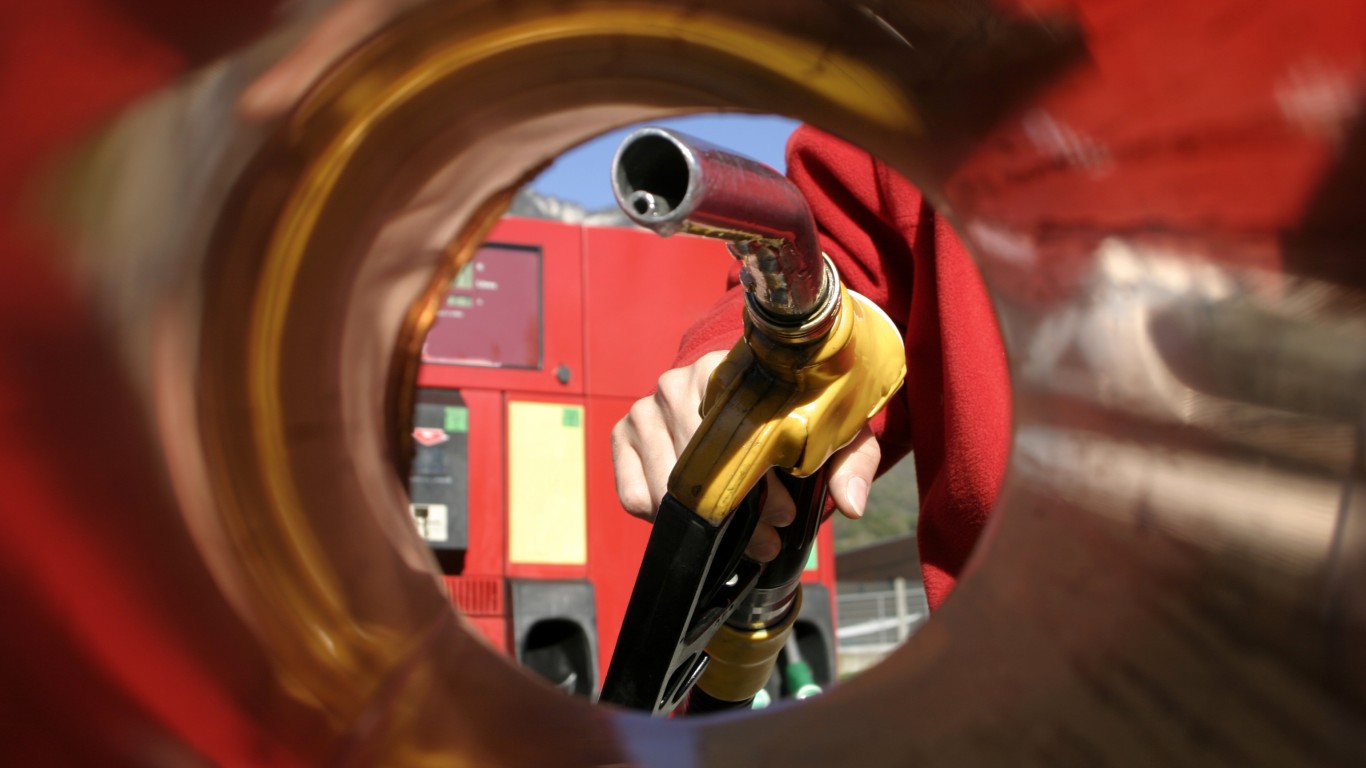
Listing the most affordable metros for gasoline is becoming an increasingly challenging endeavor as the economic news becomes grimmer.
The Labor Department on Friday said the consumer price index rose 8.6% in May from the same month a year ago, propelled by soaring energy and food prices. That is its fastest pace since December 1981. A gallon of gas in the U.S. now costs $5 on average nationwide, according to GasBuddy. JPMorgan analysts forecast that it could climb above $6. Crude oil is trading at around $120 a barrel, and analysts do not foresee much relief in sight. (The price of this household item is soaring.)
While the rising cost of gasoline has impacted all U.S. metro areas, some are more affordable for commuters. To find the most affordable metros for gas, 24/7 Wall St. reviewed Clever Real Estate’s The Best and Worst Cities for Commuters in 2022. Clever compared the 50 most populous U.S. metro areas across nine metrics related to commuting, including annual cost of commute cost as a percentage of income, commuting distances and times, and insurance and fuel costs among others.
Of the 10 metro areas that are the most affordable for commuters, three are in Ohio – Cincinnati, Columbus, and Cleveland. The annual cost to commute as a percentage of average income in all three metro regions is 16%. Buffalo, New York; Salt Lake City; and Virginia Beach, Virginia, all have an annual cost to commute as a percentage of average income of 15%, the lowest on the list. (These are the metros with the longest commutes.)
In contrast, the annual cost to commute as a percentage of average income in Detroit is a whopping 29%. The Motor City is one of three metros where that cost exceeds 20%, or one-fifth, of average income. Detroit is also saddled with the highest annual fuel cost of a workday commute at $12,801.
According to the real estate advice website Clever, the average commuter in the U.S. spends $8,466 and about 19% of their annual income on their commute every year. As part of that cost, the average commuter spends $867 on fuel and $410 on vehicle maintenance each year.
The pandemic forced many to work from home, if they could, and now the escalating cost of gasoline is making the prospect of working remotely even more appealing. For those with in-person labor positions in manufacturing, retail, or health care who do not have a choice of working from home, they face the income crushing reality of higher gasoline prices.
Click here to see the most affordable metros for commuters
Click here to read our detailed methodology

50. Detroit, MI
> Annual cost to commute as a pct. of average income: 29.0% — #1 most out of 50 metro areas
> Annual fuel cost of a workday commute: $12,801 — #1 most
> Annual maintenance cost of commuting: $487 — #6 most
> Potential income lost due to commuting: $5,045 — #22 most
[in-text-ad]

49. Atlanta, GA
> Annual cost to commute as a pct. of average income: 22.0% — #6 most out of 50 metro areas
> Annual fuel cost of a workday commute: $9,350 — #11 most
> Annual maintenance cost of commuting: $599 — #1 most
> Potential income lost due to commuting: $5,647 — #12 most

48. New York, NY
> Annual cost to commute as a pct. of average income: 23.0% — #3 most out of 50 metro areas
> Annual fuel cost of a workday commute: $12,148 — #3 most
> Annual maintenance cost of commuting: $360 — #40 most
> Potential income lost due to commuting: $8,020 — #4 most

47. Riverside, CA
> Annual cost to commute as a pct. of average income: 23.0% — #3 most out of 50 metro areas
> Annual fuel cost of a workday commute: $9,078 — #16 most
> Annual maintenance cost of commuting: $426 — #13 most
> Potential income lost due to commuting: $5,481 — #14 most
[in-text-ad-2]

46. Los Angeles, CA
> Annual cost to commute as a pct. of average income: 22.0% — #6 most out of 50 metro areas
> Annual fuel cost of a workday commute: $10,101 — #8 most
> Annual maintenance cost of commuting: $412 — #20 most
> Potential income lost due to commuting: $5,846 — #9 most

45. San Francisco, CA
> Annual cost to commute as a pct. of average income: 20.0% — #12 most out of 50 metro areas
> Annual fuel cost of a workday commute: $12,358 — #2 most
> Annual maintenance cost of commuting: $374 — #36 most
> Potential income lost due to commuting: $8,780 — #1 most
[in-text-ad]

44. Chicago, IL
> Annual cost to commute as a pct. of average income: 20.0% — #12 most out of 50 metro areas
> Annual fuel cost of a workday commute: $9,256 — #12 most
> Annual maintenance cost of commuting: $468 — #8 most
> Potential income lost due to commuting: $6,019 — #8 most

43. Houston, TX
> Annual cost to commute as a pct. of average income: 20.0% — #12 most out of 50 metro areas
> Annual fuel cost of a workday commute: $8,585 — #21 most
> Annual maintenance cost of commuting: $571 — #2 most
> Potential income lost due to commuting: $5,262 — #19 most

42. Washington, DC
> Annual cost to commute as a pct. of average income: 19.0% — #21 most out of 50 metro areas
> Annual fuel cost of a workday commute: $11,556 — #4 most
> Annual maintenance cost of commuting: $426 — #13 most
> Potential income lost due to commuting: $8,771 — #2 most
[in-text-ad-2]

41. Dallas, TX
> Annual cost to commute as a pct. of average income: 20.0% — #12 most out of 50 metro areas
> Annual fuel cost of a workday commute: $8,362 — #24 most
> Annual maintenance cost of commuting: $571 — #2 most
> Potential income lost due to commuting: $5,056 — #21 most

40. Phoenix, AZ
> Annual cost to commute as a pct. of average income: 20.0% — #12 most out of 50 metro areas
> Annual fuel cost of a workday commute: $8,198 — #27 most
> Annual maintenance cost of commuting: $534 — #4 most
> Potential income lost due to commuting: $4,630 — #29 most
[in-text-ad]
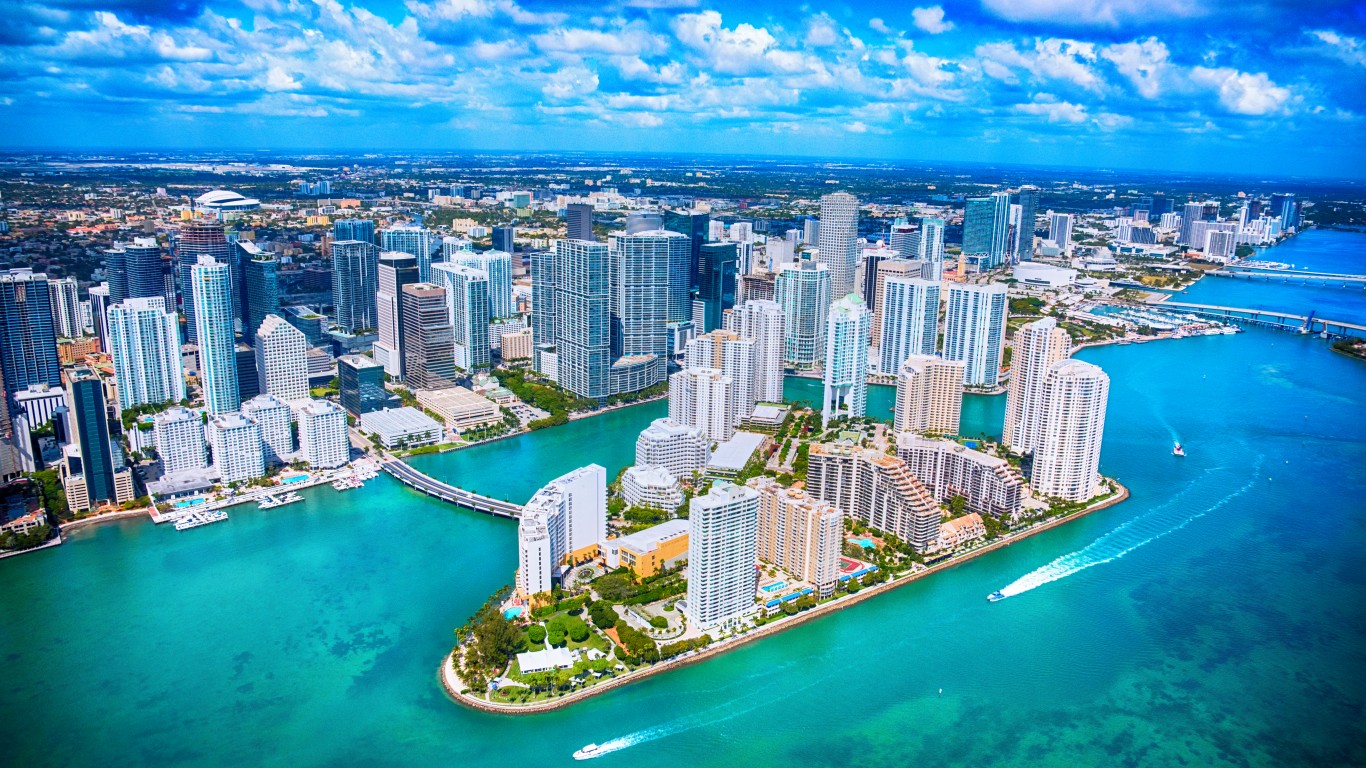
39. Miami, FL
> Annual cost to commute as a pct. of average income: 24.0% — #2 most out of 50 metro areas
> Annual fuel cost of a workday commute: $9,123 — #14 most
> Annual maintenance cost of commuting: $402 — #26 most
> Potential income lost due to commuting: $4,820 — #26 most

38. Boston, MA
> Annual cost to commute as a pct. of average income: 18.0% — #27 most out of 50 metro areas
> Annual fuel cost of a workday commute: $10,520 — #7 most
> Annual maintenance cost of commuting: $410 — #22 most
> Potential income lost due to commuting: $7,491 — #6 most

37. Seattle, WA
> Annual cost to commute as a pct. of average income: 18.0% — #27 most out of 50 metro areas
> Annual fuel cost of a workday commute: $10,546 — #6 most
> Annual maintenance cost of commuting: $421 — #17 most
> Potential income lost due to commuting: $7,533 — #5 most
[in-text-ad-2]

36. Nashville, TN
> Annual cost to commute as a pct. of average income: 19.0% — #21 most out of 50 metro areas
> Annual fuel cost of a workday commute: $7,890 — #29 most
> Annual maintenance cost of commuting: $515 — #5 most
> Potential income lost due to commuting: $4,759 — #27 most

35. Philadelphia, PA
> Annual cost to commute as a pct. of average income: 21.0% — #10 most out of 50 metro areas
> Annual fuel cost of a workday commute: $9,610 — #9 most
> Annual maintenance cost of commuting: $365 — #38 most
> Potential income lost due to commuting: $5,833 — #10 most
[in-text-ad]

34. Orlando, FL
> Annual cost to commute as a pct. of average income: 22.0% — #6 most out of 50 metro areas
> Annual fuel cost of a workday commute: $8,058 — #28 most
> Annual maintenance cost of commuting: $426 — #13 most
> Potential income lost due to commuting: $4,497 — #33 most

33. Baltimore, MD
> Annual cost to commute as a pct. of average income: 20.0% — #12 most out of 50 metro areas
> Annual fuel cost of a workday commute: $9,535 — #10 most
> Annual maintenance cost of commuting: $402 — #26 most
> Potential income lost due to commuting: $6,321 — #7 most

32. Tampa, FL
> Annual cost to commute as a pct. of average income: 22.0% — #6 most out of 50 metro areas
> Annual fuel cost of a workday commute: $8,682 — #19 most
> Annual maintenance cost of commuting: $398 — #31 most
> Potential income lost due to commuting: $4,510 — #32 most
[in-text-ad-2]

31. San Diego, CA
> Annual cost to commute as a pct. of average income: 18.0% — #27 most out of 50 metro areas
> Annual fuel cost of a workday commute: $8,648 — #20 most
> Annual maintenance cost of commuting: $398 — #31 most
> Potential income lost due to commuting: $5,321 — #17 most

30. Sacramento, CA
> Annual cost to commute as a pct. of average income: 19.0% — #21 most out of 50 metro areas
> Annual fuel cost of a workday commute: $9,082 — #15 most
> Annual maintenance cost of commuting: $374 — #36 most
> Potential income lost due to commuting: $5,548 — #13 most
[in-text-ad]

29. St. Louis, MO
> Annual cost to commute as a pct. of average income: 20.0% — #12 most out of 50 metro areas
> Annual fuel cost of a workday commute: $8,431 — #23 most
> Annual maintenance cost of commuting: $468 — #8 most
> Potential income lost due to commuting: $4,521 — #31 most

28. Providence, RI
> Annual cost to commute as a pct. of average income: 20.0% — #12 most out of 50 metro areas
> Annual fuel cost of a workday commute: $9,129 — #13 most
> Annual maintenance cost of commuting: $410 — #22 most
> Potential income lost due to commuting: $5,059 — #20 most

27. Birmingham, AL
> Annual cost to commute as a pct. of average income: 19.0% — #21 most out of 50 metro areas
> Annual fuel cost of a workday commute: $7,458 — #35 most
> Annual maintenance cost of commuting: $473 — #7 most
> Potential income lost due to commuting: $4,413 — #35 most
[in-text-ad-2]

26. Jacksonville, FL
> Annual cost to commute as a pct. of average income: 20.0% — #12 most out of 50 metro areas
> Annual fuel cost of a workday commute: $7,802 — #30 most
> Annual maintenance cost of commuting: $426 — #13 most
> Potential income lost due to commuting: $4,290 — #38 most

25. San Jose, CA
> Annual cost to commute as a pct. of average income: 17.0% — #33 most out of 50 metro areas
> Annual fuel cost of a workday commute: $11,541 — #5 most
> Annual maintenance cost of commuting: $300 — #49 most
> Potential income lost due to commuting: $8,528 — #3 most
[in-text-ad]

24. Denver, CO
> Annual cost to commute as a pct. of average income: 18.0% — #27 most out of 50 metro areas
> Annual fuel cost of a workday commute: $8,921 — #17 most
> Annual maintenance cost of commuting: $398 — #31 most
> Potential income lost due to commuting: $5,811 — #11 most

23. New Orleans, LA
> Annual cost to commute as a pct. of average income: 23.0% — #3 most out of 50 metro areas
> Annual fuel cost of a workday commute: $8,778 — #18 most
> Annual maintenance cost of commuting: $290 — #50 most
> Potential income lost due to commuting: $4,178 — #43 most

22. Charlotte, NC
> Annual cost to commute as a pct. of average income: 17.0% — #33 most out of 50 metro areas
> Annual fuel cost of a workday commute: $7,139 — #37 most
> Annual maintenance cost of commuting: $454 — #10 most
> Potential income lost due to commuting: $4,676 — #28 most
[in-text-ad-2]

21. Las Vegas, NV
> Annual cost to commute as a pct. of average income: 21.0% — #10 most out of 50 metro areas
> Annual fuel cost of a workday commute: $7,782 — #31 most
> Annual maintenance cost of commuting: $337 — #45 most
> Potential income lost due to commuting: $3,942 — #47 most

20. Minneapolis, MN
> Annual cost to commute as a pct. of average income: 17.0% — #33 most out of 50 metro areas
> Annual fuel cost of a workday commute: $8,254 — #26 most
> Annual maintenance cost of commuting: $445 — #11 most
> Potential income lost due to commuting: $5,303 — #18 most
[in-text-ad]

19. Austin, TX
> Annual cost to commute as a pct. of average income: 17.0% — #33 most out of 50 metro areas
> Annual fuel cost of a workday commute: $7,609 — #32 most
> Annual maintenance cost of commuting: $402 — #26 most
> Potential income lost due to commuting: $5,025 — #23 most

18. San Antonio, TX
> Annual cost to commute as a pct. of average income: 18.0% — #27 most out of 50 metro areas
> Annual fuel cost of a workday commute: $6,879 — #42 most
> Annual maintenance cost of commuting: $412 — #20 most
> Potential income lost due to commuting: $4,203 — #42 most

17. Portland, OR
> Annual cost to commute as a pct. of average income: 17.0% — #33 most out of 50 metro areas
> Annual fuel cost of a workday commute: $8,277 — #25 most
> Annual maintenance cost of commuting: $332 — #46 most
> Potential income lost due to commuting: $5,385 — #15 most
[in-text-ad-2]

16. Memphis, TN
> Annual cost to commute as a pct. of average income: 19.0% — #21 most out of 50 metro areas
> Annual fuel cost of a workday commute: $6,946 — #39 most
> Annual maintenance cost of commuting: $417 — #18 most
> Potential income lost due to commuting: $3,773 — #49 most

15. Indianapolis, IN
> Annual cost to commute as a pct. of average income: 17.0% — #33 most out of 50 metro areas
> Annual fuel cost of a workday commute: $6,892 — #40 most
> Annual maintenance cost of commuting: $431 — #12 most
> Potential income lost due to commuting: $4,313 — #37 most
[in-text-ad]
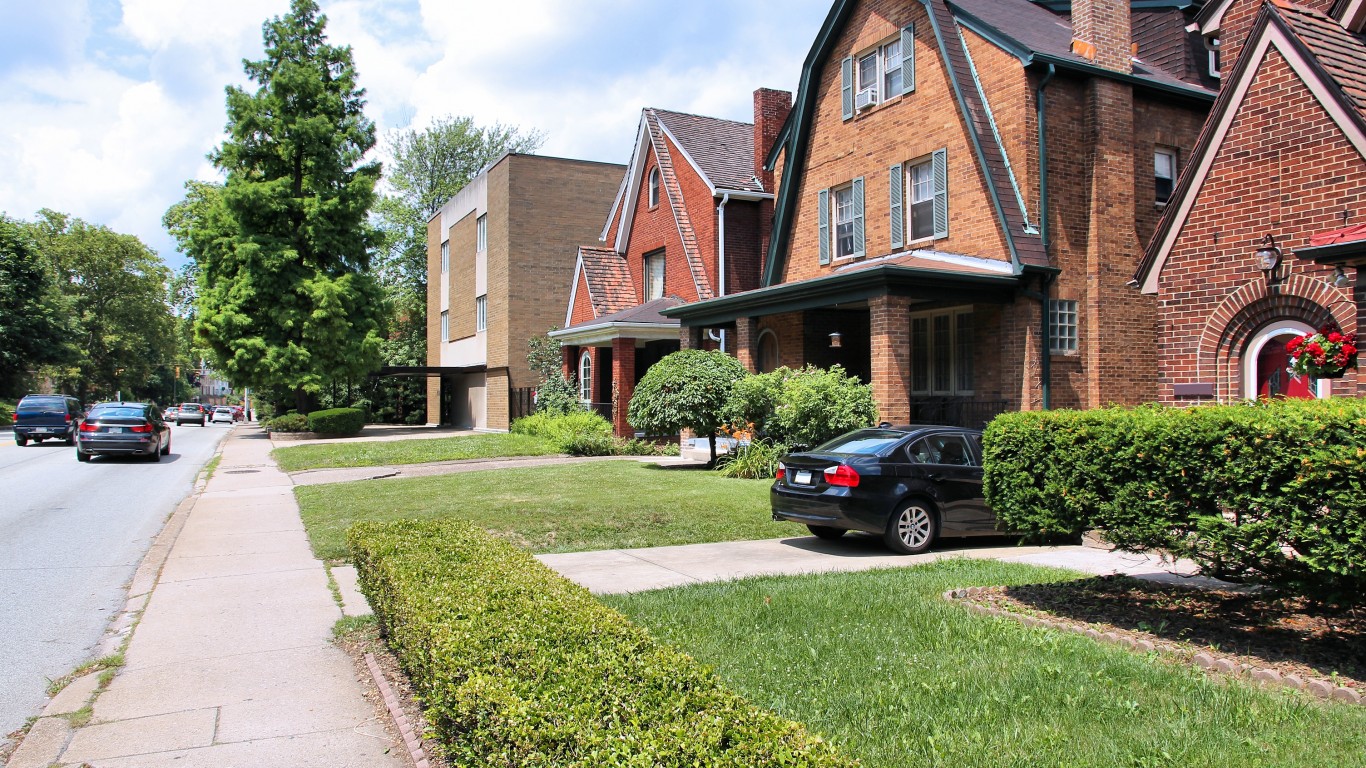
14. Pittsburgh, PA
> Annual cost to commute as a pct. of average income: 17.0% — #33 most out of 50 metro areas
> Annual fuel cost of a workday commute: $7,516 — #34 most
> Annual maintenance cost of commuting: $379 — #35 most
> Potential income lost due to commuting: $4,860 — #24 most

13. Louisville, KY
> Annual cost to commute as a pct. of average income: 19.0% — #21 most out of 50 metro areas
> Annual fuel cost of a workday commute: $7,559 — #33 most
> Annual maintenance cost of commuting: $356 — #41 most
> Potential income lost due to commuting: $3,966 — #46 most

12. Kansas City, MO
> Annual cost to commute as a pct. of average income: 17.0% — #33 most out of 50 metro areas
> Annual fuel cost of a workday commute: $7,404 — #36 most
> Annual maintenance cost of commuting: $417 — #18 most
> Potential income lost due to commuting: $4,230 — #41 most
[in-text-ad-2]

11. Richmond, VA
> Annual cost to commute as a pct. of average income: 16.0% — #41 most out of 50 metro areas
> Annual fuel cost of a workday commute: $6,891 — #41 most
> Annual maintenance cost of commuting: $407 — #24 most
> Potential income lost due to commuting: $4,597 — #30 most

10. Raleigh, NC
> Annual cost to commute as a pct. of average income: 16.0% — #41 most out of 50 metro areas
> Annual fuel cost of a workday commute: $6,984 — #38 most
> Annual maintenance cost of commuting: $398 — #31 most
> Potential income lost due to commuting: $4,857 — #25 most
[in-text-ad]

9. Cincinnati, OH
> Annual cost to commute as a pct. of average income: 16.0% — #41 most out of 50 metro areas
> Annual fuel cost of a workday commute: $6,762 — #45 most
> Annual maintenance cost of commuting: $407 — #24 most
> Potential income lost due to commuting: $4,375 — #36 most

8. Oklahoma City, OK
> Annual cost to commute as a pct. of average income: 18.0% — #27 most out of 50 metro areas
> Annual fuel cost of a workday commute: $6,867 — #43 most
> Annual maintenance cost of commuting: $402 — #26 most
> Potential income lost due to commuting: $3,729 — #50 most

7. Hartford, CT
> Annual cost to commute as a pct. of average income: 16.0% — #41 most out of 50 metro areas
> Annual fuel cost of a workday commute: $8,582 — #22 most
> Annual maintenance cost of commuting: $342 — #44 most
> Potential income lost due to commuting: $5,346 — #16 most
[in-text-ad-2]

6. Columbus, OH
> Annual cost to commute as a pct. of average income: 16.0% — #41 most out of 50 metro areas
> Annual fuel cost of a workday commute: $6,602 — #47 most
> Annual maintenance cost of commuting: $402 — #26 most
> Potential income lost due to commuting: $4,255 — #39 most

5. Cleveland, OH
> Annual cost to commute as a pct. of average income: 16.0% — #41 most out of 50 metro areas
> Annual fuel cost of a workday commute: $6,745 — #46 most
> Annual maintenance cost of commuting: $365 — #38 most
> Potential income lost due to commuting: $4,417 — #34 most
[in-text-ad]

4. Virginia Beach, VA
> Annual cost to commute as a pct. of average income: 15.0% — #48 most out of 50 metro areas
> Annual fuel cost of a workday commute: $6,367 — #50 most
> Annual maintenance cost of commuting: $356 — #41 most
> Potential income lost due to commuting: $4,255 — #39 most

3. Milwaukee, WI
> Annual cost to commute as a pct. of average income: 16.0% — #41 most out of 50 metro areas
> Annual fuel cost of a workday commute: $6,777 — #44 most
> Annual maintenance cost of commuting: $346 — #43 most
> Potential income lost due to commuting: $4,176 — #44 most

2. Salt Lake City, UT
> Annual cost to commute as a pct. of average income: 15.0% (tied)– #48 most out of 50 metro areas
> Annual fuel cost of a workday commute: $6,518 — #48 most
> Annual maintenance cost of commuting: $304 — #47 most
> Potential income lost due to commuting: $4,035 — #45 most
[in-text-ad-2]

1. Buffalo, NY
> Annual cost to commute as a pct. of average income: 15.0% (tied) — #48 most out of 50 metro areas
> Annual fuel cost of a workday commute: $6,427 — #49 most
> Annual maintenance cost of commuting: $304 — #47 most
> Potential income lost due to commuting: $3,783 — #48 most
Methodology
To find the most affordable metros for gas, 24/7 Wall St. reviewed Clever Real Estate’s The Best and Worst Cities for Commuters in 2022. Clever compared the 50 most populous U.S. metro areas across nine metrics.
The metrics are: annual cost to commute as a percentage of the average income in each metro, annual fuel cost of a workday commute per resident, annual hours lost to traffic/congestion, annual maintenance cost of commuting, distance of commute, average annual insurance premium, how much potential annual income is lost to time spent commuting to work, time to work, average miles per hour achieved during commute.
Clever used the following sources for its analysis: the U.S. Bureau of Labor Statistics, the U.S. Department of Transportation Federal Highway Administration, the U.S. Census, the American Automobile Association, the Brookings Institute, INRIX, GasBuddy, and The Zebra.
The Average American Is Losing Their Savings Every Day (Sponsor)
If you’re like many Americans and keep your money ‘safe’ in a checking or savings account, think again. The average yield on a savings account is a paltry .4% today, and inflation is much higher. Checking accounts are even worse.
Every day you don’t move to a high-yield savings account that beats inflation, you lose more and more value.
But there is good news. To win qualified customers, some accounts are paying 9-10x this national average. That’s an incredible way to keep your money safe, and get paid at the same time. Our top pick for high yield savings accounts includes other one time cash bonuses, and is FDIC insured.
Click here to see how much more you could be earning on your savings today. It takes just a few minutes and your money could be working for you.
Thank you for reading! Have some feedback for us?
Contact the 24/7 Wall St. editorial team.
 24/7 Wall St.
 24/7 Wall St.