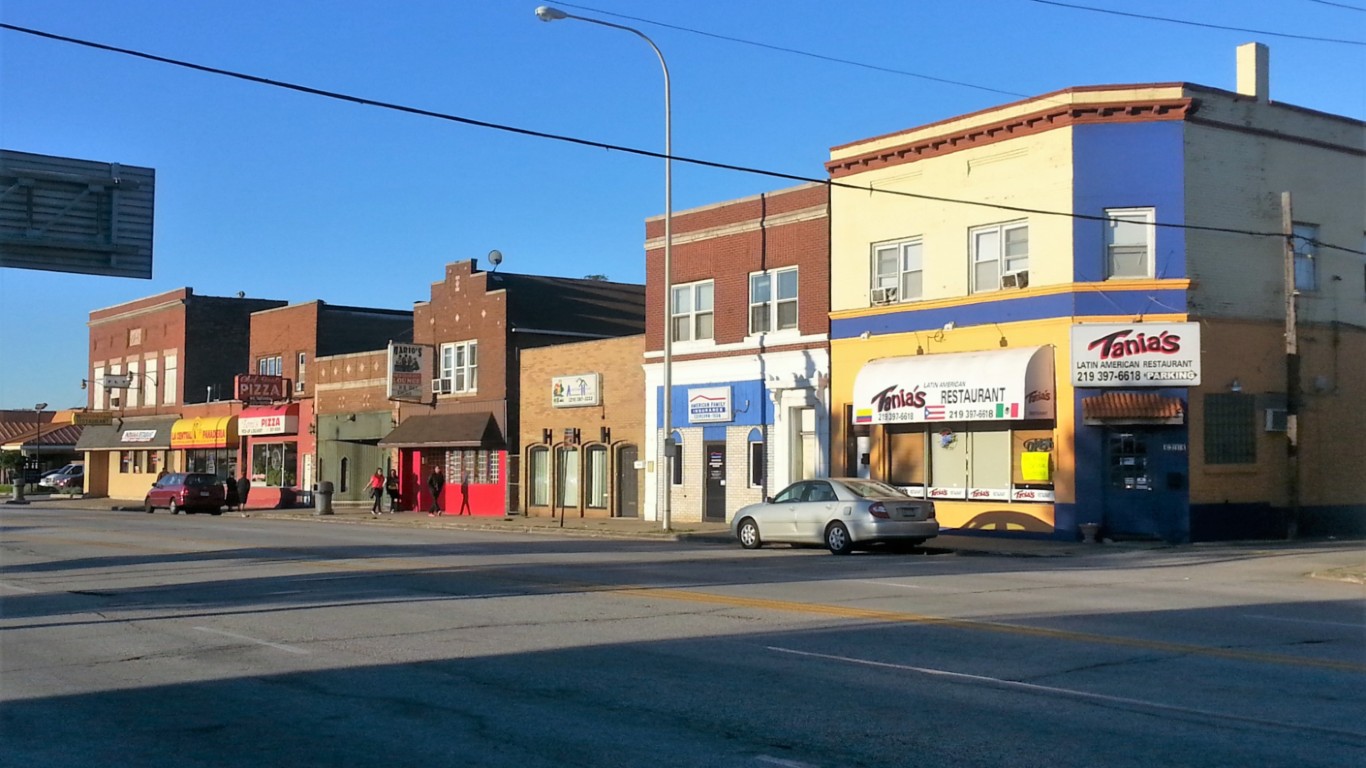
Rents in the United States hit a record high in April, according to real estate listing site Realtor.com, with rents rising 16.7% compared to the previous year. In contrast, over the previous five years, gross rents increased by 18.1%.
Rising housing costs have put a serious squeeze on the millions of Americans, typically younger ones, who already cannot afford to own a home. Many of those who are already being affected by inflation are likely looking to live in cities with more affordable rentals.
To determine the cities with the lowest rent, 24/7 Wall St. reviewed five-year estimates of median gross rent from the U.S. Census Bureau’s 2020 American Community Survey. We defined cities based on a population threshold — places with at least 25,000 in population. The median gross rent across the United States is $1,096, and in the 50 cities on the list, it ranges from $711 to as low as $482.
Ohio has the most places on this list, with eight, followed by Illinois, with seven, and Alabama with four. Half of the cities on this list are in the Midwest, and 19 are in the South, leaving only three each in the Northeast and the Midwest. This roughly reflects the regional differences in housing costs across the country.
Broadly speaking, housing costs reflect the income levels of the population living there. Housing costs tend to be more expensive in wealthier communities, while places with high levels of poverty tend to have cheaper housing. The 50 cities on the list are some of the poorest parts of the country. All have lower median household incomes compared to the national figure of $5,416 per month. In East St. Louis, Illinois, which has the lowest median gross rent, at $482, the typical household has a monthly income of $2,001, the lowest figure out of the 1,778 cities with data available. This is the poorest town in every state.
But even when accounting for these lower incomes, the majority of these cities have more affordable rental units compared to the country as a whole. Nationwide, the annual median gross rent is equivalent to 29.6% of the median household income. In 31 of the 50 cities on this list, median rent accounts for a smaller share of income. In Aberdeen, South Dakota, rent accounts for 22.9% of household income. These are the states with the lowest and highest rent.
Click here to see cities with the cheapest rent
To determine the cities with the lowest rent, 24/7 Wall St. reviewed five-year estimates of median gross rent from the U.S. Census Bureau’s 2020 American Community Survey.
We used census “place” geographies — a category that includes incorporated legal entities and census-designated statistical entities. We defined cities based on a population threshold — census places needed to have a population of at least 25,000 to be considered.
Cities were excluded if median gross rent was not available in the 2020 ACS, if there were fewer than 500 renter-occupied housing units, or if the sampling error associated with a city’s data was deemed too high.
The sampling error was defined as too high if the coefficient of variation — a statistical assessment of how reliable an estimate is — for a city’s median gross rent was above 15% and greater than two standard deviations above the mean CV for all cities’ median gross rents. We similarly excluded cities that had a sampling error too high for their population, using the same definition.
Cities were ranked based on the median gross rent. To break ties, we used the median gross rent as a share of household income.
Additional information on median gross rent as a share of household income, share of households occupied by renters, and median home value are also five-year estimates from the 2020 ACS.

50. Monroe, Louisiana
> Median monthly rental cost: $711
> Share of income typically spent on rent: 36.6% — 131st highest of 1,778 cities (tied)
> Rental occupied housing units: 57.4% — 175th highest of 1,778 cities
> Median home value: $150,000 — 318th lowest of 1,778 cities (tied)
[in-text-ad]

49. Massillon, Ohio
> Median monthly rental cost: $711
> Share of income typically spent on rent: 27.3% — 366th lowest of 1,778 cities (tied)
> Rental occupied housing units: 36.6% — 767th lowest of 1,778 cities
> Median home value: $107,400 — 114th lowest of 1,778 cities
48. Meridian, Mississippi
> Median monthly rental cost: $709
> Share of income typically spent on rent: 31.0% — 697th highest of 1,778 cities (tied)
> Rental occupied housing units: 52.7% — 298th highest of 1,778 cities
> Median home value: $84,300 — 47th lowest of 1,778 cities

47. Bristol, Tennessee
> Median monthly rental cost: $709
> Share of income typically spent on rent: 27.1% — 336th lowest of 1,778 cities (tied)
> Rental occupied housing units: 34.4% — 659th lowest of 1,778 cities
> Median home value: $135,800 — 252nd lowest of 1,778 cities (tied)
[in-text-ad-2]

46. Sheboygan, Wisconsin
> Median monthly rental cost: $708
> Share of income typically spent on rent: 25.3% — 158th lowest of 1,778 cities (tied)
> Rental occupied housing units: 41.2% — 788th highest of 1,778 cities
> Median home value: $121,600 — 167th lowest of 1,778 cities (tied)

45. Thomasville, North Carolina
> Median monthly rental cost: $707
> Share of income typically spent on rent: 31.3% — 652nd highest of 1,778 cities (tied)
> Rental occupied housing units: 40.6% — 818th highest of 1,778 cities
> Median home value: $118,000 — 149th lowest of 1,778 cities
[in-text-ad]
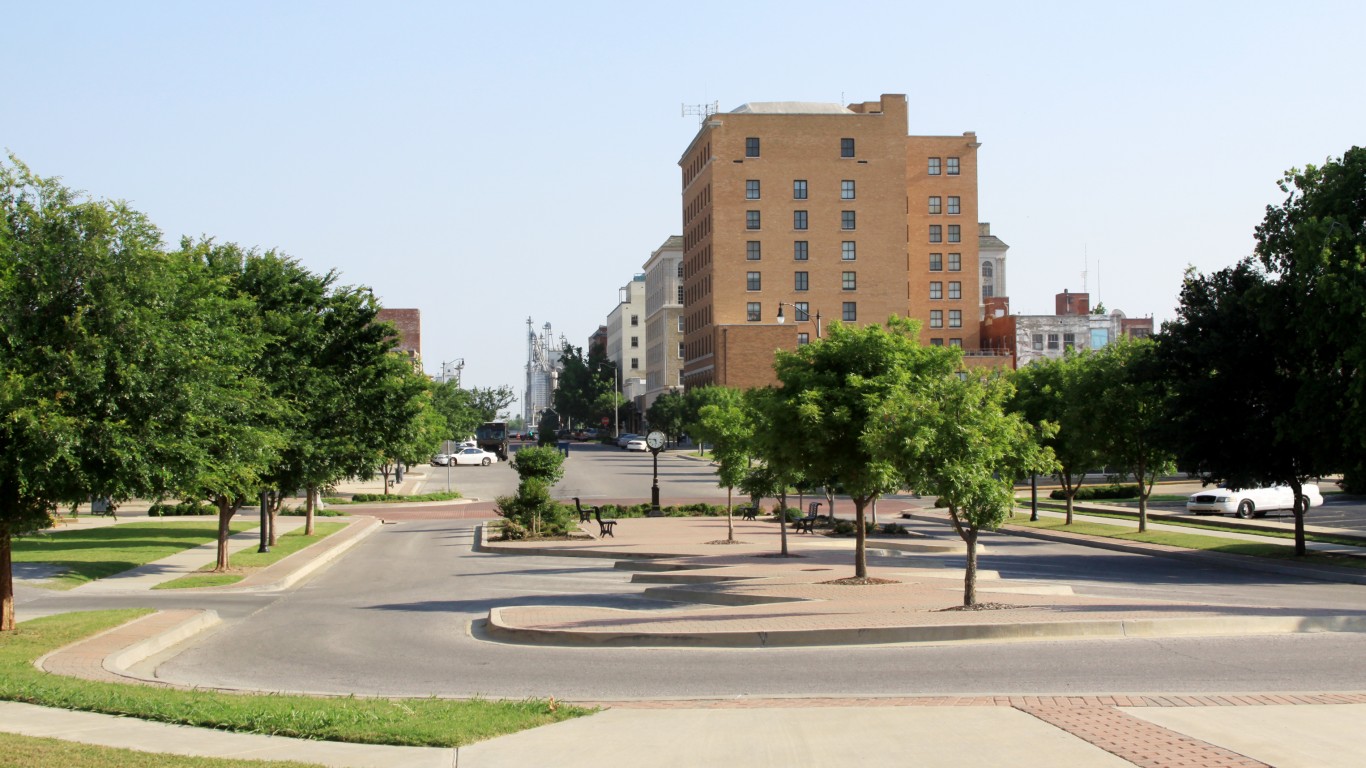
44. Shawnee, Oklahoma
> Median monthly rental cost: $707
> Share of income typically spent on rent: 25.8% — 199th lowest of 1,778 cities (tied)
> Rental occupied housing units: 42.9% — 699th highest of 1,778 cities
> Median home value: $113,300 — 135th lowest of 1,778 cities

43. Zanesville, Ohio
> Median monthly rental cost: $706
> Share of income typically spent on rent: 31.6% — 614th highest of 1,778 cities (tied)
> Rental occupied housing units: 55.7% — 214th highest of 1,778 cities
> Median home value: $81,700 — 40th lowest of 1,778 cities

42. Canton, Ohio
> Median monthly rental cost: $705
> Share of income typically spent on rent: 30.1% — 849th highest of 1,778 cities (tied)
> Rental occupied housing units: 52.3% — 311th highest of 1,778 cities
> Median home value: $73,300 — 18th lowest of 1,778 cities
[in-text-ad-2]

41. Richmond, Indiana
> Median monthly rental cost: $704
> Share of income typically spent on rent: 26.8% — 305th lowest of 1,778 cities (tied)
> Rental occupied housing units: 46.2% — 549th highest of 1,778 cities
> Median home value: $86,300 — 51st lowest of 1,778 cities

40. Fort Smith, Arkansas
> Median monthly rental cost: $703
> Share of income typically spent on rent: 26.1% — 239th lowest of 1,778 cities (tied)
> Rental occupied housing units: 49.4% — 418th highest of 1,778 cities
> Median home value: $132,800 — 232nd lowest of 1,778 cities (tied)
[in-text-ad]
39. Austintown, Ohio
> Median monthly rental cost: $703
> Share of income typically spent on rent: 25.9% — 212th lowest of 1,778 cities (tied)
> Rental occupied housing units: 34.5% — 668th lowest of 1,778 cities
> Median home value: $101,900 — 102nd lowest of 1,778 cities

38. Altoona, Pennsylvania
> Median monthly rental cost: $701
> Share of income typically spent on rent: 31.8% — 583rd highest of 1,778 cities (tied)
> Rental occupied housing units: 36.8% — 776th lowest of 1,778 cities
> Median home value: $92,900 — 68th lowest of 1,778 cities
37. Carbondale, Illinois
> Median monthly rental cost: $698
> Share of income typically spent on rent: 40.1% — 48th highest of 1,778 cities (tied)
> Rental occupied housing units: 71.3% — 27th highest of 1,778 cities
> Median home value: $122,700 — 174th lowest of 1,778 cities
[in-text-ad-2]

36. Russellville, Arkansas
> Median monthly rental cost: $695
> Share of income typically spent on rent: 30.3% — 815th highest of 1,778 cities (tied)
> Rental occupied housing units: 41.6% — 766th highest of 1,778 cities
> Median home value: $133,100 — 235th lowest of 1,778 cities

35. Decatur, Alabama
> Median monthly rental cost: $692
> Share of income typically spent on rent: 28.0% — 485th lowest of 1,778 cities (tied)
> Rental occupied housing units: 35.6% — 730th lowest of 1,778 cities
> Median home value: $141,000 — 272nd lowest of 1,778 cities
[in-text-ad]

34. Quincy, Illinois
> Median monthly rental cost: $688
> Share of income typically spent on rent: 29.0% — 680th lowest of 1,778 cities (tied)
> Rental occupied housing units: 36.5% — 763rd lowest of 1,778 cities
> Median home value: $118,800 — 153rd lowest of 1,778 cities (tied)

33. Decatur, Illinois
> Median monthly rental cost: $688
> Share of income typically spent on rent: 28.9% — 655th lowest of 1,778 cities (tied)
> Rental occupied housing units: 38.2% — 852nd lowest of 1,778 cities
> Median home value: $85,500 — 49th lowest of 1,778 cities (tied)
32. Danville, Virginia
> Median monthly rental cost: $688
> Share of income typically spent on rent: 28.2% — 513th lowest of 1,778 cities (tied)
> Rental occupied housing units: 49.7% — 401st highest of 1,778 cities
> Median home value: $95,500 — 74th lowest of 1,778 cities
[in-text-ad-2]

31. Lima, Ohio
> Median monthly rental cost: $687
> Share of income typically spent on rent: 30.1% — 849th highest of 1,778 cities (tied)
> Rental occupied housing units: 53.6% — 267th highest of 1,778 cities
> Median home value: $68,900 — 12th lowest of 1,778 cities

30. Henderson, Kentucky
> Median monthly rental cost: $687
> Share of income typically spent on rent: 27.2% — 352nd lowest of 1,778 cities (tied)
> Rental occupied housing units: 48.4% — 452nd highest of 1,778 cities
> Median home value: $119,800 — 159th lowest of 1,778 cities
[in-text-ad]

29. Marion, Indiana
> Median monthly rental cost: $685
> Share of income typically spent on rent: 29.5% — 778th lowest of 1,778 cities (tied)
> Rental occupied housing units: 44.2% — 638th highest of 1,778 cities
> Median home value: $69,800 — 14th lowest of 1,778 cities
28. Asheboro, North Carolina
> Median monthly rental cost: $685
> Share of income typically spent on rent: 27.4% — 385th lowest of 1,778 cities (tied)
> Rental occupied housing units: 51.4% — 345th highest of 1,778 cities
> Median home value: $119,700 — 157th lowest of 1,778 cities (tied)

27. Muskogee, Oklahoma
> Median monthly rental cost: $683
> Share of income typically spent on rent: 29.5% — 778th lowest of 1,778 cities (tied)
> Rental occupied housing units: 46.4% — 538th highest of 1,778 cities
> Median home value: $98,800 — 90th lowest of 1,778 cities
[in-text-ad-2]
26. Danville, Illinois
> Median monthly rental cost: $680
> Share of income typically spent on rent: 29.7% — 822nd lowest of 1,778 cities (tied)
> Rental occupied housing units: 41.5% — 774th highest of 1,778 cities
> Median home value: $67,200 — 8th lowest of 1,778 cities

25. Butte-Silver Bow, Montana
> Median monthly rental cost: $678
> Share of income typically spent on rent: 28.2% — 513th lowest of 1,778 cities (tied)
> Rental occupied housing units: 30.5% — 514th lowest of 1,778 cities
> Median home value: $156,400 — 356th lowest of 1,778 cities
[in-text-ad]

24. Manitowoc, Wisconsin
> Median monthly rental cost: $672
> Share of income typically spent on rent: 23.1% — 29th lowest of 1,778 cities (tied)
> Rental occupied housing units: 33.0% — 610th lowest of 1,778 cities
> Median home value: $112,000 — 129th lowest of 1,778 cities

23. Parkersburg, West Virginia
> Median monthly rental cost: $671
> Share of income typically spent on rent: 31.2% — 664th highest of 1,778 cities (tied)
> Rental occupied housing units: 38.9% — 884th lowest of 1,778 cities
> Median home value: $89,800 — 57th lowest of 1,778 cities

22. Pekin, Illinois
> Median monthly rental cost: $671
> Share of income typically spent on rent: 26.9% — 314th lowest of 1,778 cities (tied)
> Rental occupied housing units: 31.4% — 546th lowest of 1,778 cities
> Median home value: $104,000 — 105th lowest of 1,778 cities
[in-text-ad-2]

21. Eagle Pass, Texas
> Median monthly rental cost: $669
> Share of income typically spent on rent: 25.4% — 167th lowest of 1,778 cities (tied)
> Rental occupied housing units: 42.5% — 724th highest of 1,778 cities
> Median home value: $129,900 — 207th lowest of 1,778 cities
20. Aberdeen, South Dakota
> Median monthly rental cost: $669
> Share of income typically spent on rent: 22.9% — 25th lowest of 1,778 cities (tied)
> Rental occupied housing units: 42.4% — 729th highest of 1,778 cities
> Median home value: $169,400 — 455th lowest of 1,778 cities
[in-text-ad]

19. Kingsport, Tennessee
> Median monthly rental cost: $666
> Share of income typically spent on rent: 28.6% — 582nd lowest of 1,778 cities (tied)
> Rental occupied housing units: 37.9% — 840th lowest of 1,778 cities
> Median home value: $149,100 — 313th lowest of 1,778 cities

18. Pocatello, Idaho
> Median monthly rental cost: $661
> Share of income typically spent on rent: 27.2% — 352nd lowest of 1,778 cities (tied)
> Rental occupied housing units: 37.0% — 787th lowest of 1,778 cities
> Median home value: $154,000 — 341st lowest of 1,778 cities
17. Warren, Ohio
> Median monthly rental cost: $658
> Share of income typically spent on rent: 38.1% — 89th highest of 1,778 cities (tied)
> Rental occupied housing units: 48.0% — 469th highest of 1,778 cities
> Median home value: $66,100 — 6th lowest of 1,778 cities
[in-text-ad-2]
16. East Chicago, Indiana
> Median monthly rental cost: $658
> Share of income typically spent on rent: 27.9% — 471st lowest of 1,778 cities (tied)
> Rental occupied housing units: 56.2% — 200th highest of 1,778 cities
> Median home value: $73,100 — 17th lowest of 1,778 cities
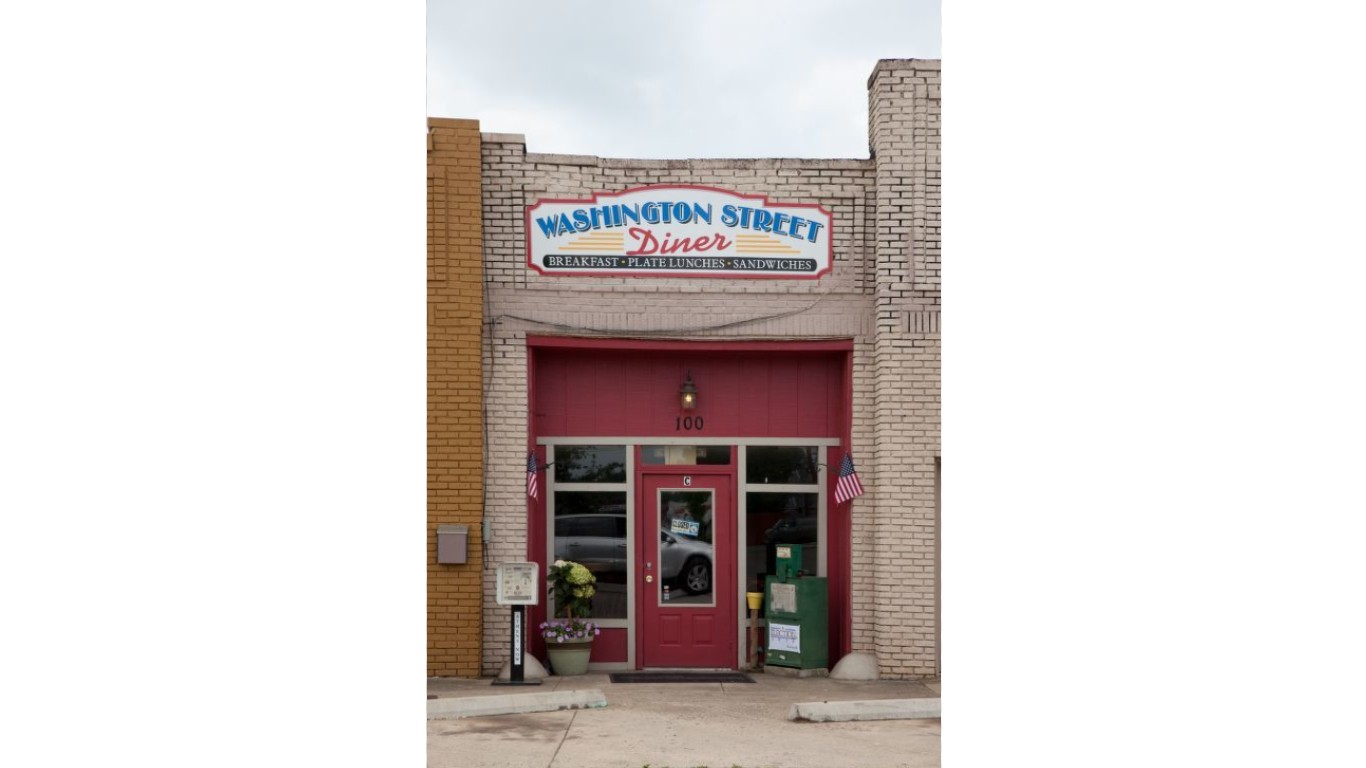
15. Athens, Alabama
> Median monthly rental cost: $657
> Share of income typically spent on rent: 26.2% — 245th lowest of 1,778 cities (tied)
> Rental occupied housing units: 34.1% — 651st lowest of 1,778 cities
> Median home value: $171,900 — 474th lowest of 1,778 cities (tied)
[in-text-ad]
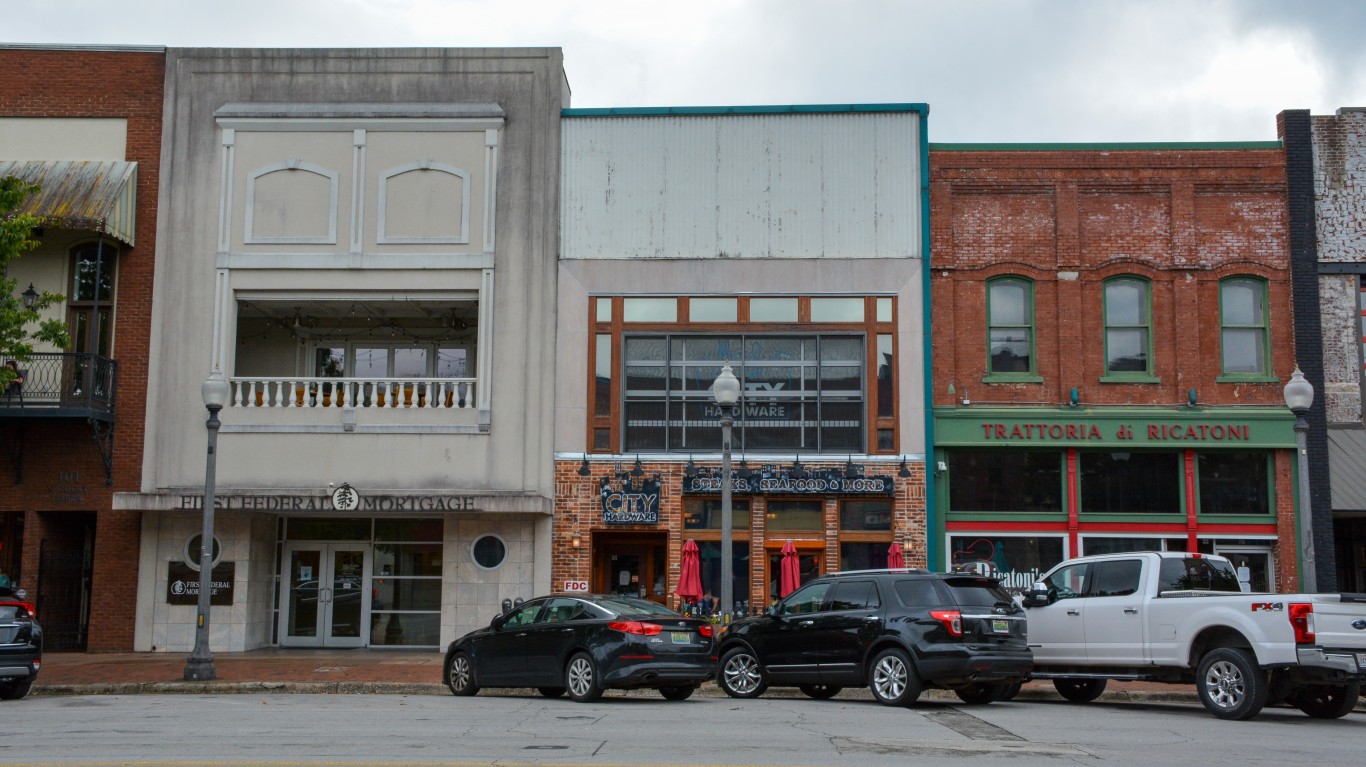
14. Florence, Alabama
> Median monthly rental cost: $655
> Share of income typically spent on rent: 27.7% — 428th lowest of 1,778 cities (tied)
> Rental occupied housing units: 49.5% — 413th highest of 1,778 cities
> Median home value: $142,000 — 274th lowest of 1,778 cities (tied)

13. Jefferson City, Missouri
> Median monthly rental cost: $653
> Share of income typically spent on rent: 24.3% — 85th lowest of 1,778 cities (tied)
> Rental occupied housing units: 42.9% — 702nd highest of 1,778 cities
> Median home value: $161,400 — 397th lowest of 1,778 cities
12. Clinton, Iowa
> Median monthly rental cost: $652
> Share of income typically spent on rent: 31.9% — 562nd highest of 1,778 cities (tied)
> Rental occupied housing units: 31.7% — 555th lowest of 1,778 cities
> Median home value: $100,800 — 97th lowest of 1,778 cities
[in-text-ad-2]

11. Niagara Falls, New York
> Median monthly rental cost: $649
> Share of income typically spent on rent: 31.6% — 614th highest of 1,778 cities (tied)
> Rental occupied housing units: 41.4% — 783rd highest of 1,778 cities
> Median home value: $78,500 — 30th lowest of 1,778 cities
10. San Luis, Arizona
> Median monthly rental cost: $649
> Share of income typically spent on rent: 25.3% — 158th lowest of 1,778 cities (tied)
> Rental occupied housing units: 33.6% — 630th lowest of 1,778 cities
> Median home value: $128,500 — 196th lowest of 1,778 cities (tied)
[in-text-ad]

9. Winona, Minnesota
> Median monthly rental cost: $648
> Share of income typically spent on rent: 28.8% — 631st lowest of 1,778 cities (tied)
> Rental occupied housing units: 35.9% — 742nd lowest of 1,778 cities
> Median home value: $153,500 — 338th lowest of 1,778 cities

8. Wheeling, West Virginia
> Median monthly rental cost: $645
> Share of income typically spent on rent: 31.9% — 562nd highest of 1,778 cities (tied)
> Rental occupied housing units: 40.4% — 831st highest of 1,778 cities
> Median home value: $110,900 — 125th lowest of 1,778 cities

7. Gadsden, Alabama
> Median monthly rental cost: $645
> Share of income typically spent on rent: 29.5% — 778th lowest of 1,778 cities (tied)
> Rental occupied housing units: 41.8% — 761st highest of 1,778 cities
> Median home value: $80,400 — 35th lowest of 1,778 cities (tied)
[in-text-ad-2]

6. Mansfield, Ohio
> Median monthly rental cost: $640
> Share of income typically spent on rent: 28.6% — 582nd lowest of 1,778 cities (tied)
> Rental occupied housing units: 51.4% — 346th highest of 1,778 cities
> Median home value: $80,300 — 34th lowest of 1,778 cities
5. Youngstown, Ohio
> Median monthly rental cost: $638
> Share of income typically spent on rent: 33.2% — 382nd highest of 1,778 cities (tied)
> Rental occupied housing units: 43.8% — 655th highest of 1,778 cities
> Median home value: $46,900 — 3rd lowest of 1,778 cities
[in-text-ad]

4. Bay City, Michigan
> Median monthly rental cost: $635
> Share of income typically spent on rent: 29.2% — 727th lowest of 1,778 cities (tied)
> Rental occupied housing units: 32.4% — 586th lowest of 1,778 cities
> Median home value: $68,000 — 9th lowest of 1,778 cities
3. Galesburg, Illinois
> Median monthly rental cost: $622
> Share of income typically spent on rent: 31.7% — 599th highest of 1,778 cities (tied)
> Rental occupied housing units: 42.2% — 737th highest of 1,778 cities
> Median home value: $76,400 — 24th lowest of 1,778 cities

2. Jamestown, New York
> Median monthly rental cost: $611
> Share of income typically spent on rent: 33.1% — 399th highest of 1,778 cities (tied)
> Rental occupied housing units: 51.6% — 338th highest of 1,778 cities
> Median home value: $66,400 — 7th lowest of 1,778 cities
[in-text-ad-2]
1. East St. Louis, Illinois
> Median monthly rental cost: $482
> Share of income typically spent on rent: 32.3% — 501st highest of 1,778 cities (tied)
> Rental occupied housing units: 50.7% — 363rd highest of 1,778 cities
> Median home value: $53,900 — 5th lowest of 1,778 cities
Are You Ahead, or Behind on Retirement? (sponsor)
If you’re one of the over 4 Million Americans set to retire this year, you may want to pay attention.
Finding a financial advisor who puts your interest first can be the difference between a rich retirement and barely getting by, and today it’s easier than ever. SmartAsset’s free tool matches you with up to three fiduciary financial advisors that serve your area in minutes. Each advisor has been carefully vetted, and must act in your best interests. Start your search now.
Don’t waste another minute; get started right here and help your retirement dreams become a retirement reality.
Thank you for reading! Have some feedback for us?
Contact the 24/7 Wall St. editorial team.



 24/7 Wall St.
 24/7 Wall St.
