The United States has long prided itself as a melting pot country, and for good reason. According to the United Nations, as of 2015, about one in five of the world’s migrants lived in the U.S.
In relation to the entire population, the share of foreign-born U.S. residents is modest compared to other immigrant-attracting countries like Canada and Australia. Also, the diversity of immigrants is relatively lower, with about one in four U.S. immigrants originating from neighboring Mexico, according to the Pew Research Center.
Still, the overall diversity of the American population, when considering race and ethnicity, is increasing. Nearly four out of 10 Americans identify with a race or ethnic group other than white, according to the Census Bureau. And the chance that two people chosen at random nationwide will be from different racial or ethnic groups has increased to 61.1% in 2020 from 54.9% in 2010.
While large metropolitan areas are generally considered more diverse than smaller cities, many smaller U.S. cities have become more diverse. U.S. News and World Report analyzed 2020 Census data for cities with populations over 300,000 and found that 70% of them were more racially diverse than a decade earlier. (These are the worst cities for Black Americans.)
To determine America’s most diverse mid-size cities, 24/7 Wall St. reviewed data on race and ethnicity from the U.S. Census Bureau. Cities with between 150,000 and 450,000 residents were ranked based on the probability that two residents picked at random will be of different race or ethnicity. (These are the most segregated cities in America.)
The chances that two randomly selected people will be of different race or ethnicity in the cities on our list is at least 67%. Such cities include Rochester, New York; Tampa, Florida, and Garland, Texas. The chances of two randomly selected people in North Las Vegas (population 241,369) to be different by race or ethnicity is now over 70%.
In the No. 1 city, Oakland, California, the chances are nearly 77%. The Bay Area city is the largest on the list in terms of population. And based on recent Census data, about 28% of the population are white, 27% are Hispanic or Latino, nearly 24% are Black or African American, and over 15% are Asian.
Click here to see the most diverse mid-sized cities
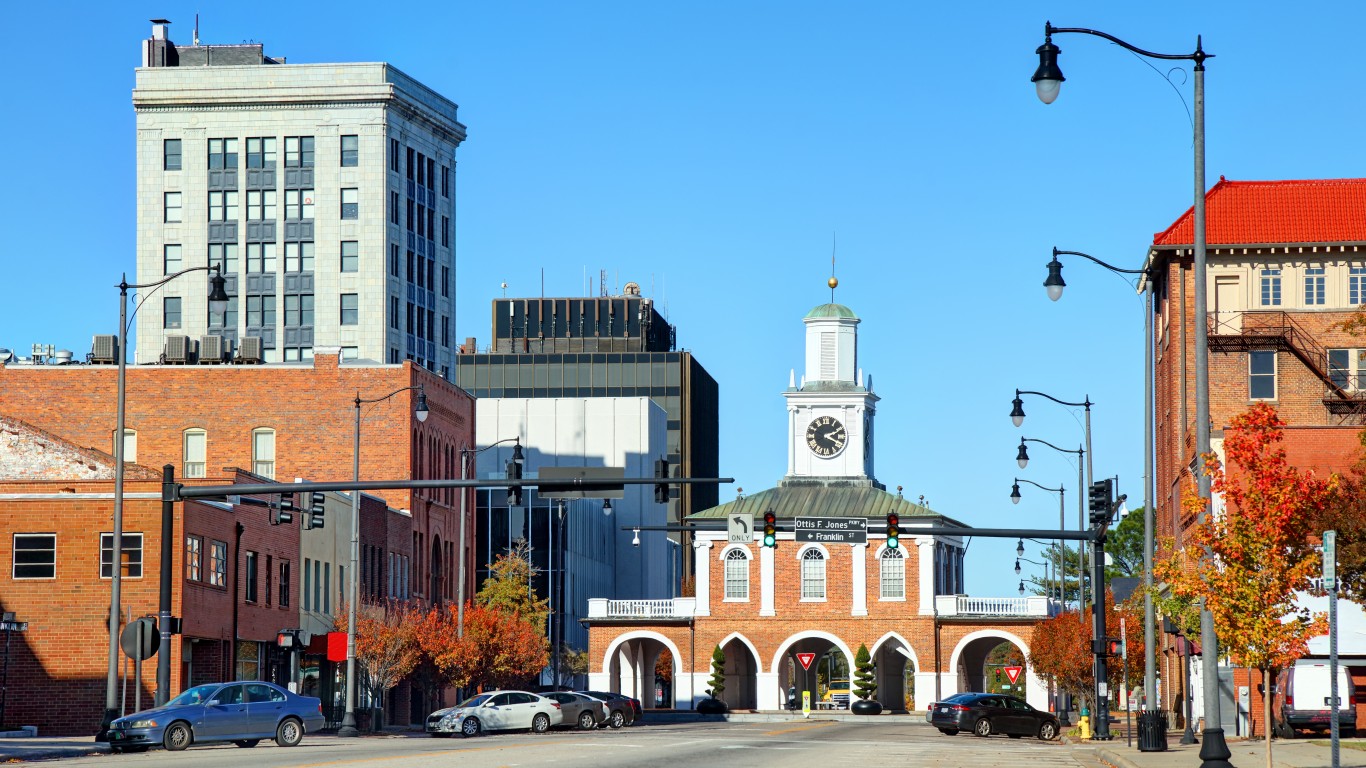
25. Fayetteville, North Carolina
> Likelihood two random residents are different race or ethnicity: 67.3%
> Total population: 210,432
[in-text-ad]
24. Grand Prairie, Texas
> Likelihood two random residents are different race or ethnicity: 67.5%
> Total population: 192,565
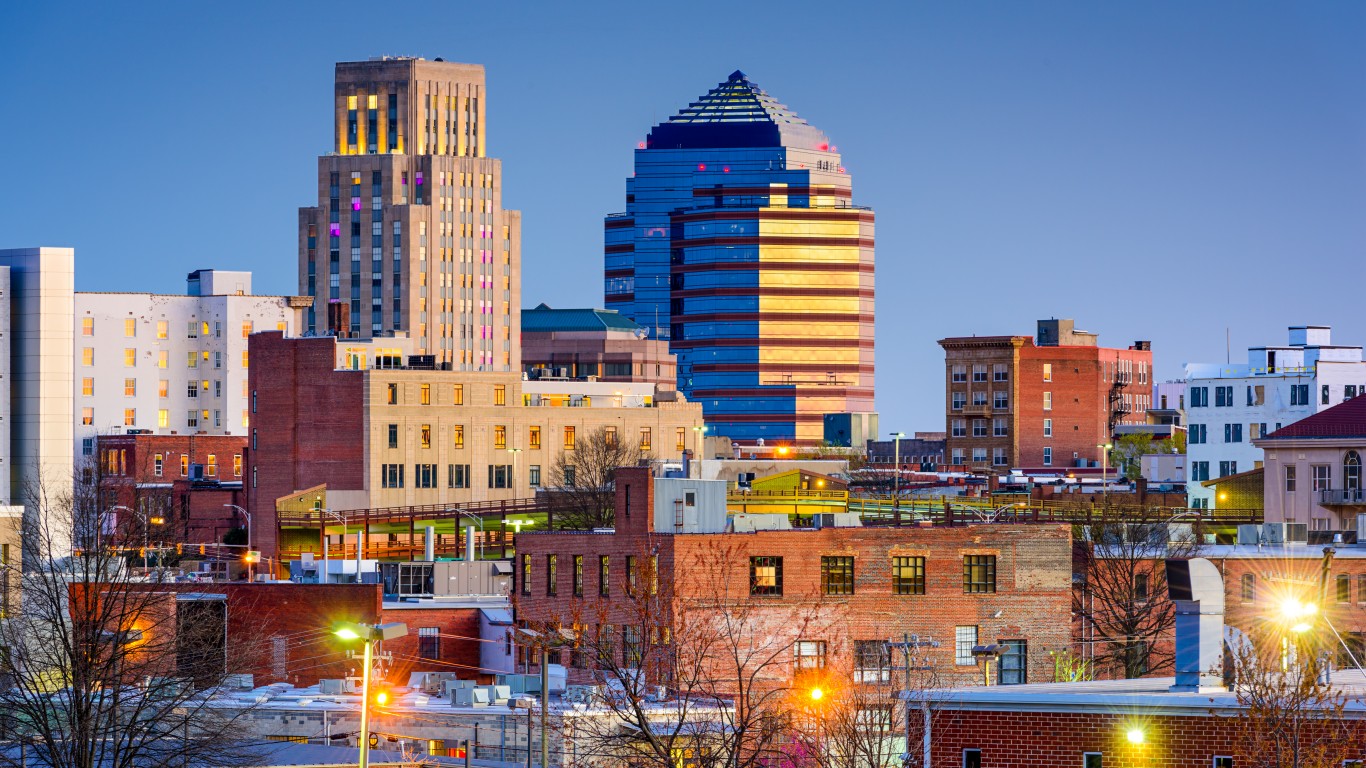
23. Durham, North Carolina
> Likelihood two random residents are different race or ethnicity: 67.7%
> Total population: 269,702
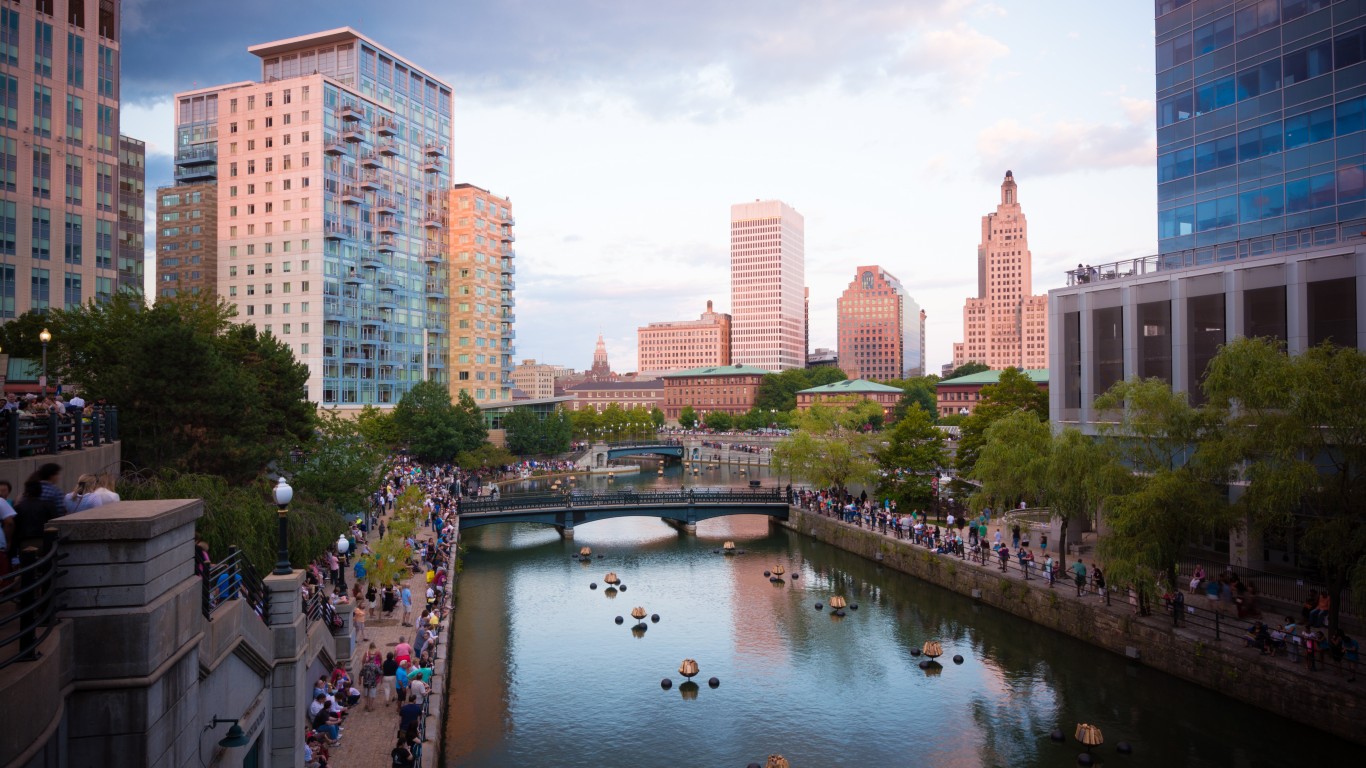
22. Providence, Rhode Island
> Likelihood two random residents are different race or ethnicity: 67.9%
> Total population: 179,494
[in-text-ad-2]
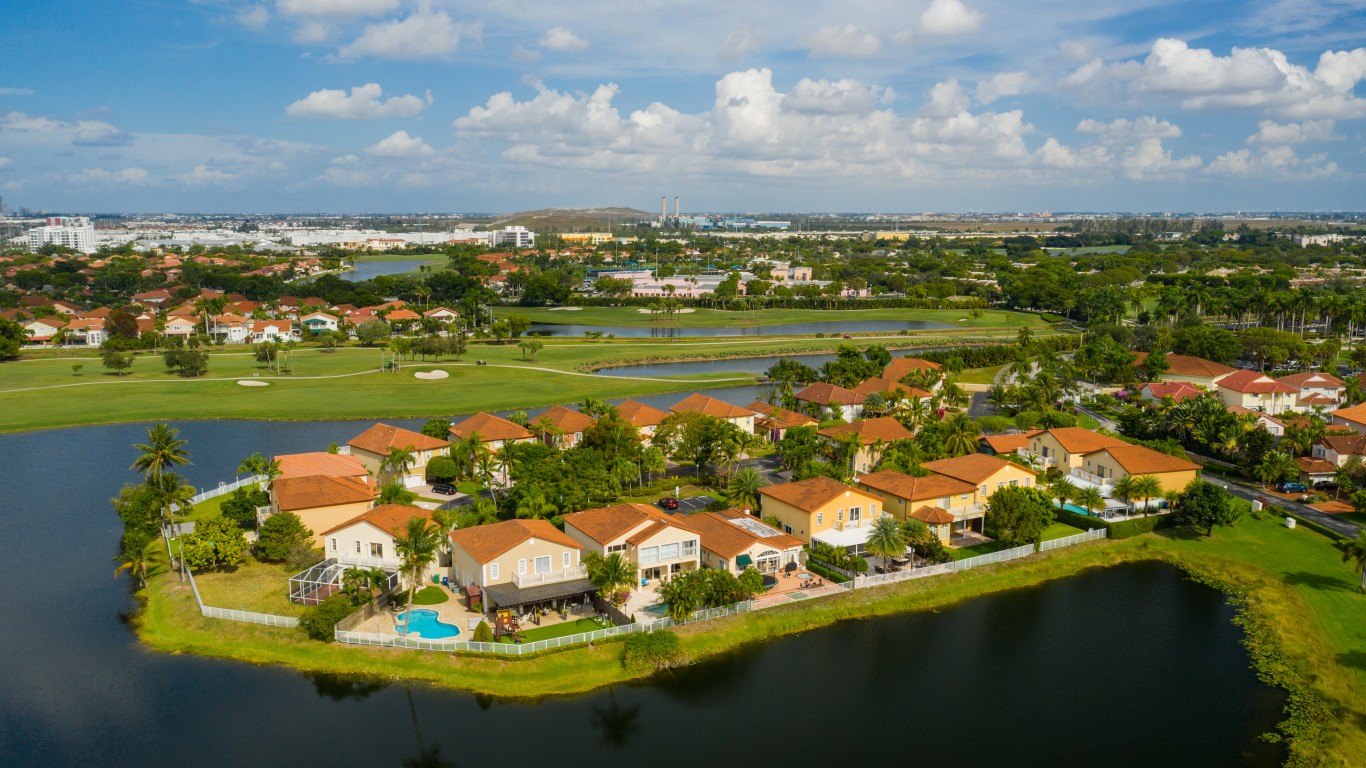
21. Pembroke Pines, Florida
> Likelihood two random residents are different race or ethnicity: 68.1%
> Total population: 170,072
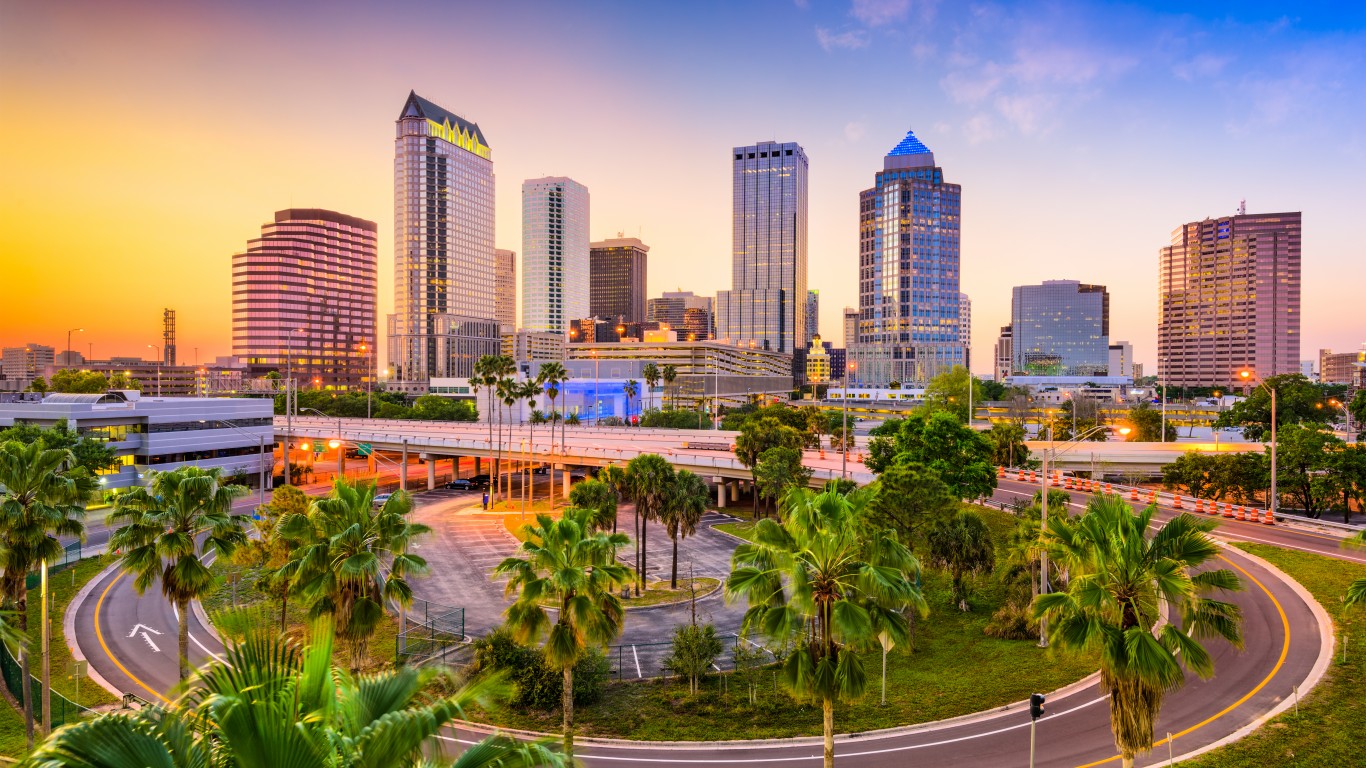
20. Tampa, Florida
> Likelihood two random residents are different race or ethnicity: 68.1%
> Total population: 387,916
[in-text-ad]
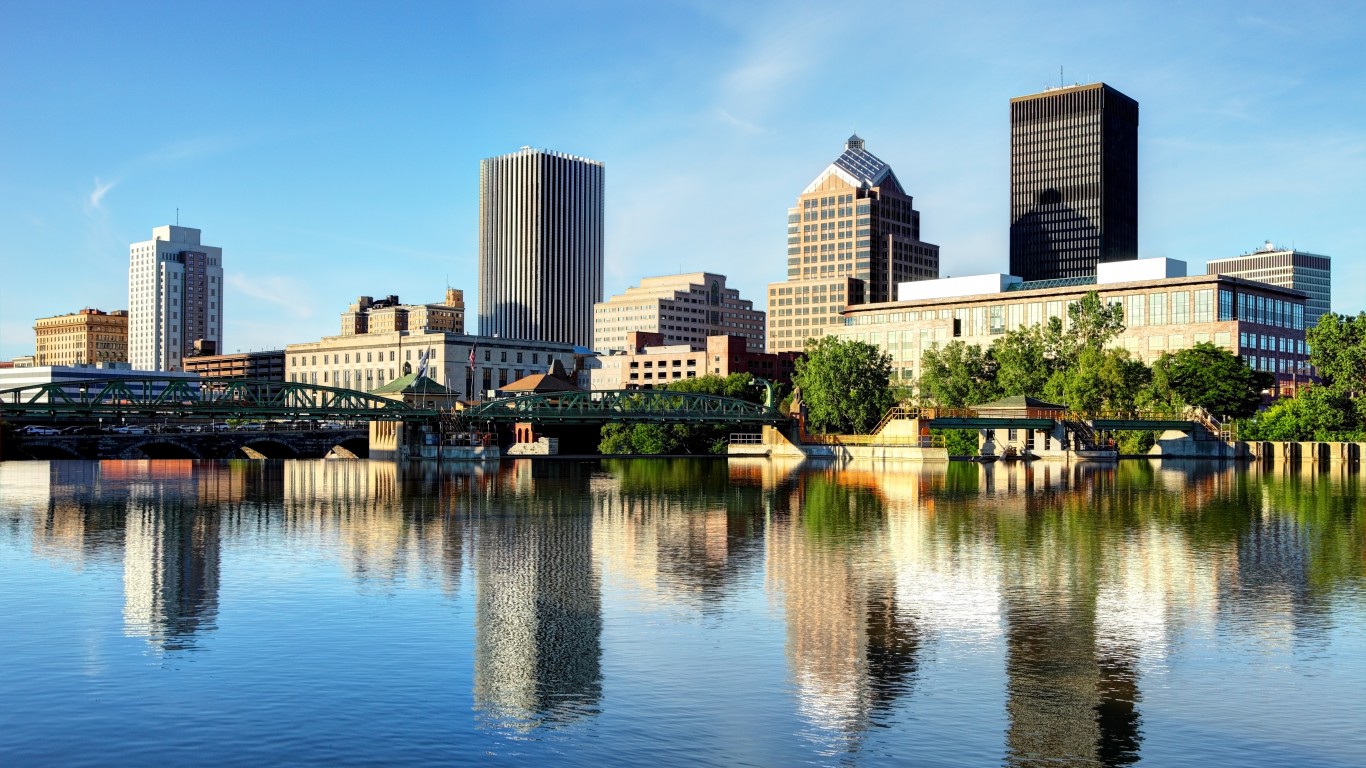
19. Rochester, New York
> Likelihood two random residents are different race or ethnicity: 68.5%
> Total population: 206,848
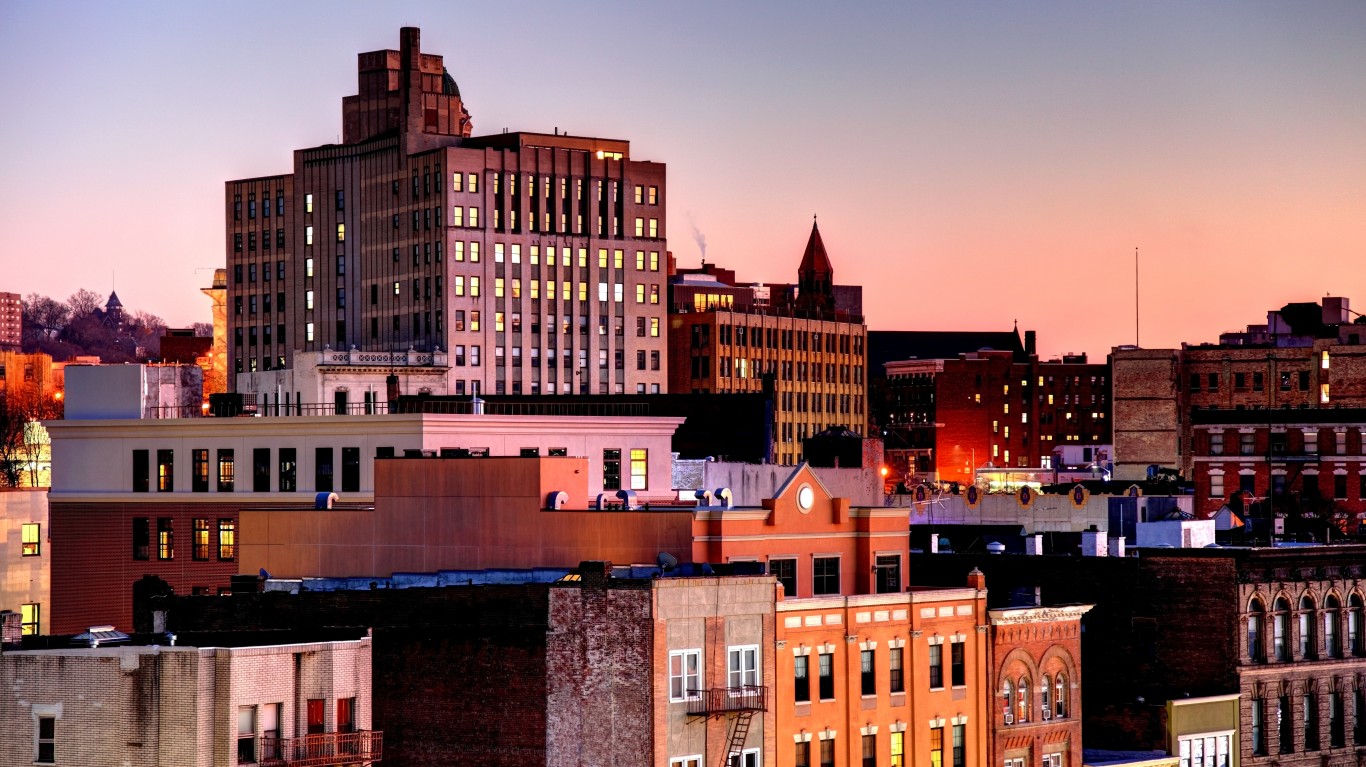
18. Yonkers, New York
> Likelihood two random residents are different race or ethnicity: 68.8%
> Total population: 199,968

17. Aurora, Colorado
> Likelihood two random residents are different race or ethnicity: 69.1%
> Total population: 369,111
[in-text-ad-2]
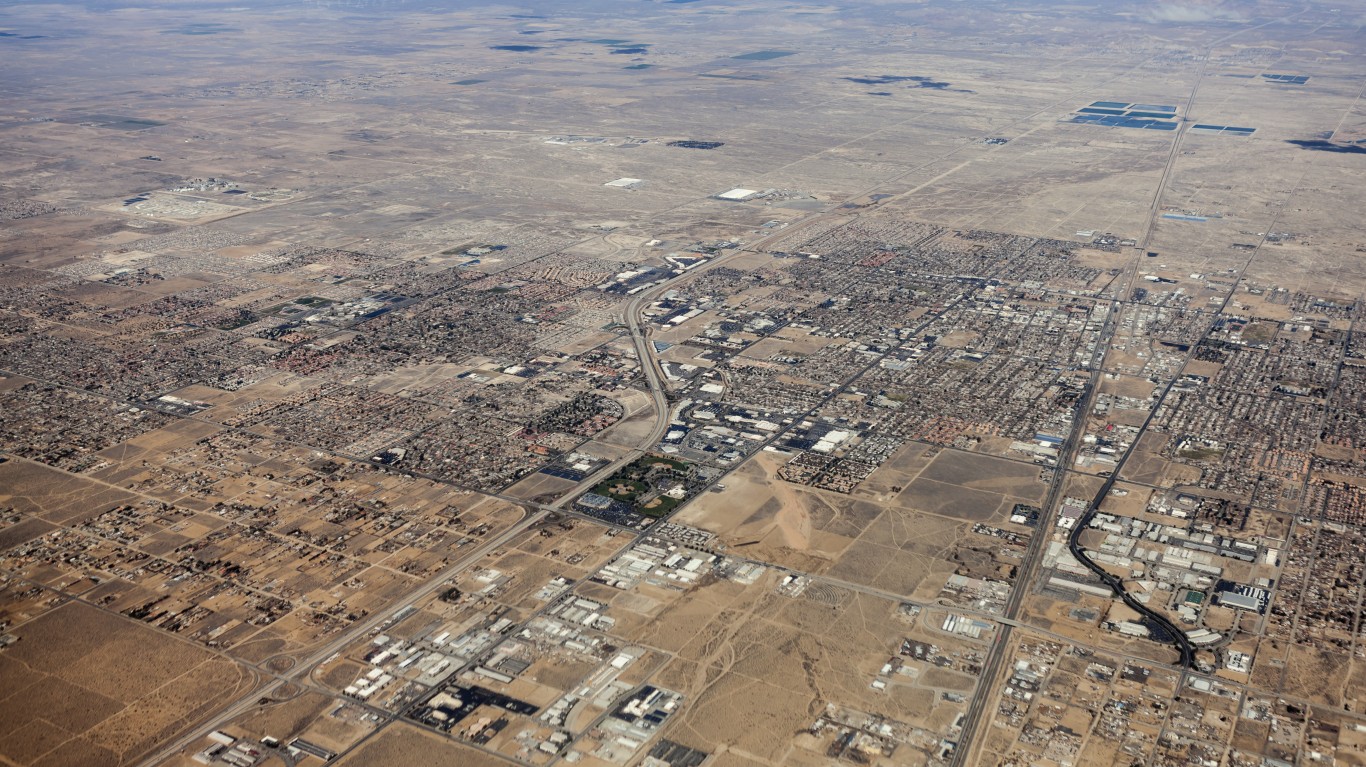
16. Lancaster, California
> Likelihood two random residents are different race or ethnicity: 69.2%
> Total population: 159,028
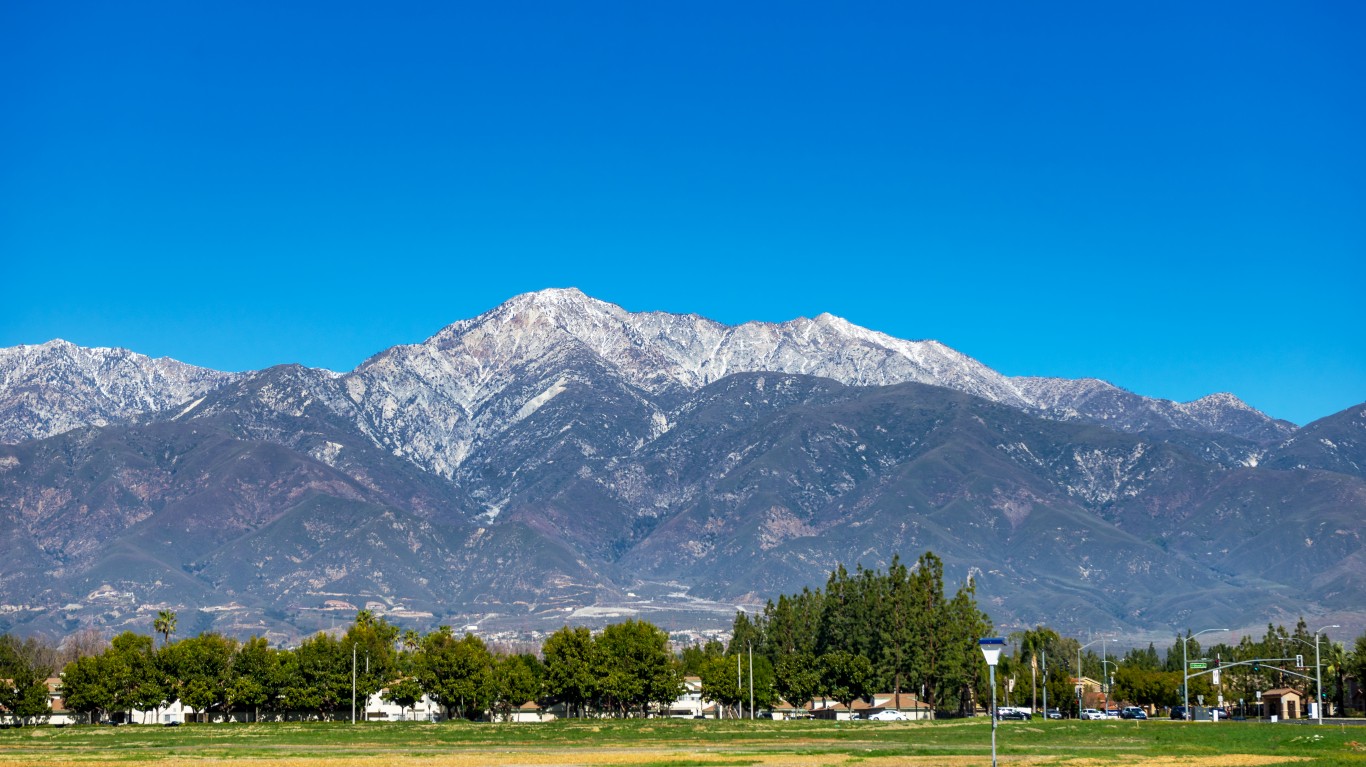
15. Rancho Cucamonga, California
> Likelihood two random residents are different race or ethnicity: 70.0%
> Total population: 176,379
[in-text-ad]
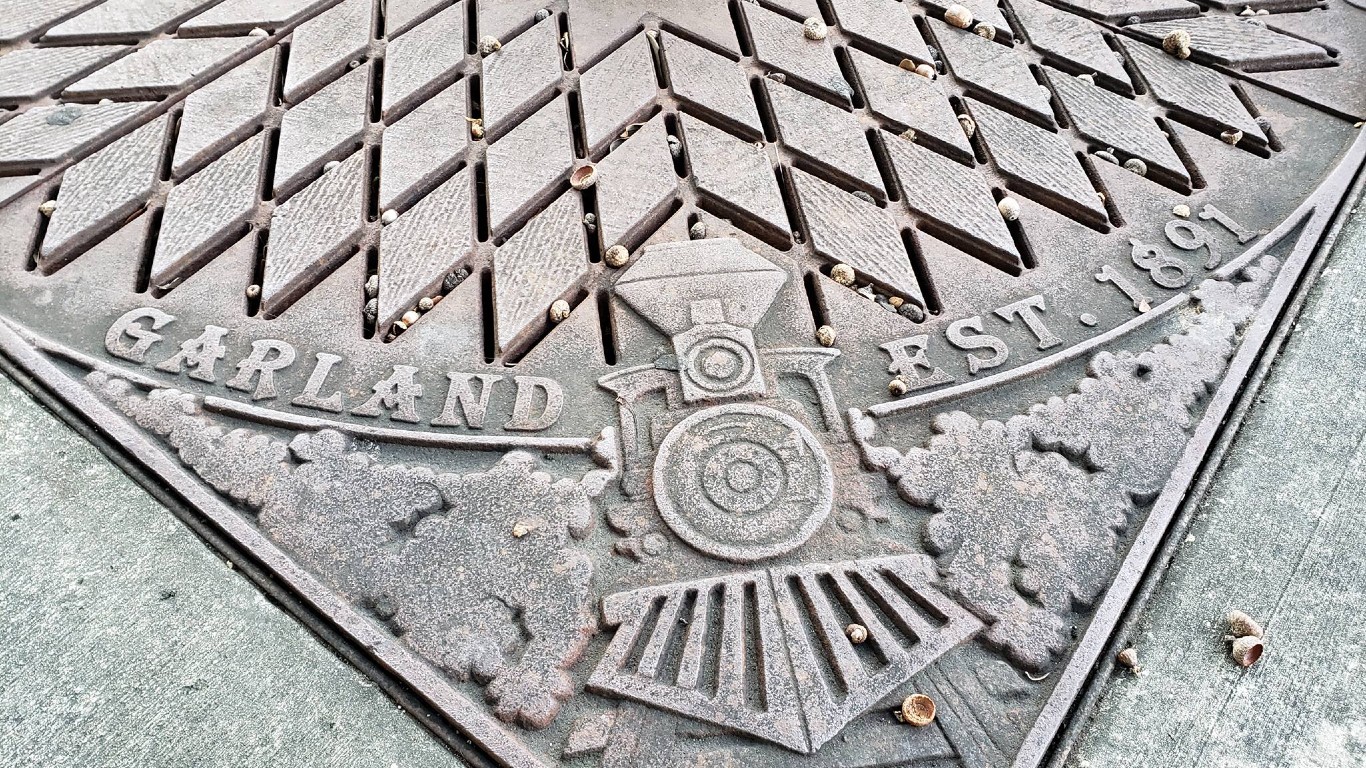
14. Garland, Texas
> Likelihood two random residents are different race or ethnicity: 70.2%
> Total population: 238,418
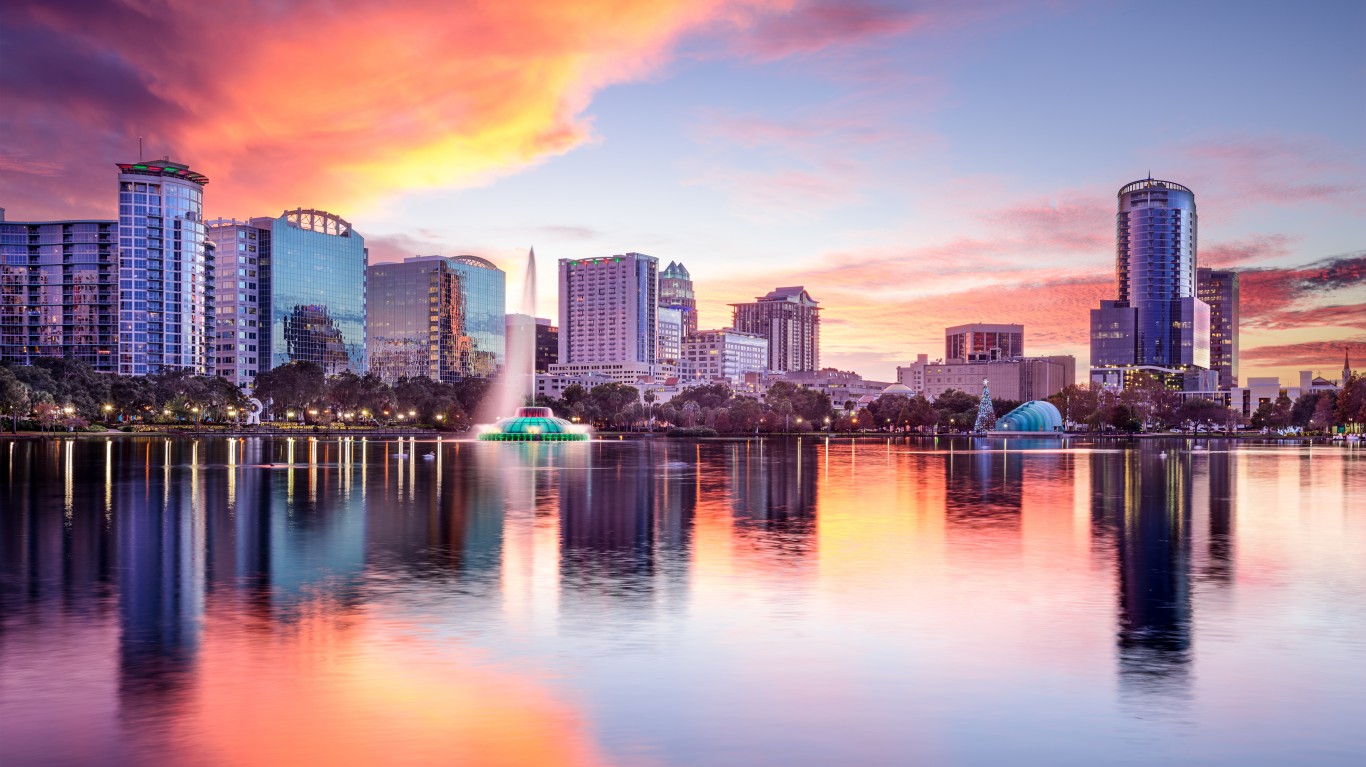
13. Orlando, Florida
> Likelihood two random residents are different race or ethnicity: 70.3%
> Total population: 280,832
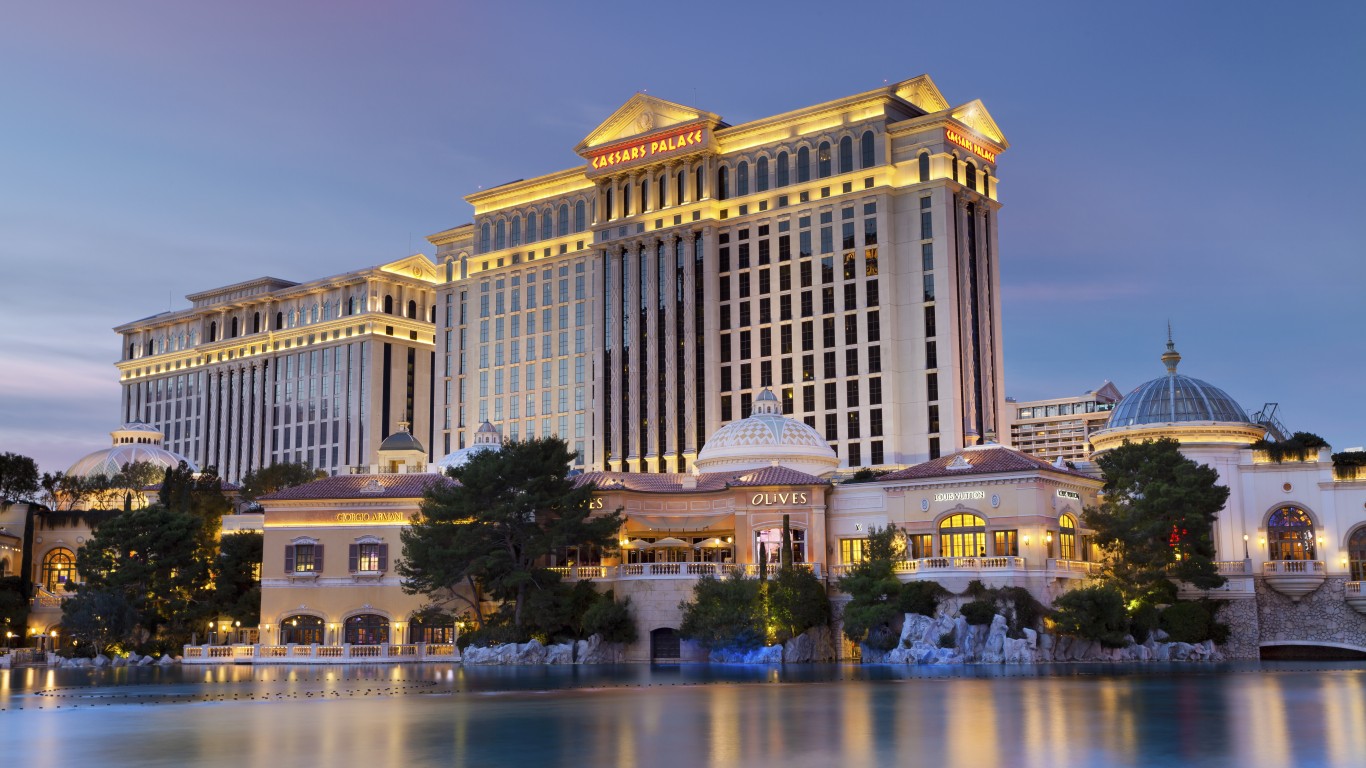
12. Paradise, Nevada
> Likelihood two random residents are different race or ethnicity: 70.4%
> Total population: 235,087
[in-text-ad-2]
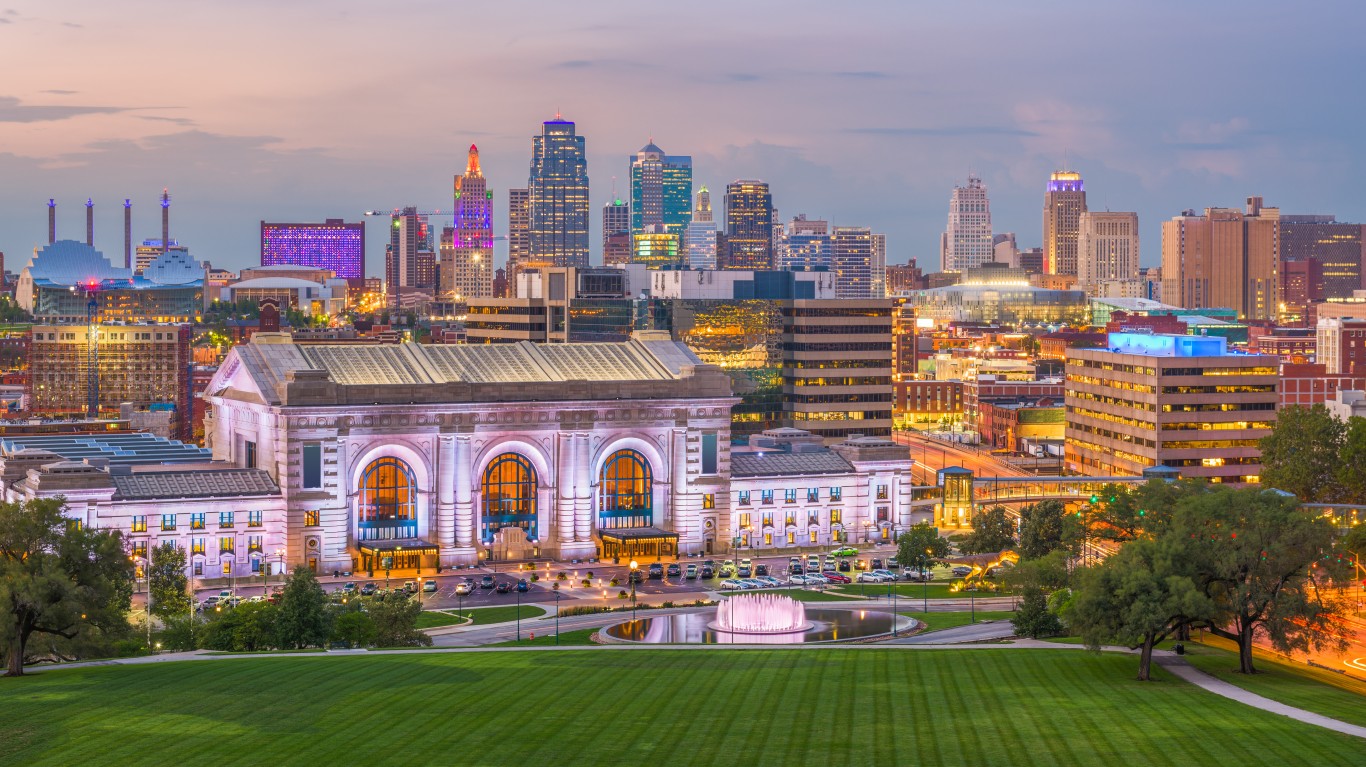
11. Kansas City, Kansas
> Likelihood two random residents are different race or ethnicity: 70.8%
> Total population: 152,522

10. Arlington, Texas
> Likelihood two random residents are different race or ethnicity: 71.0%
> Total population: 395,477
[in-text-ad]
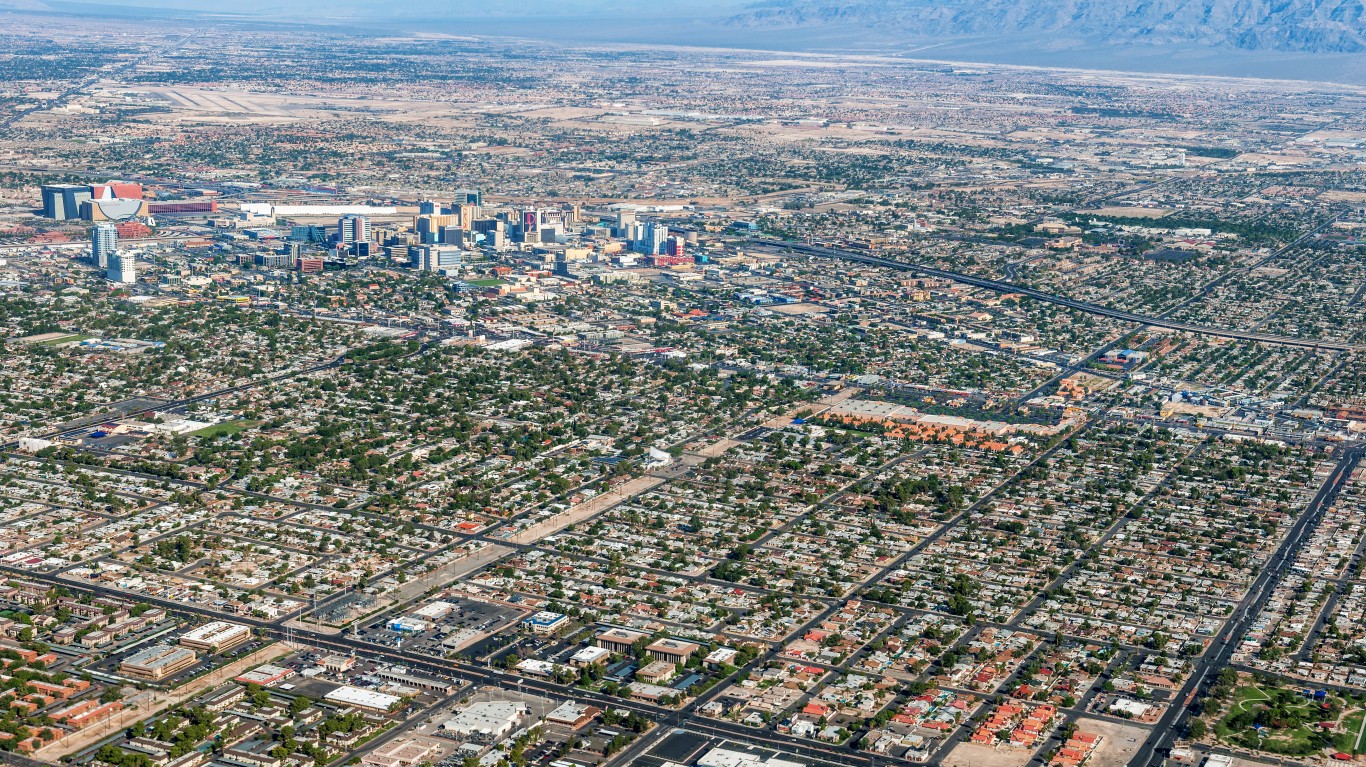
9. North Las Vegas, Nevada
> Likelihood two random residents are different race or ethnicity: 71.3%
> Total population: 241,369
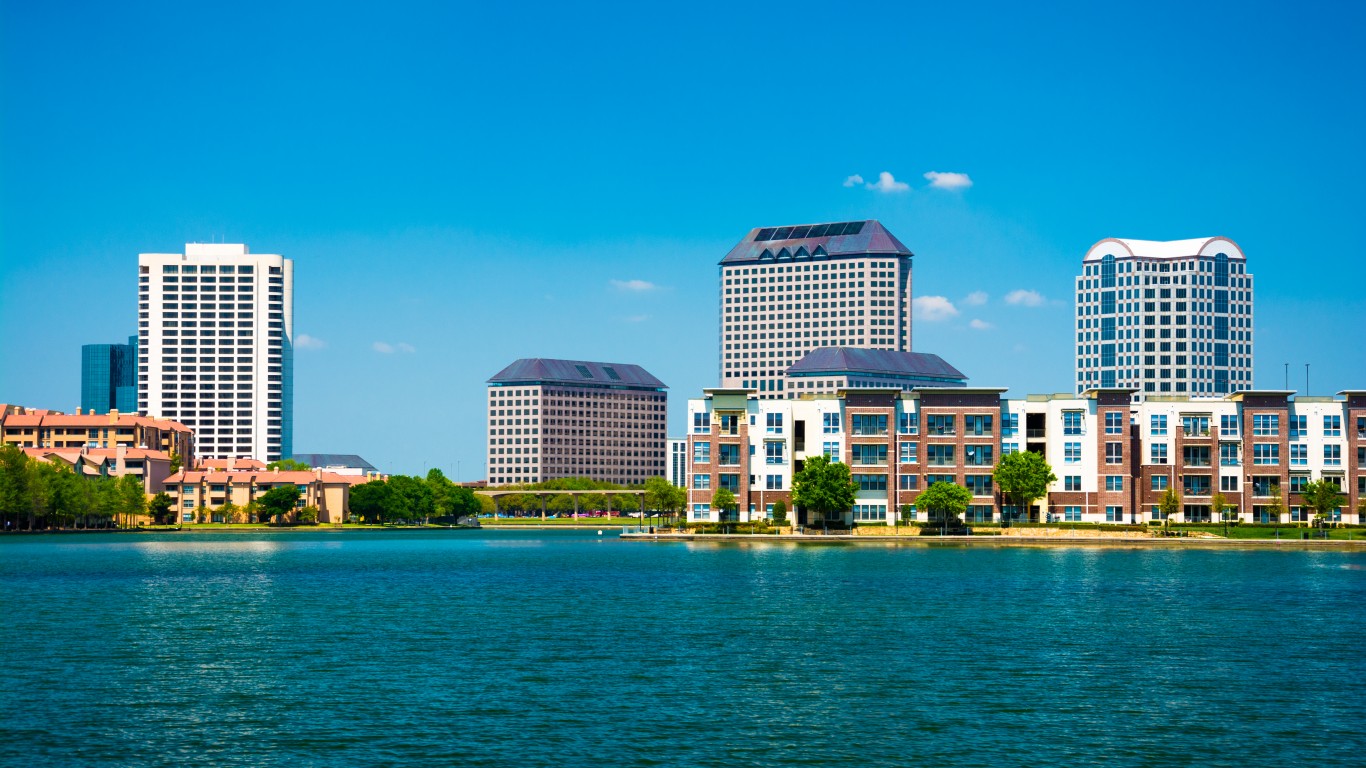
8. Irving, Texas
> Likelihood two random residents are different race or ethnicity: 71.7%
> Total population: 239,783
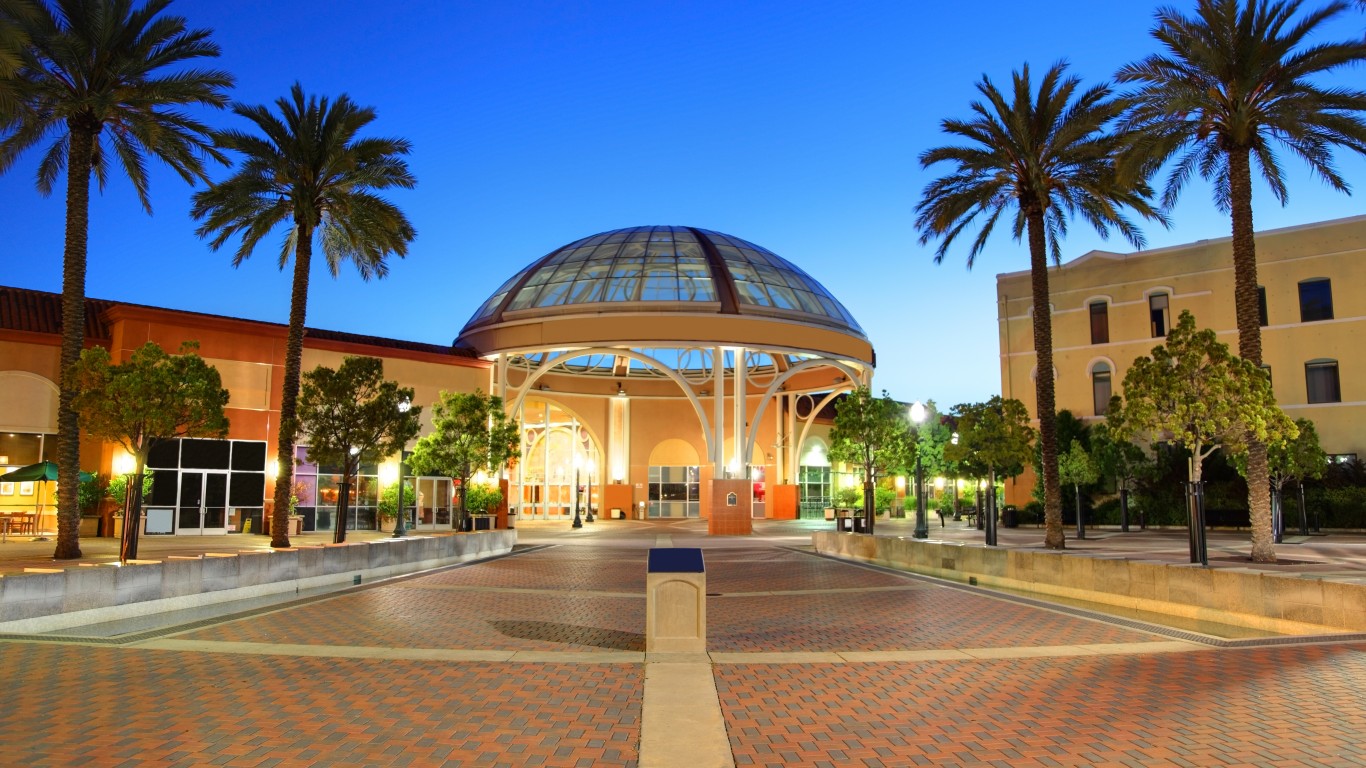
7. Stockton, California
> Likelihood two random residents are different race or ethnicity: 71.8%
> Total population: 309,228
[in-text-ad-2]
6. Enterprise, Nevada
> Likelihood two random residents are different race or ethnicity: 72.3%
> Total population: 171,108
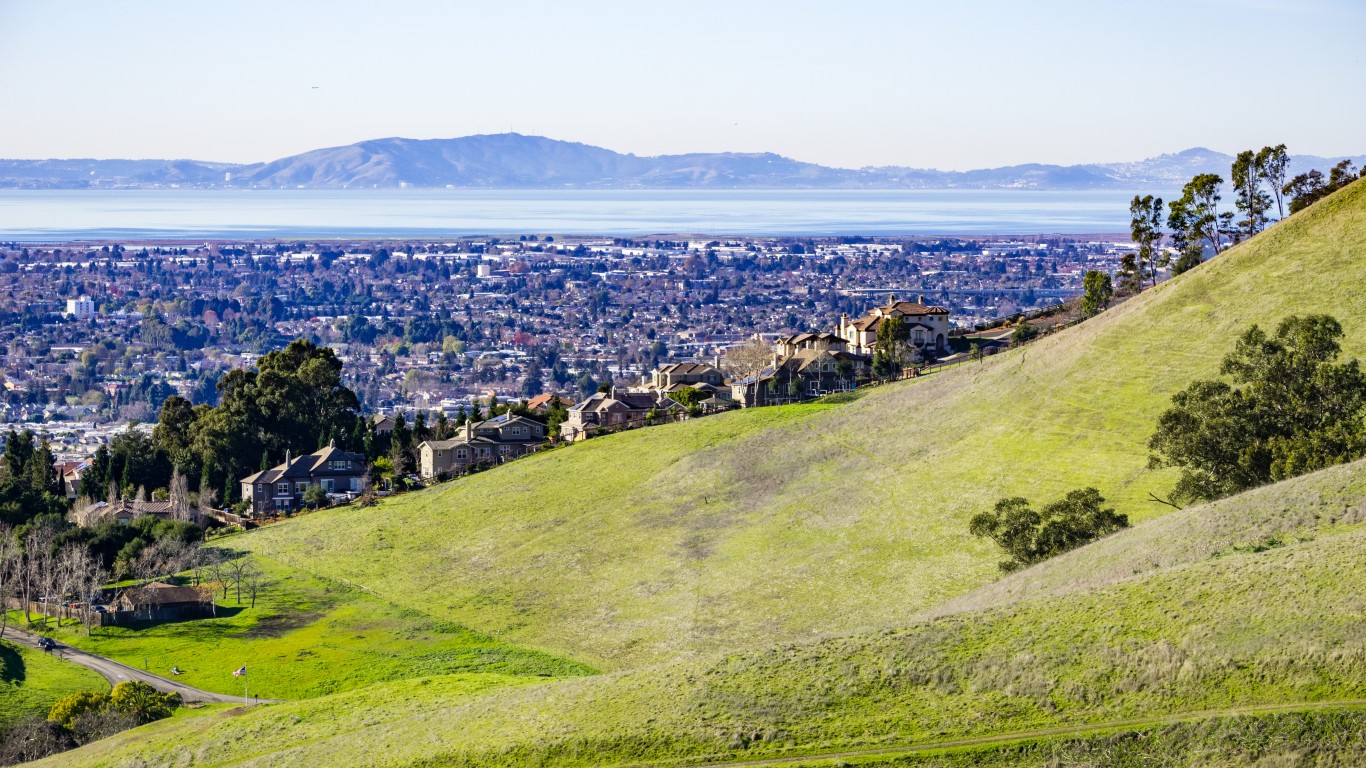
5. Hayward, California
> Likelihood two random residents are different race or ethnicity: 72.7%
> Total population: 159,293
[in-text-ad]
4. Spring Valley, Nevada
> Likelihood two random residents are different race or ethnicity: 74.0%
> Total population: 207,127
3. Elk Grove, California
> Likelihood two random residents are different race or ethnicity: 75.3%
> Total population: 170,825
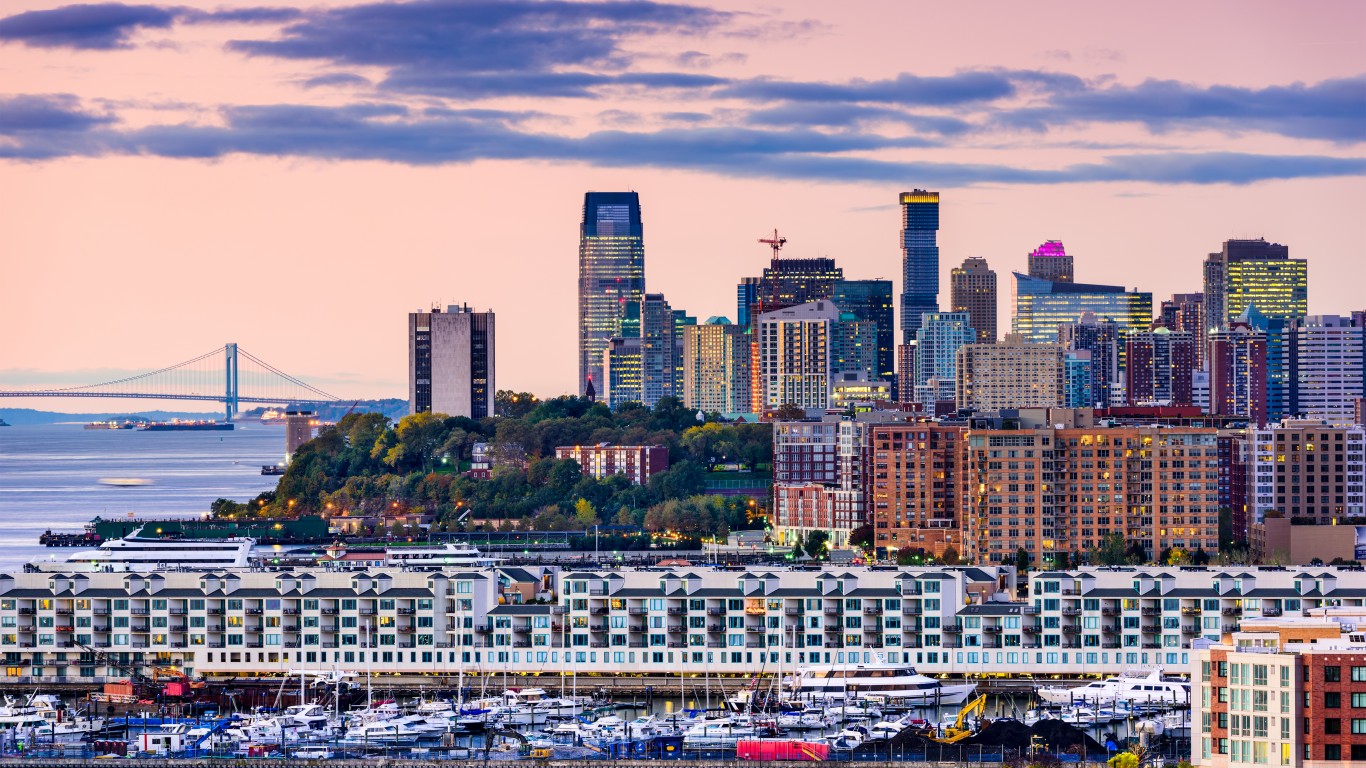
2. Jersey City, New Jersey
> Likelihood two random residents are different race or ethnicity: 76.3%
> Total population: 261,940
[in-text-ad-2]
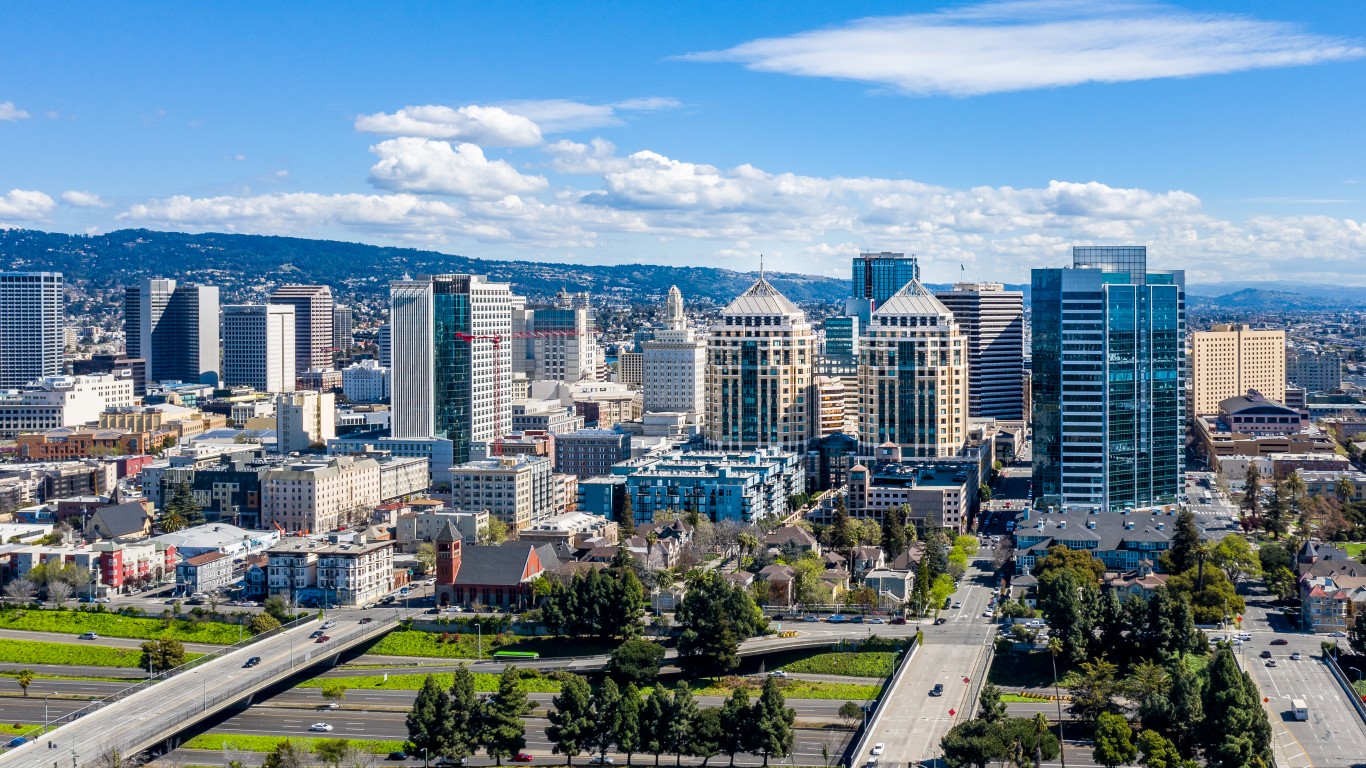
1. Oakland, California
> Likelihood two random residents are different race or ethnicity: 76.7%
> Total population: 425,097
Methodology
To determine America’s most diverse mid-size cities, 24/7 Wall St. reviewed data on race and ethnicity from the U.S. Census Bureau’s 2019 American Community Survey. Cities with between 150,000 and 450,000 residents were ranked based on the probability that two residents picked at random will be of different race or ethnicity. The racial and ethnic categories include white, Black or African American, American Indian and Alaska Native, Asian, Native Hawaiian and other Pacific Islander, Hispanic or Latino, some other race alone, and two or more races. The probability that any two residents picked at random will belong to a different racial or ethnic category is equivalent to the sum of the squares of each group’s share of the population, subtracted from 1. The same method is used in the USA Today Diversity Index.
Take Charge of Your Retirement: Find the Right Financial Advisor For You in Minutes (Sponsor)
Retirement planning doesn’t have to feel overwhelming. The key is finding professional guidance—and we’ve made it easier than ever for you to connect with the right financial advisor for your unique needs.
Here’s how it works:
1️ Answer a Few Simple Questions
Tell us a bit about your goals and preferences—it only takes a few minutes!
2️ Get Your Top Advisor Matches
This tool matches you with qualified advisors who specialize in helping people like you achieve financial success.
3️ Choose Your Best Fit
Review their profiles, schedule an introductory meeting, and select the advisor who feels right for you.
Why wait? Start building the retirement you’ve always dreamed of. Click here to get started today!
Thank you for reading! Have some feedback for us?
Contact the 24/7 Wall St. editorial team.

 24/7 Wall St.