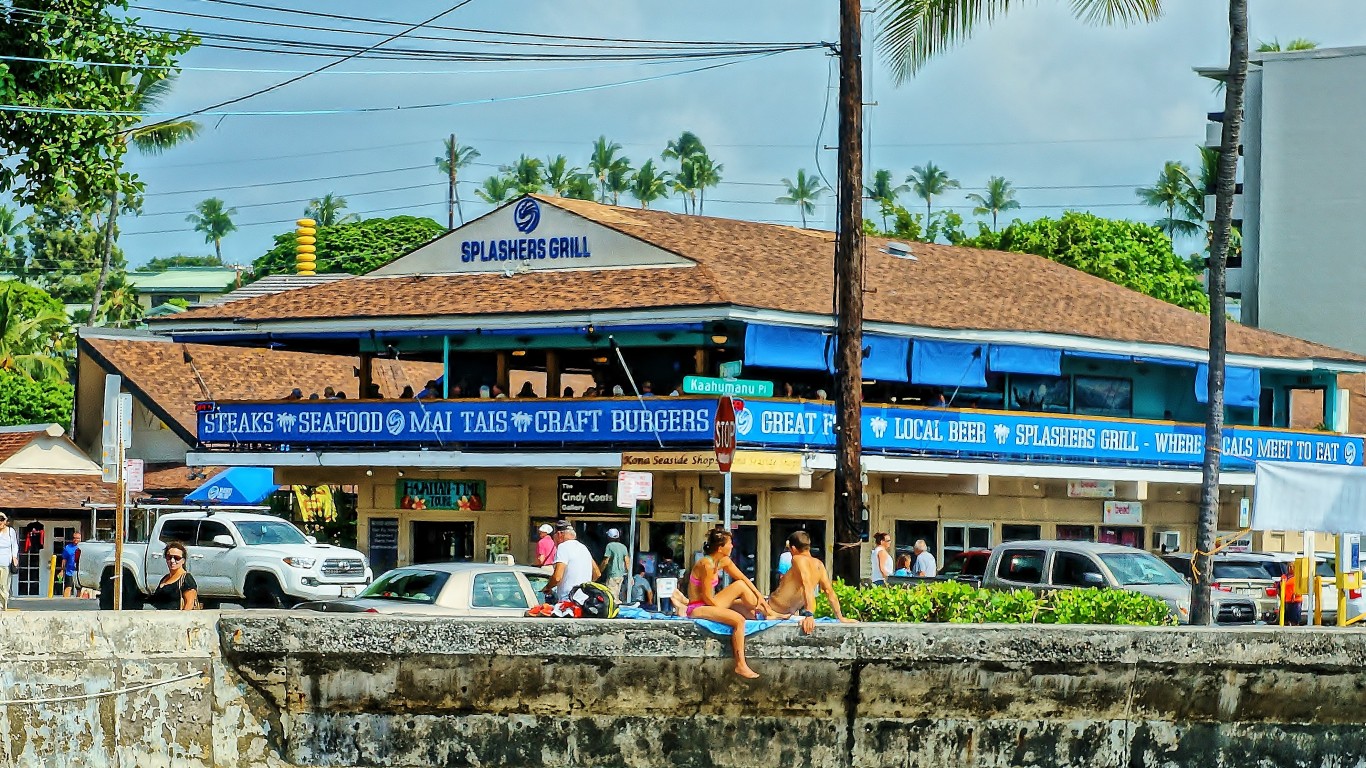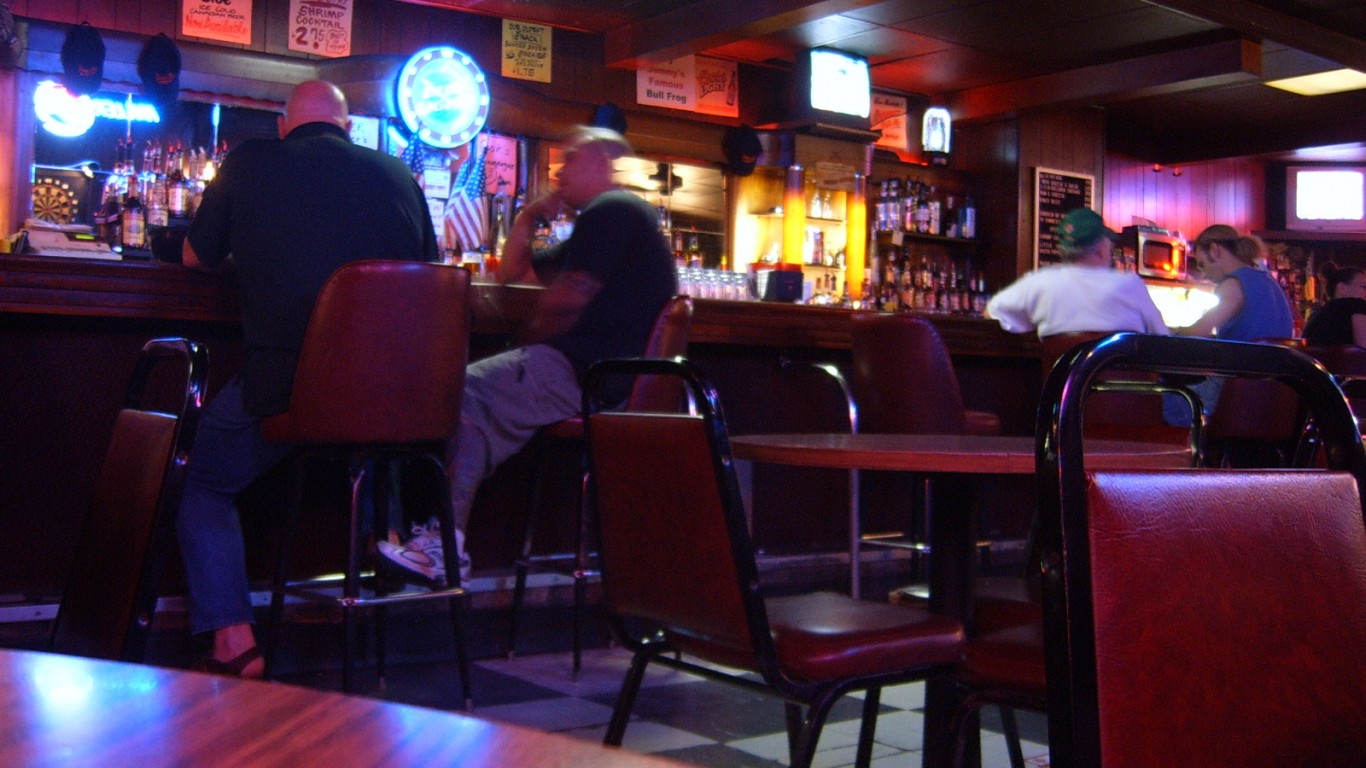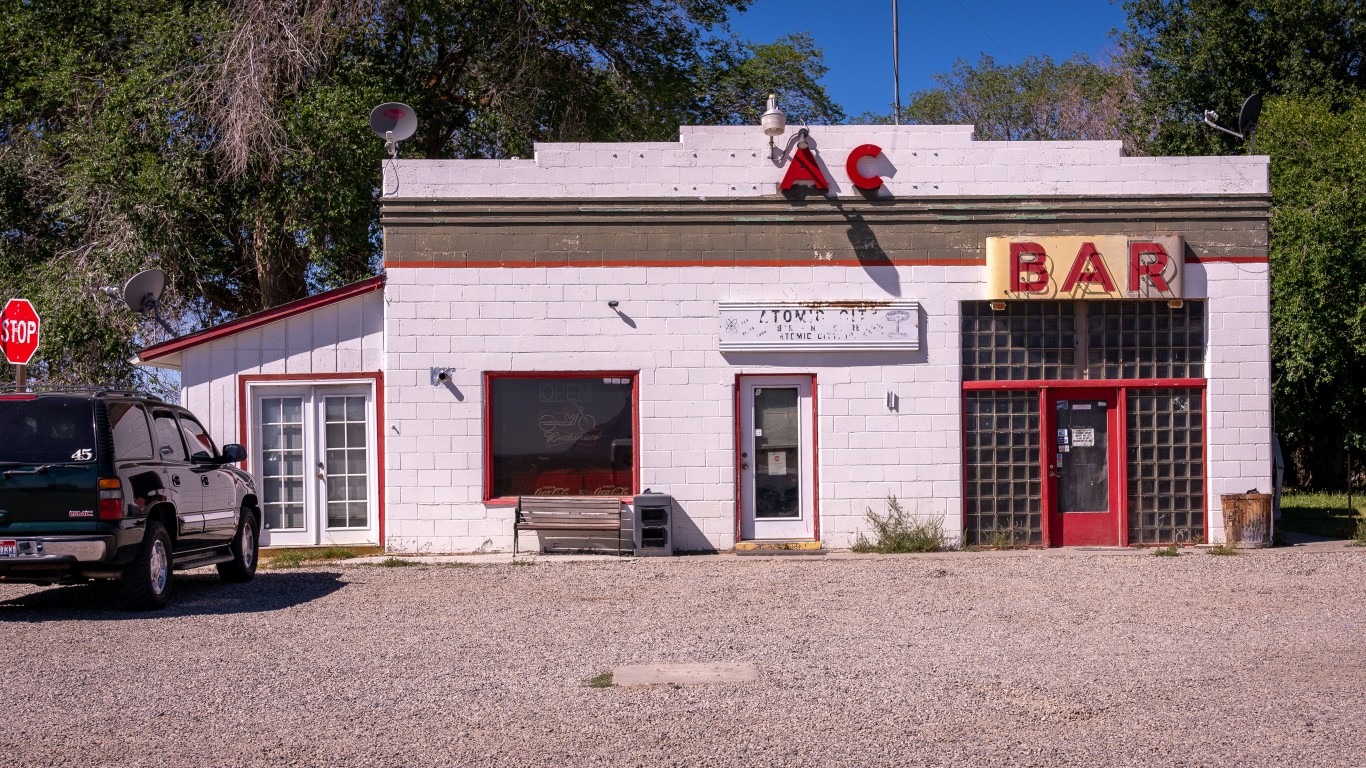
Bars are a seemingly ubiquitous part of the American landscape. Even small towns with one stoplight probably have a local watering hole where workers can let off steam after a long day or shoot the breeze with their fellow regulars. In addition to local dives, larger towns and cities may also be home to sports bars, cocktail lounges, wine bars, and breweries. (Here is the best dive bar in every state.)
This hasn’t always been the case, however. For 13 years starting in 1920, the sale of alcoholic beverages was prohibited in the United States, and thousands of formerly legal saloons shut down. When the 21st Amendment ended the ban, the federal government left it up to each state to determine how they would handle the sale of alcohol. This has led to a diverse landscape of laws and drinking establishments – or lack thereof – in different pockets of the country.
To determine the states with the most bars – both in total numbers and per capita – 24/7 Tempo reviewed “Which States Have the Most Bars?,” published by VinePair, a digital media company covering “drinks and the experiences you have with a glass in hand.” Restaurants and cafes that also sell alcohol are not included.
VinePair sourced their data, which is for 2019 – the most recent year for which data is available – from the U.S. Census Bureau’s Economic Census and Annual Survey of Manufactures and the Bureau of Economic Analysis’s Survey of Current Business, and from records from other government agencies, including the Internal Revenue Service and the Social Security Administration. 24/7 Tempo added estimated 2020 population figures for adults over 21, released by the U.S. Census Bureau.
Logically, the states with the most bars tend to be the states with higher populations, including New York, California, Texas, Florida, and Pennsylvania. But when adjusted for the population of adults over 21, many of the states with the most bars per capita are the states with the lowest populations in the nation, including North Dakota, Wyoming, Montana, and South Dakota. Wisconsin is an outlier near the top of the list, having both a relatively high population and a huge number of bars. Perhaps not surprisingly, Wisconsin is also home to some of America’s drunkest cities.
Some states that appear to have fewer bars actually just have more “restaurants” that serve as drinking establishments – and also happen to sell a limited selection of food – in order to get around strict state licensing laws. This is a result of the post-Prohibition regulations that certain states put in place to limit and discourage the sale of alcohol. Seventeen states, including New Hampshire, Virginia, and Utah, control the sale of distilled spirits – and sometimes even beer and wine.
Click here to see the states with the most bars
Most states decided to let each county decide how to handle alcohol sales, and as a result, some have a high number of dry counties. These states are mainly in the South, where Christian values including temperance are enforced. Mississippi (which has 12 dry counties), Tennessee, and Kansas are dry states by default and require counties to specifically authorize the sale of alcohol. There are also many dry counties in Kentucky (15) and Arkansas (34), with a handful each in Texas, Florida, and Georgia, and one in South Dakota.
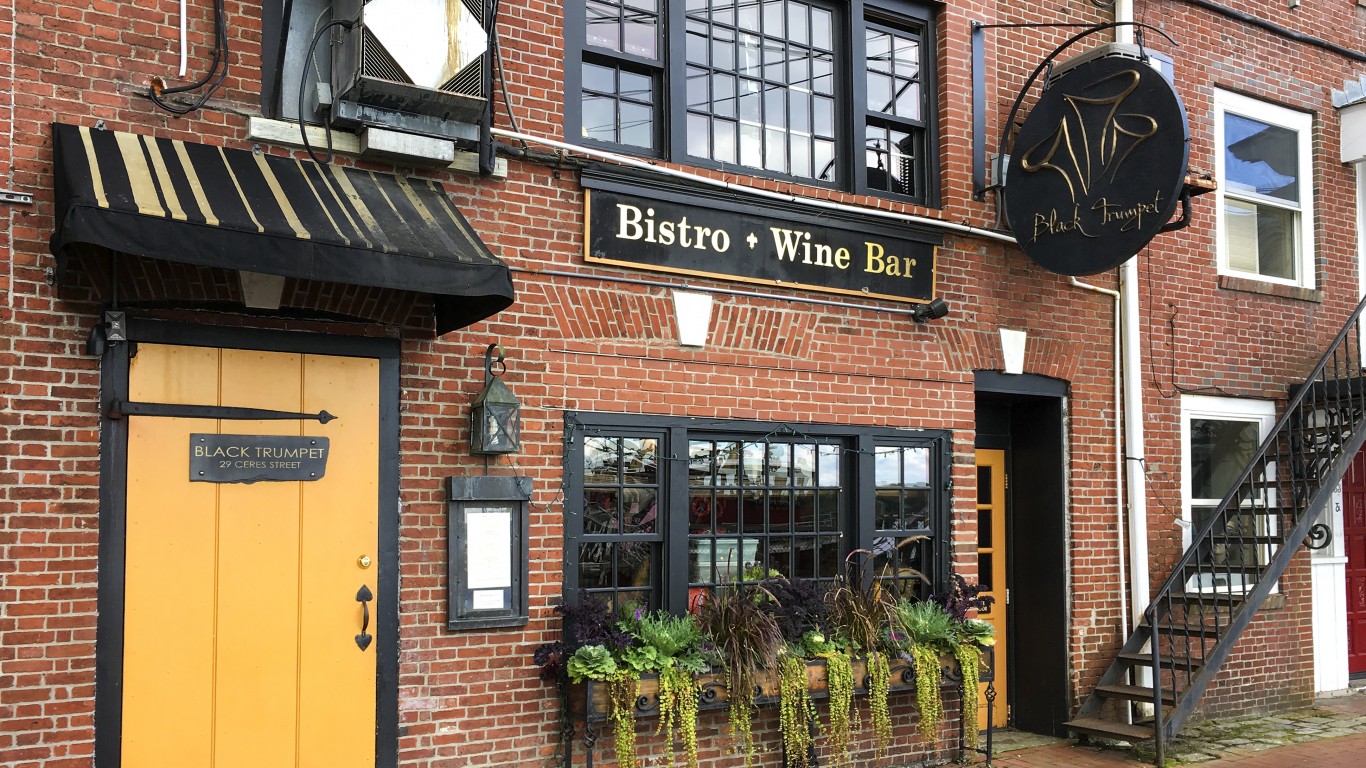
50. New Hampshire
> Bars per 100,000 residents 21 and older: 0.77
> Total bars: 21 (the lowest)
> Population 21 and older: 2,710,488 (10th lowest)
[in-text-ad]
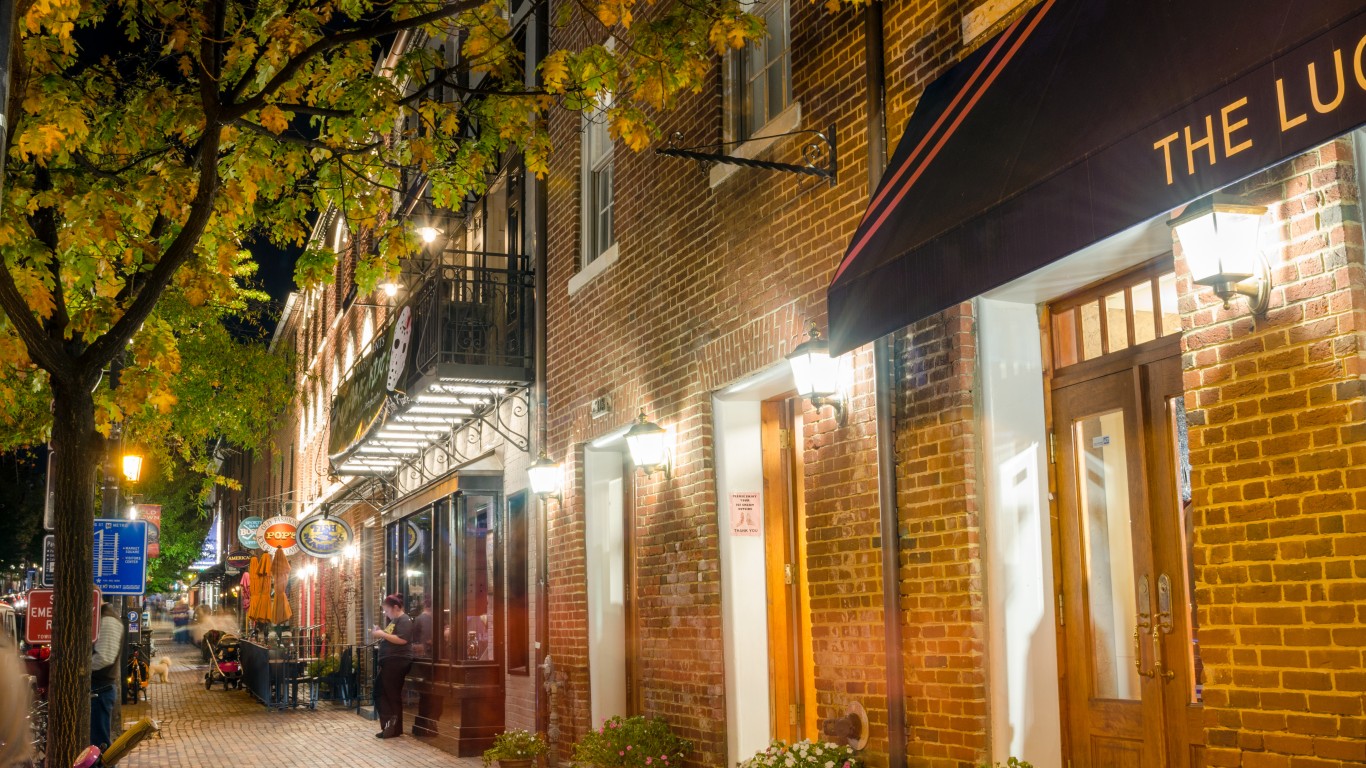
49. Virginia
> Bars per 100,000 residents 21 and older: 1.15
> Total bars: 195 (12th lowest)
> Population 21 and older: 17,018,716 (12th highest)
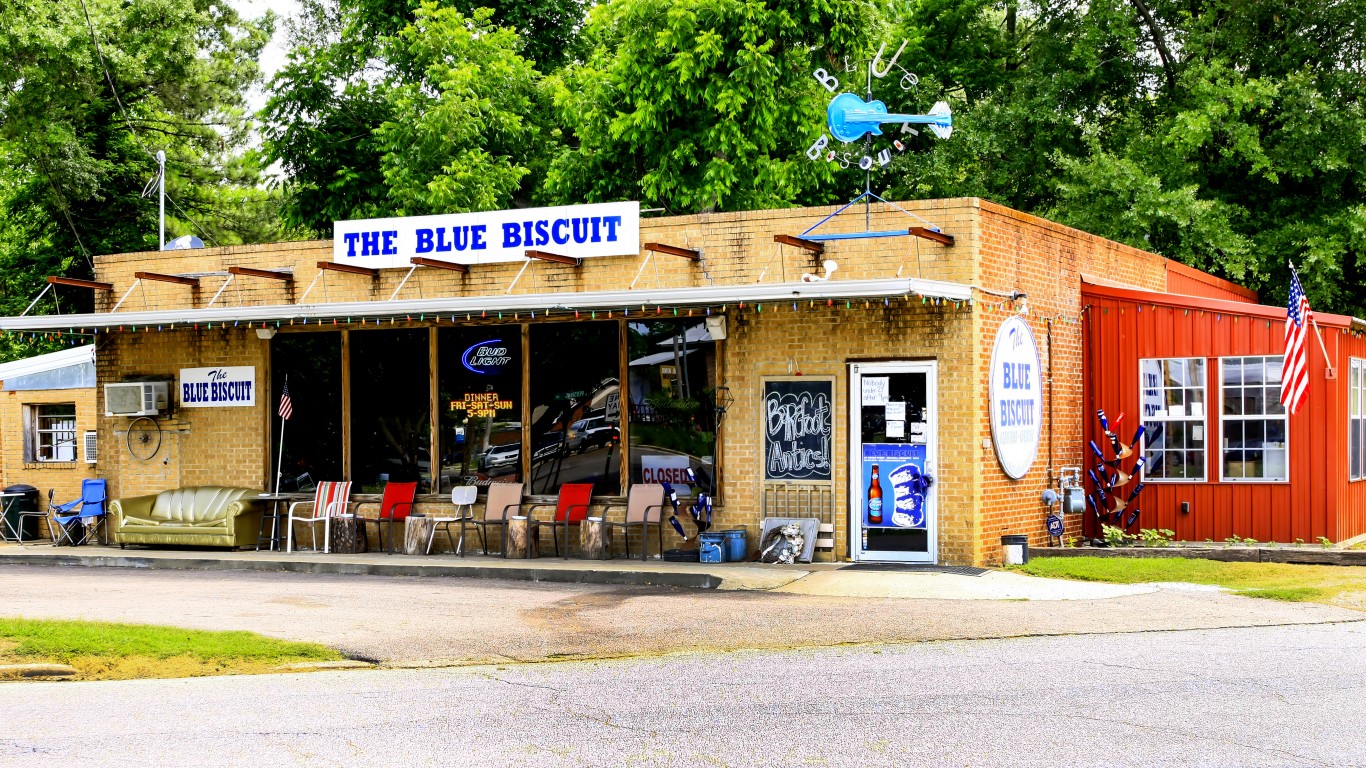
48. Mississippi
> Bars per 100,000 residents 21 and older: 1.74
> Total bars: 104 (4th lowest)
> Population 21 and older: 5,963,670 (17th lowest)
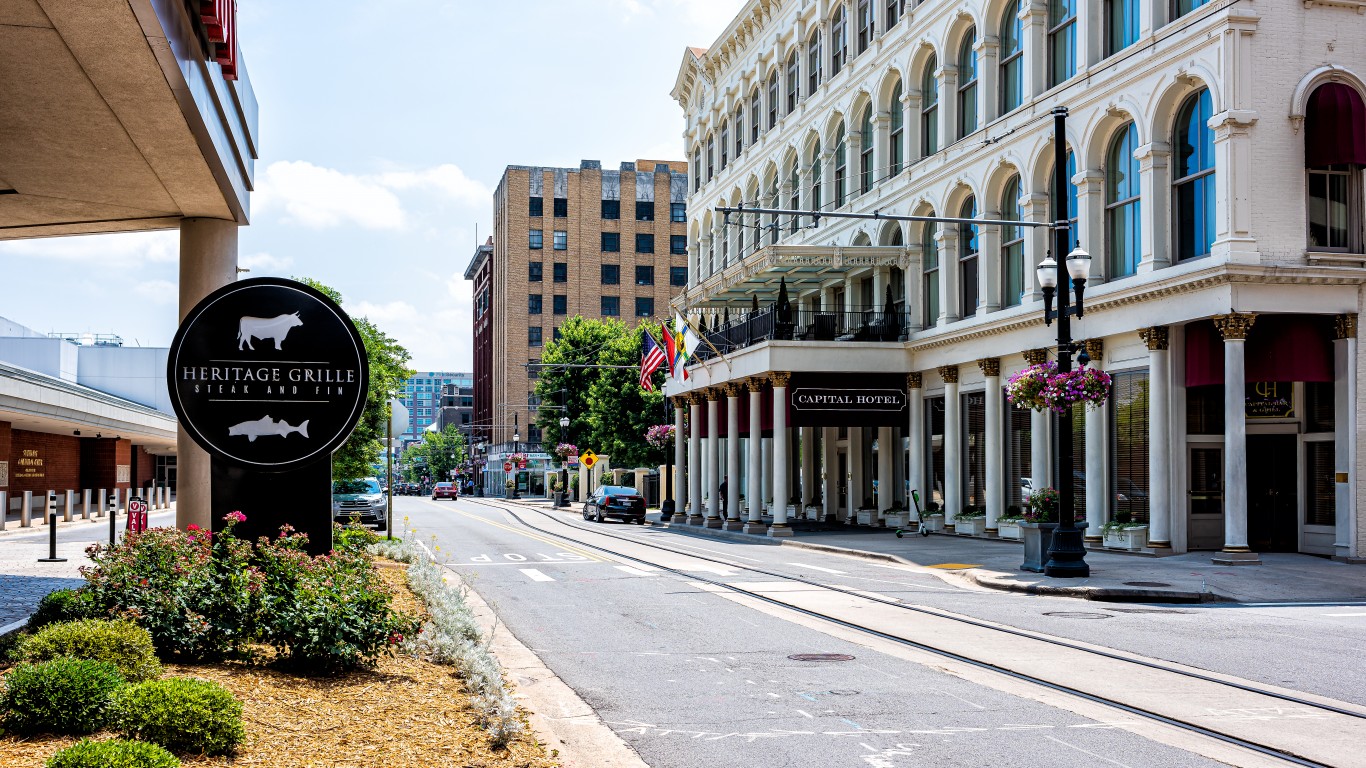
47. Arkansas
> Bars per 100,000 residents 21 and older: 1.88
> Total bars: 113 (6th lowest)
> Population 21 and older: 6,023,746 (18th lowest)
[in-text-ad-2]
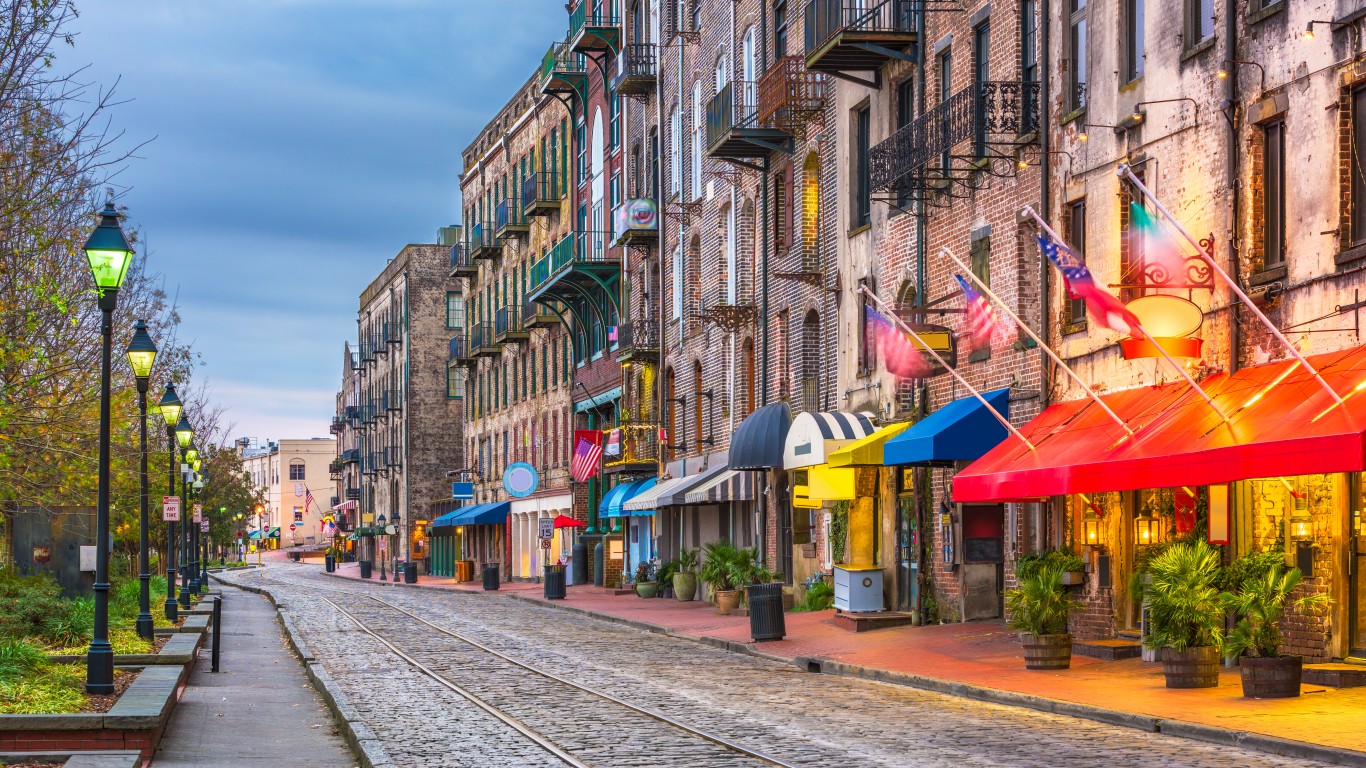
46. Georgia
> Bars per 100,000 residents 21 and older: 2.02
> Total bars: 424 (25th lowest)
> Population 21 and older: 21,033,158 (8th highest)
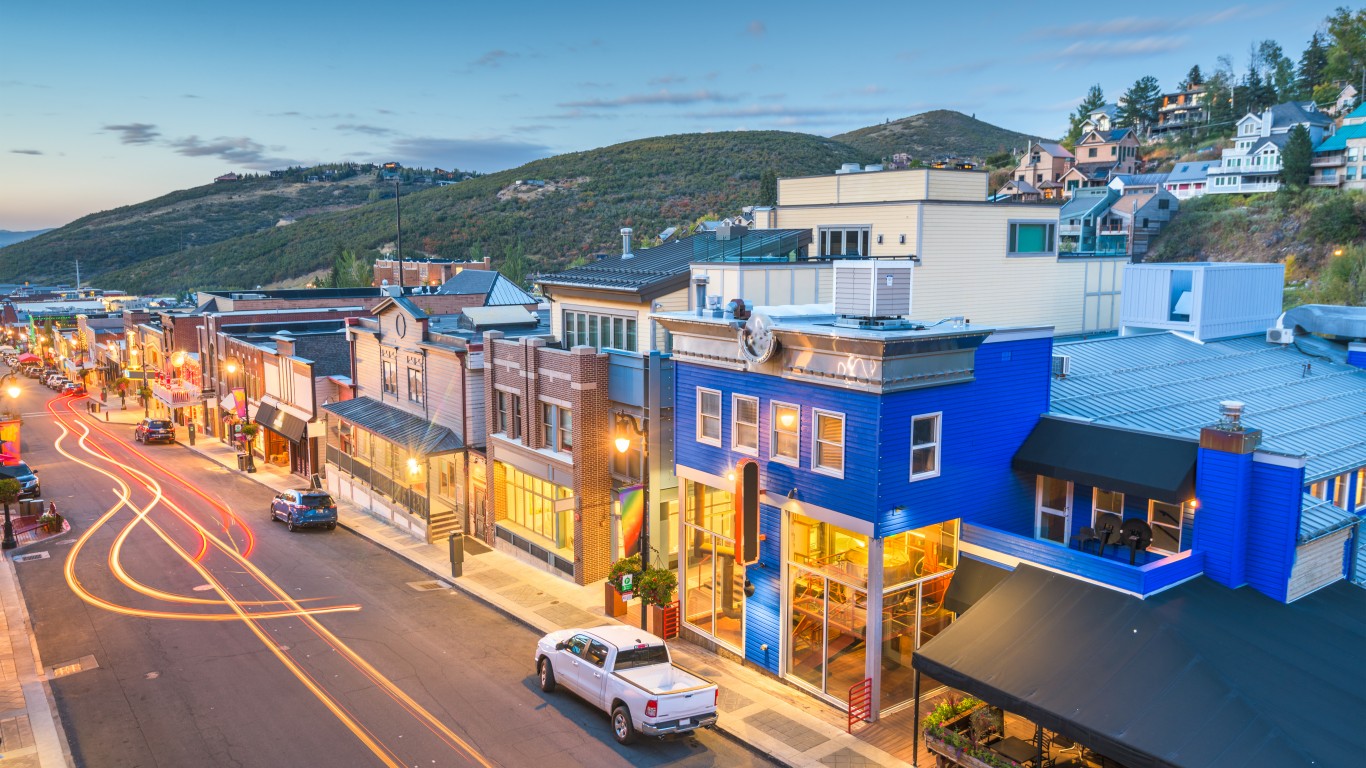
45. Utah
> Bars per 100,000 residents 21 and older: 2.40
> Total bars: 151 (9th lowest)
> Population 21 and older: 6,302,478 (21st lowest)
[in-text-ad]
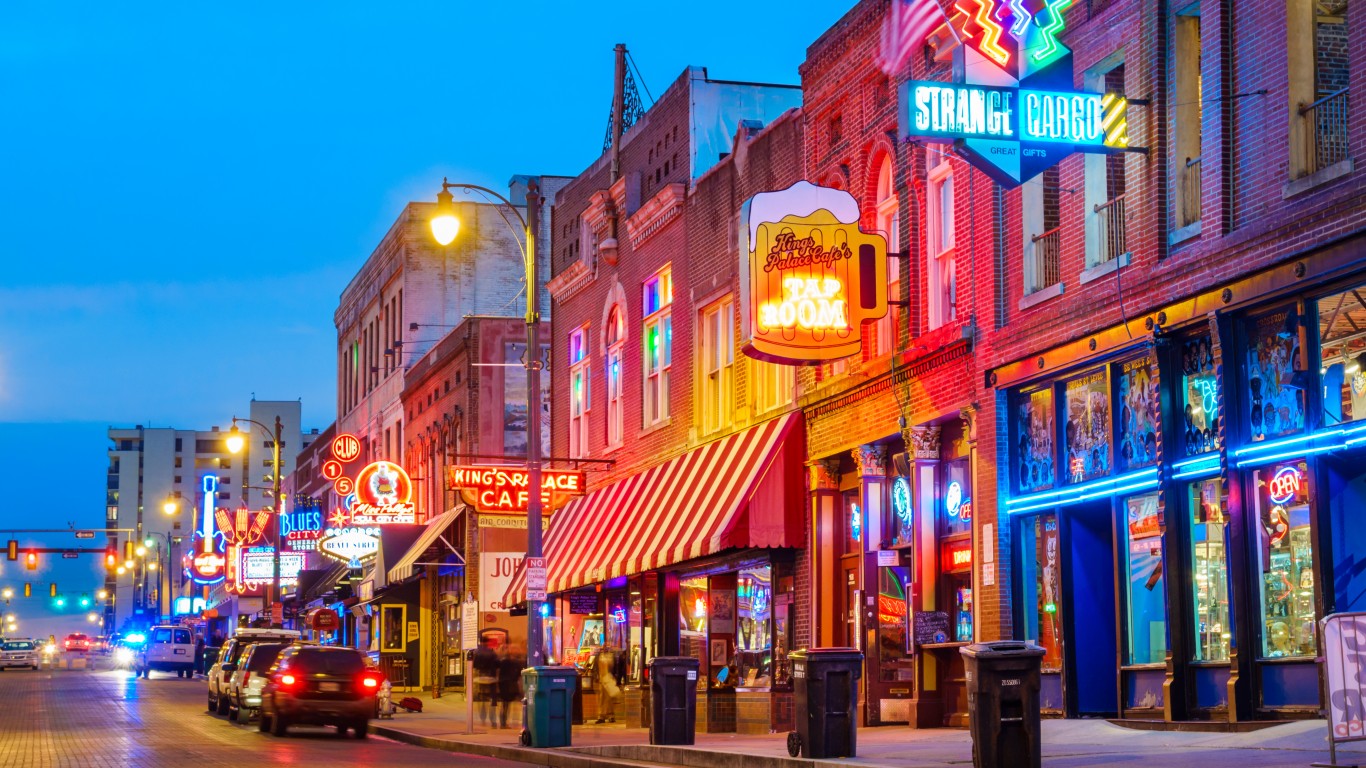
44. Tennessee
> Bars per 100,000 residents 21 and older: 2.53
> Total bars: 343 (20th lowest)
> Population 21 and older: 13,544,536 (16th highest)
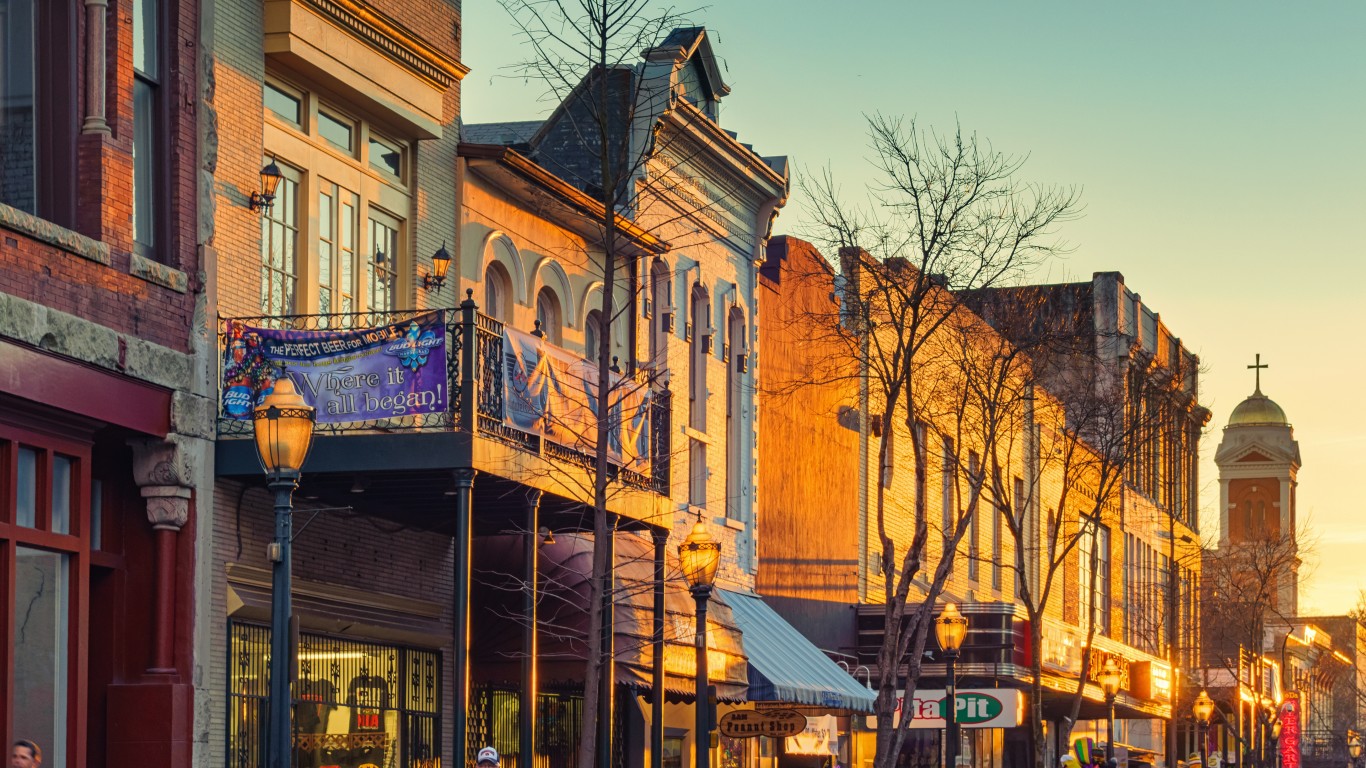
43. Alabama
> Bars per 100,000 residents 21 and older: 2.54
> Total bars: 249 (14th lowest)
> Population 21 and older: 9,786,372 (24th highest)
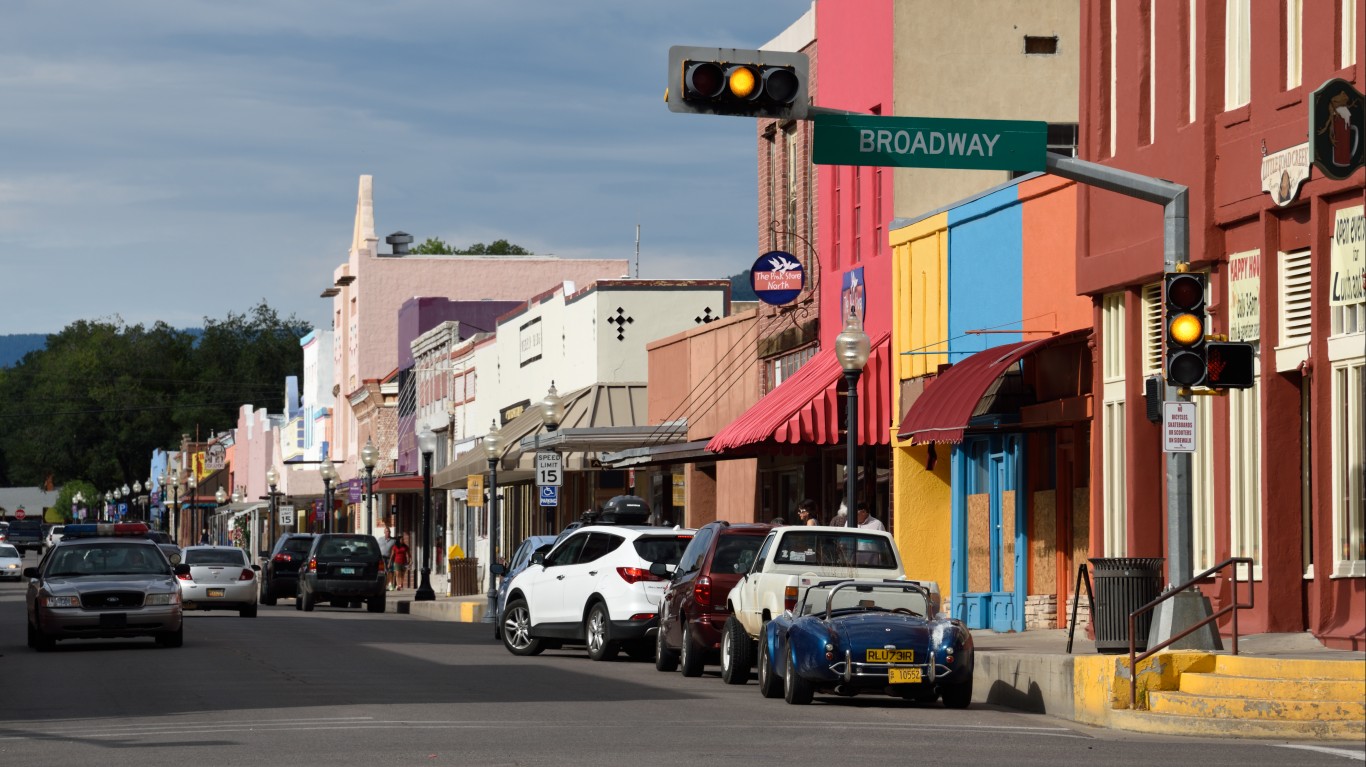
42. New Mexico
> Bars per 100,000 residents 21 and older: 2.65
> Total bars: 111 (5th lowest)
> Population 21 and older: 4,194,042 (15th lowest)
[in-text-ad-2]

41. Kentucky
> Bars per 100,000 residents 21 and older: 3.44
> Total bars: 307 (18th lowest)
> Population 21 and older: 8,923,904 (25th lowest)
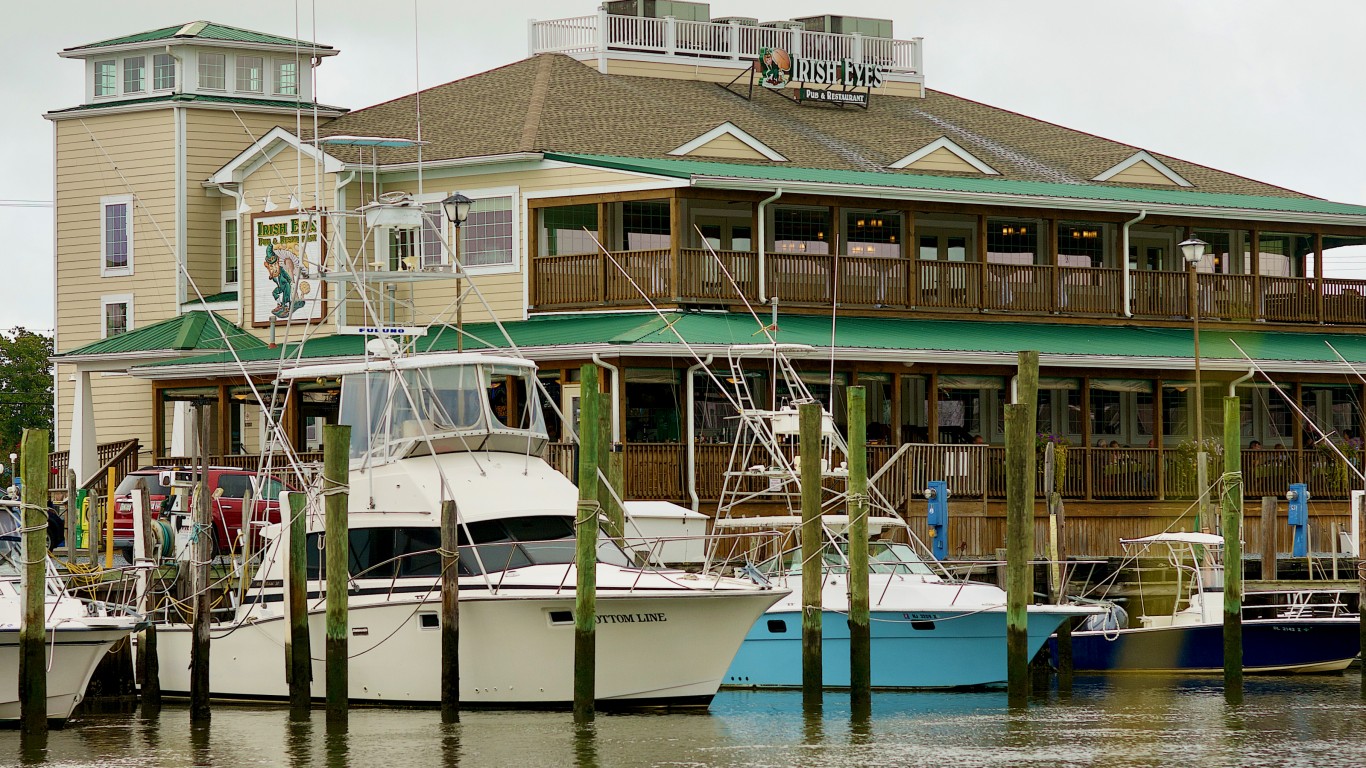
40. Delaware
> Bars per 100,000 residents 21 and older: 3.51
> Total bars: 68 (2nd lowest)
> Population 21 and older: 1,935,358 (6th lowest)
[in-text-ad]

39. South Carolina
> Bars per 100,000 residents 21 and older: 3.61
> Total bars: 368 (22nd lowest)
> Population 21 and older: 10,183,034 (23rd highest)
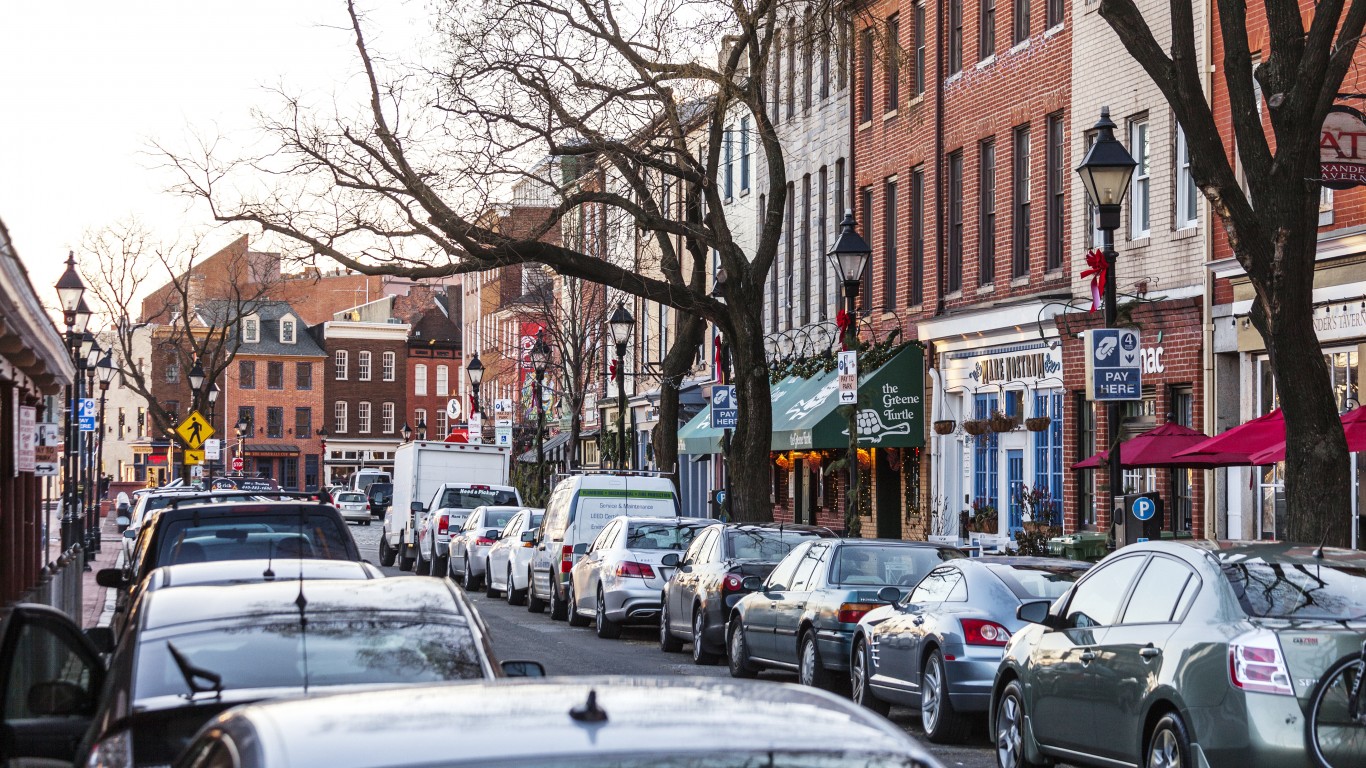
38. Maryland
> Bars per 100,000 residents 21 and older: 3.66
> Total bars: 442 (25th highest)
> Population 21 and older: 12,075,248 (19th highest)
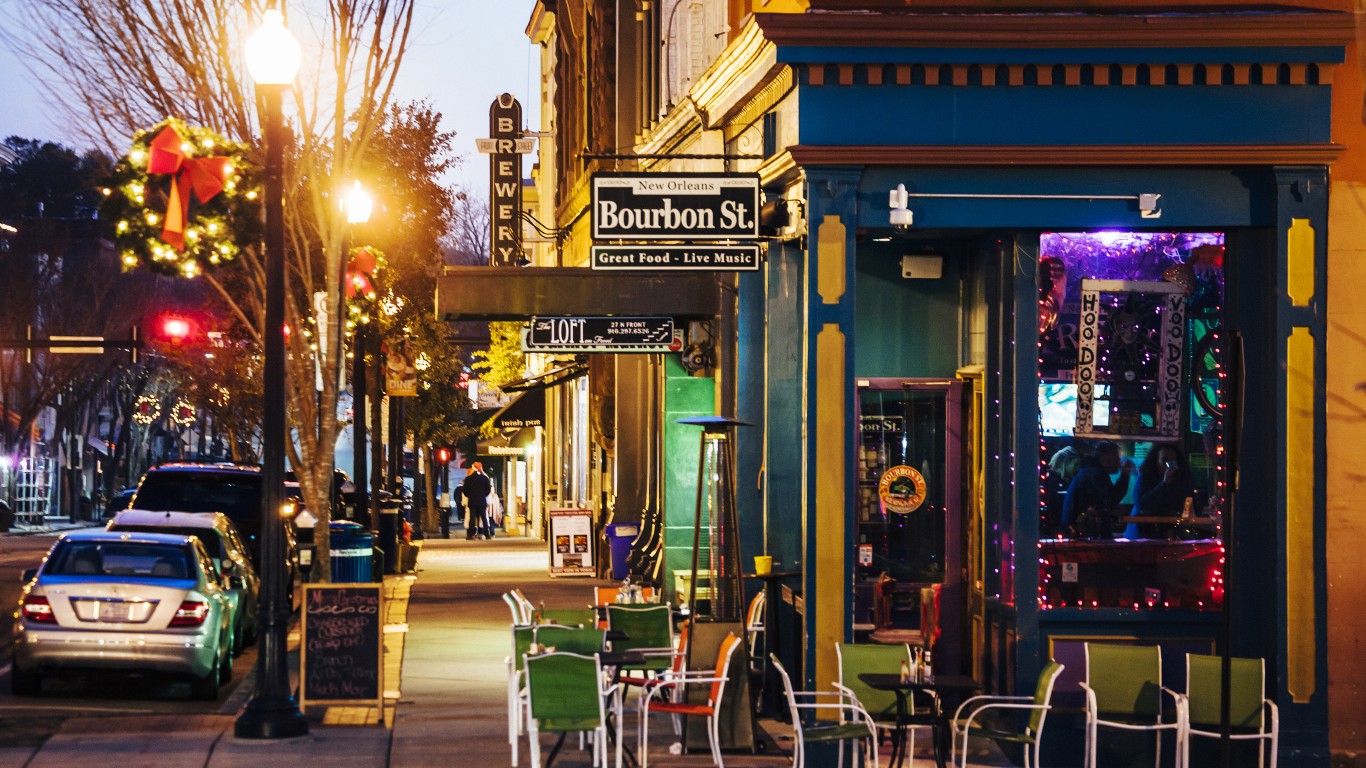
37. North Carolina
> Bars per 100,000 residents 21 and older: 3.68
> Total bars: 765 (18th highest)
> Population 21 and older: 20,772,454 (9th highest)
[in-text-ad-2]
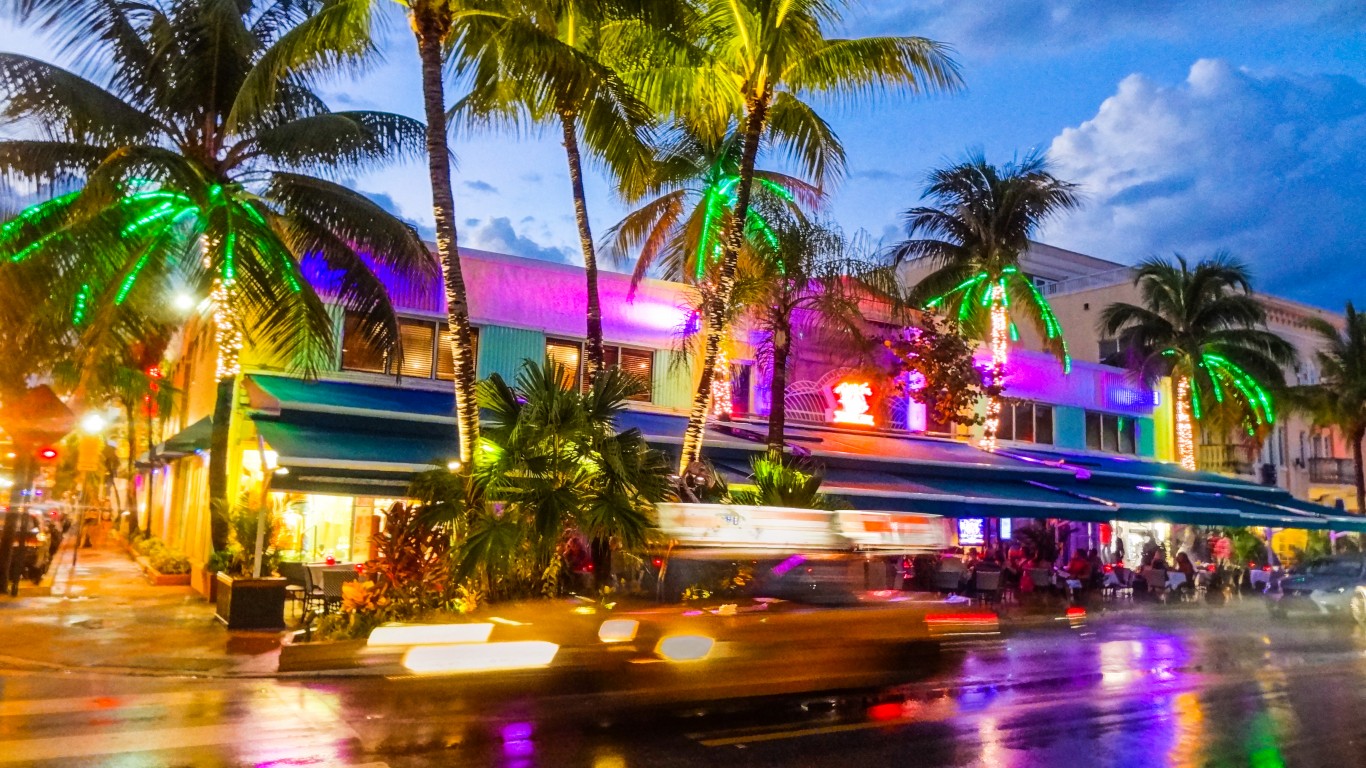
36. Florida
> Bars per 100,000 residents 21 and older: 4.08
> Total bars: 1732 (8th highest)
> Population 21 and older: 42,433,848 (3rd highest)
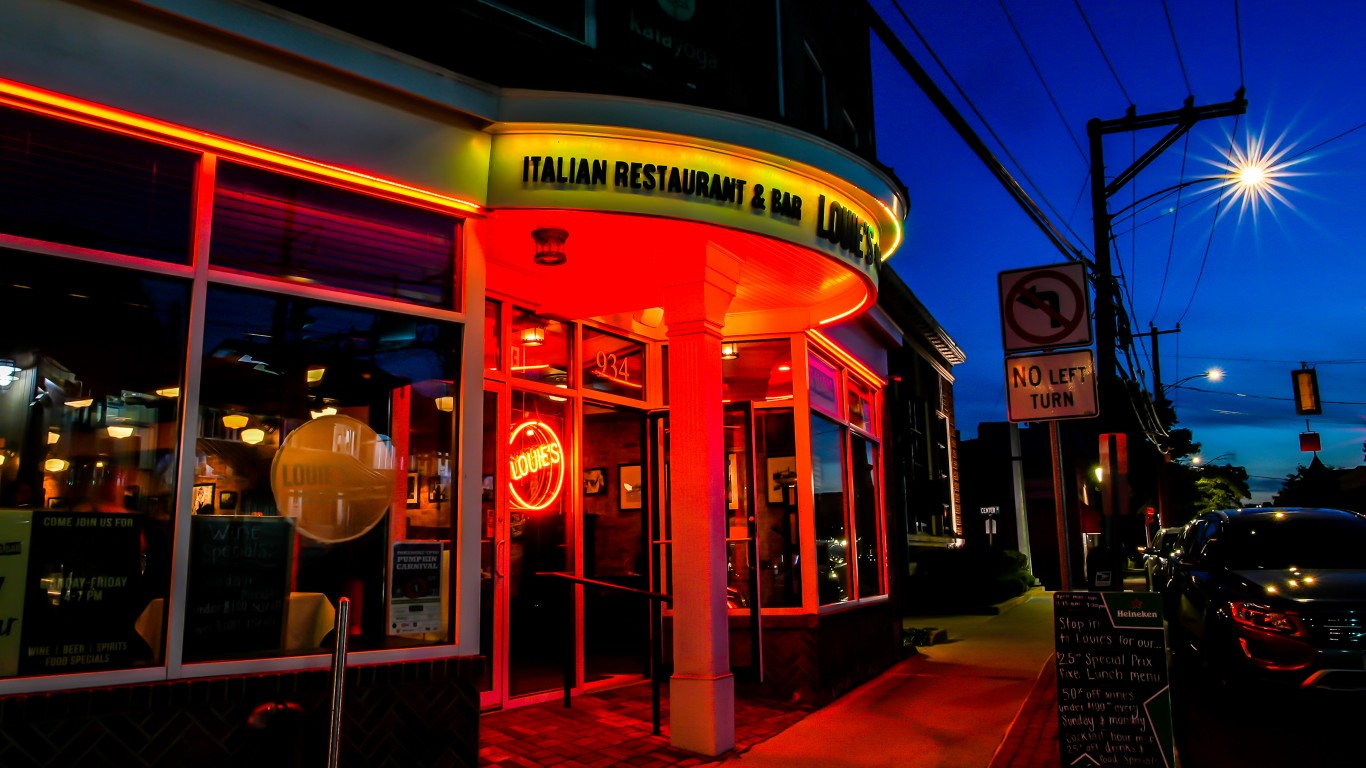
35. Connecticut
> Bars per 100,000 residents 21 and older: 4.17
> Total bars: 298 (16th lowest)
> Population 21 and older: 7,141,098 (22nd lowest)
[in-text-ad]

34. Arizona
> Bars per 100,000 residents 21 and older: 4.27
> Total bars: 613 (22nd highest)
> Population 21 and older: 14,348,128 (14th highest)
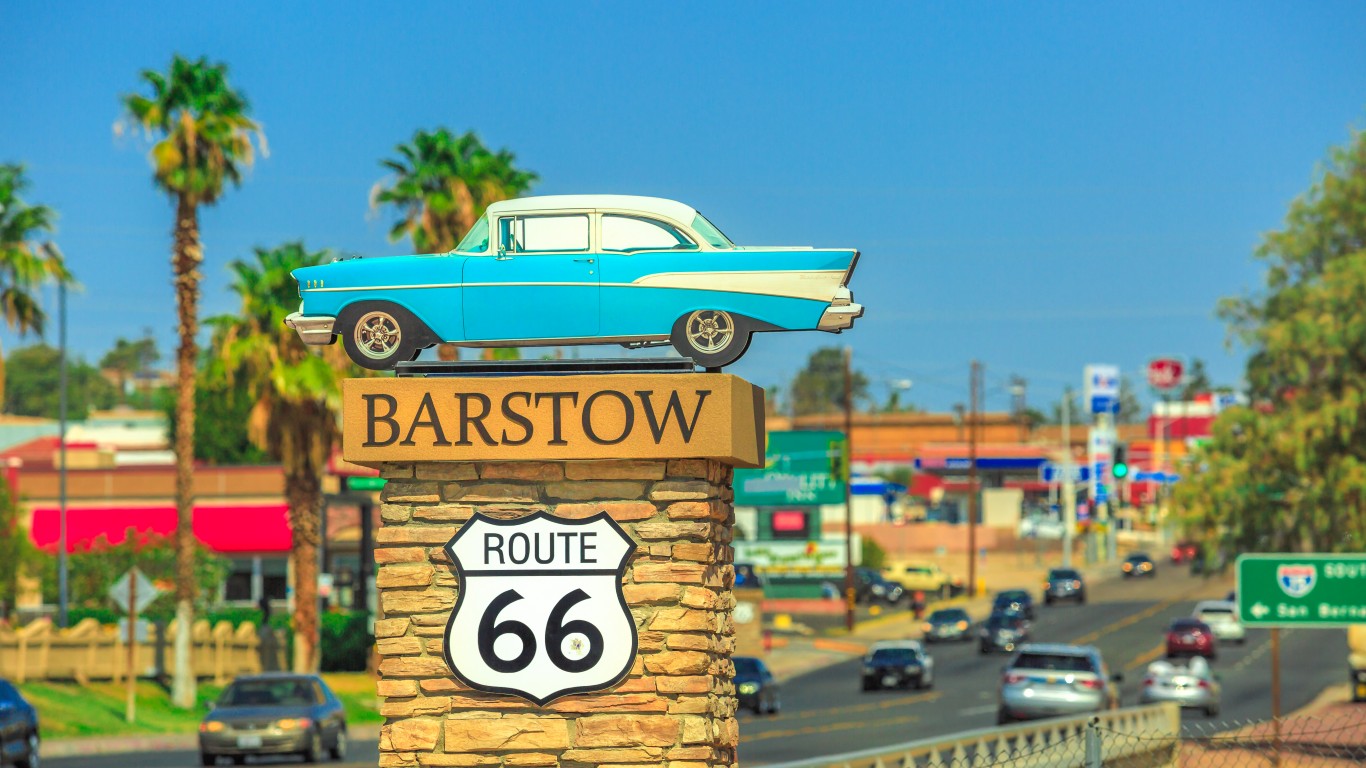
33. California
> Bars per 100,000 residents 21 and older: 4.28
> Total bars: 3370 (2nd highest)
> Population 21 and older: 78,692,046 (the highest)

32. Texas
> Bars per 100,000 residents 21 and older: 4.90
> Total bars: 2806 (3rd highest)
> Population 21 and older: 57,270,884 (2nd highest)
[in-text-ad-2]
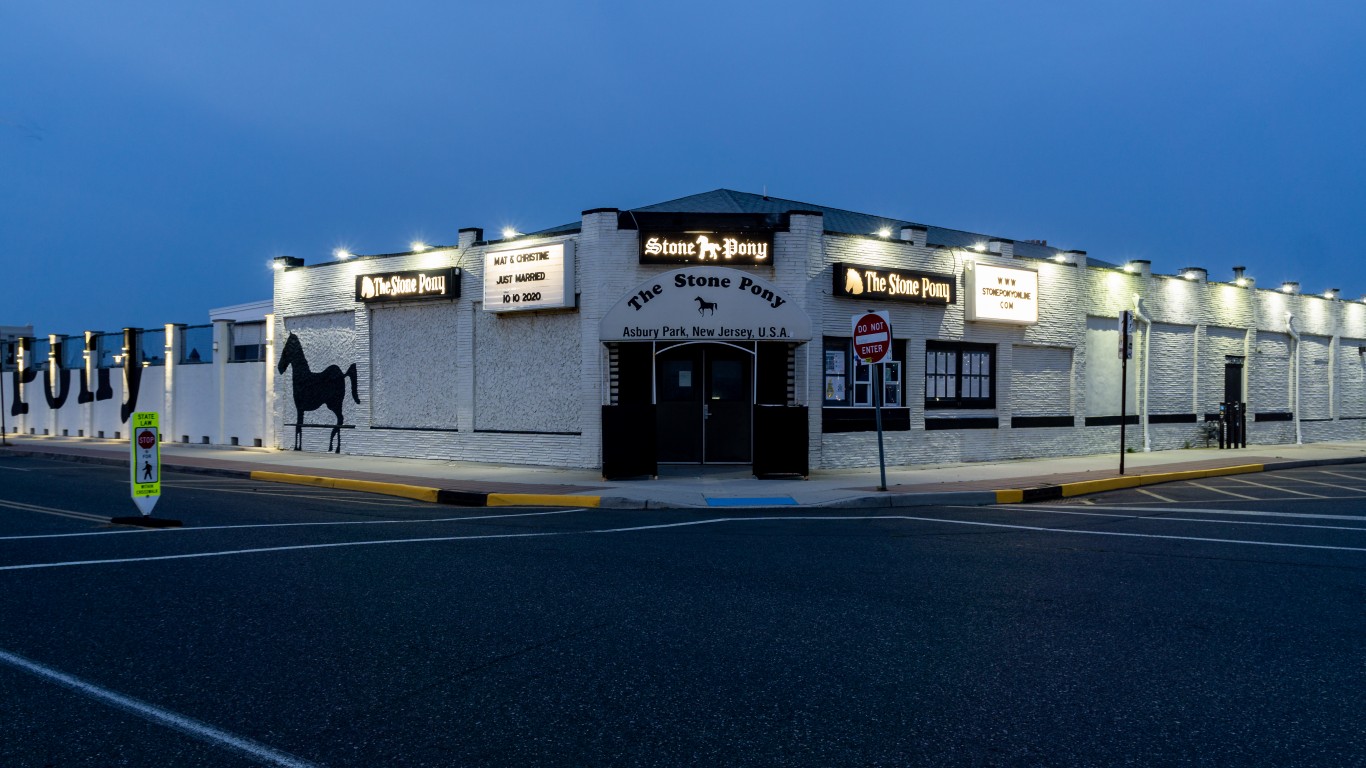
31. New Jersey
> Bars per 100,000 residents 21 and older: 4.95
> Total bars: 880 (11th highest)
> Population 21 and older: 17,770,836 (11th highest)

30. Maine
> Bars per 100,000 residents 21 and older: 4.96
> Total bars: 133 (7th lowest)
> Population 21 and older: 2,681,650 (9th lowest)
[in-text-ad]
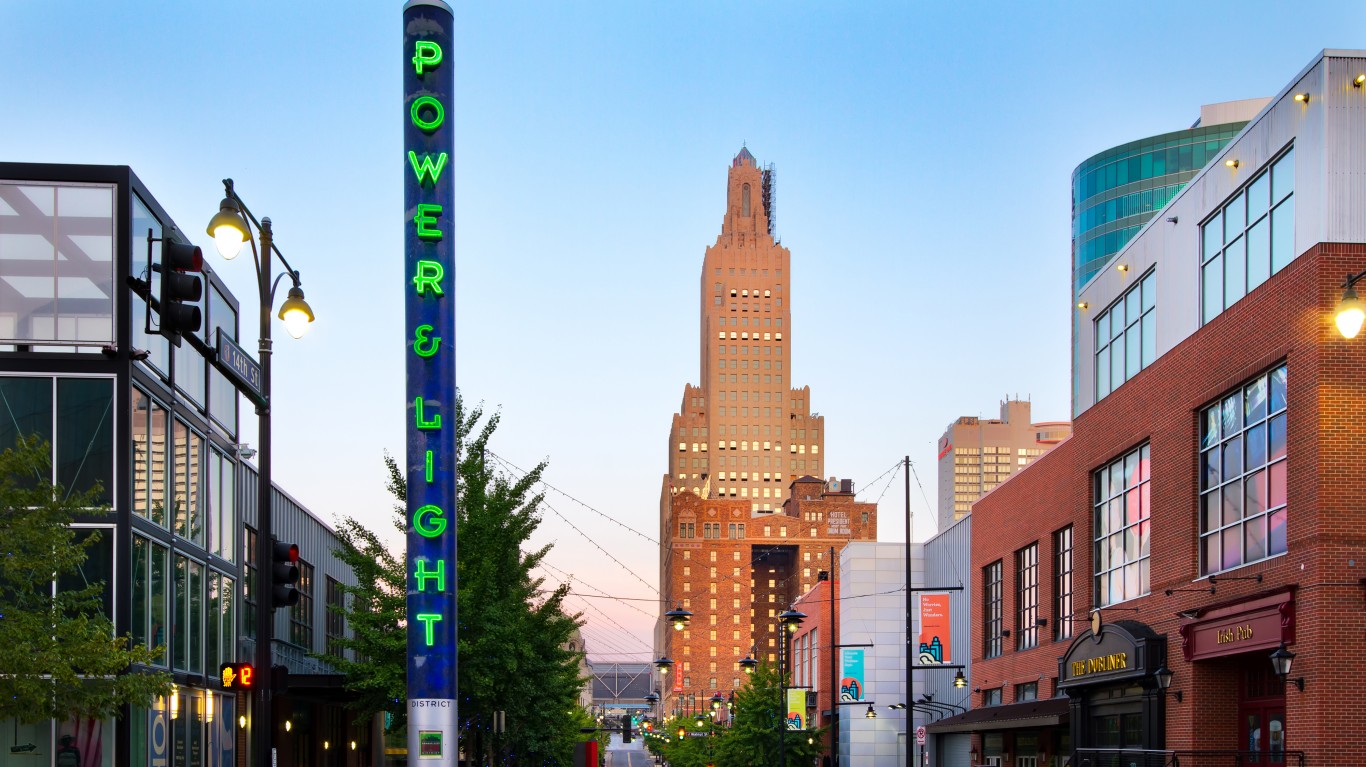
29. Kansas
> Bars per 100,000 residents 21 and older: 5.03
> Total bars: 293 (15th lowest)
> Population 21 and older: 5,825,238 (16th lowest)
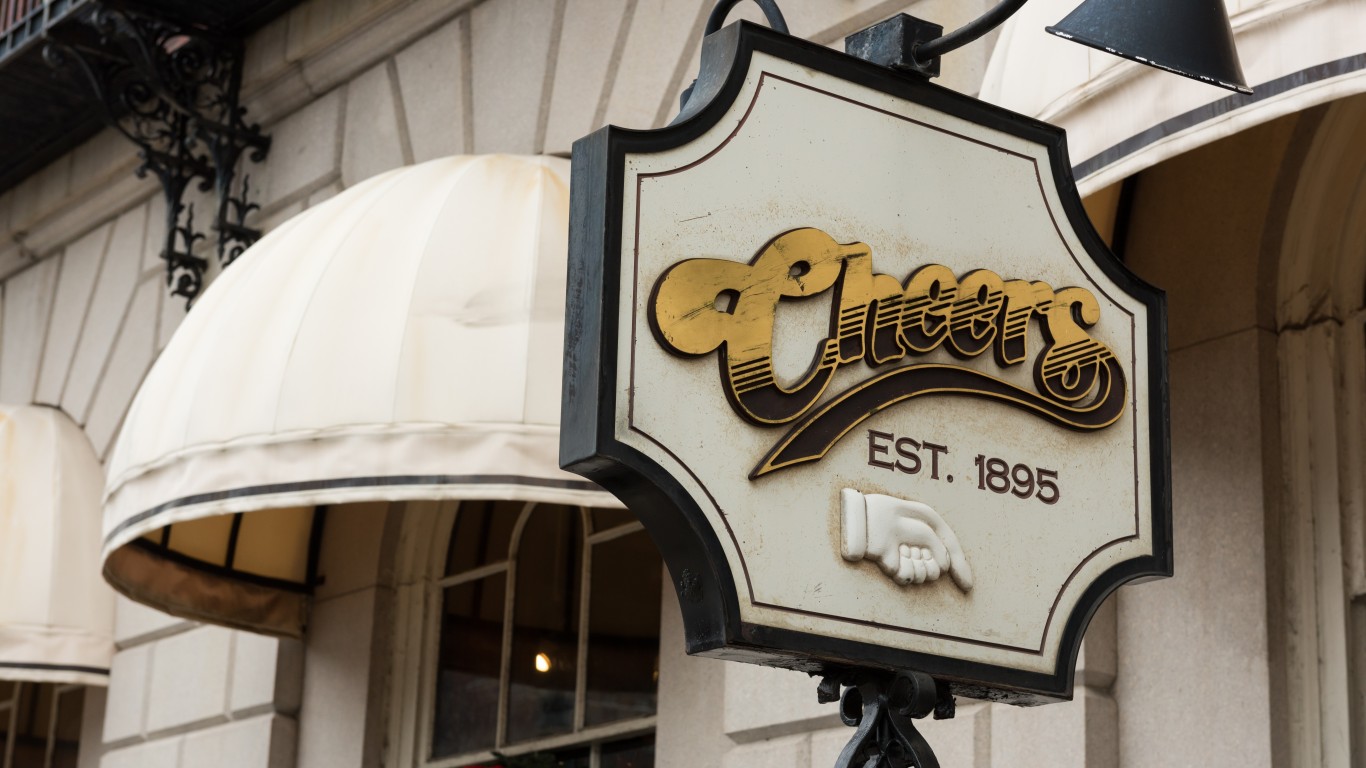
28. Massachusetts
> Bars per 100,000 residents 21 and older: 5.11
> Total bars: 702 (19th highest)
> Population 21 and older: 13,746,006 (15th highest)
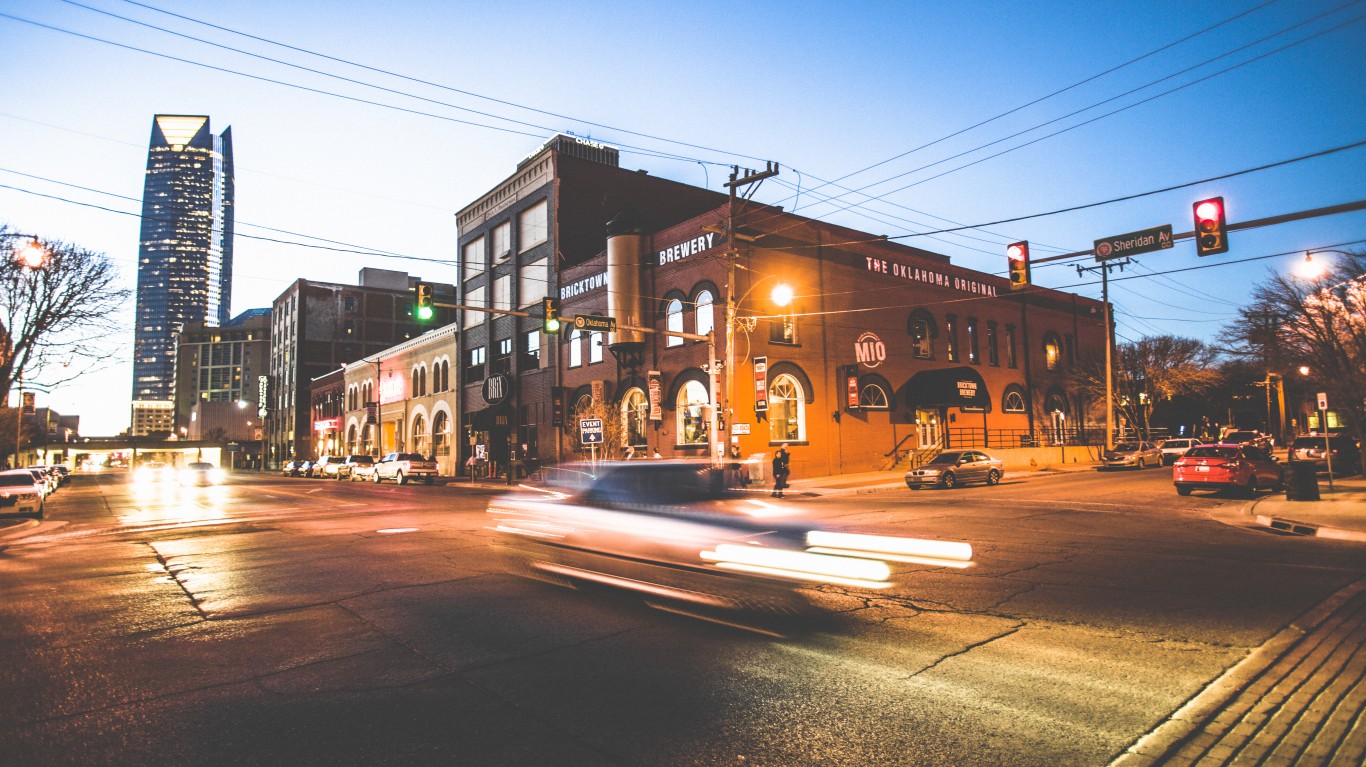
27. Oklahoma
> Bars per 100,000 residents 21 and older: 5.18
> Total bars: 409 (24th lowest)
> Population 21 and older: 7,898,684 (23rd lowest)
[in-text-ad-2]
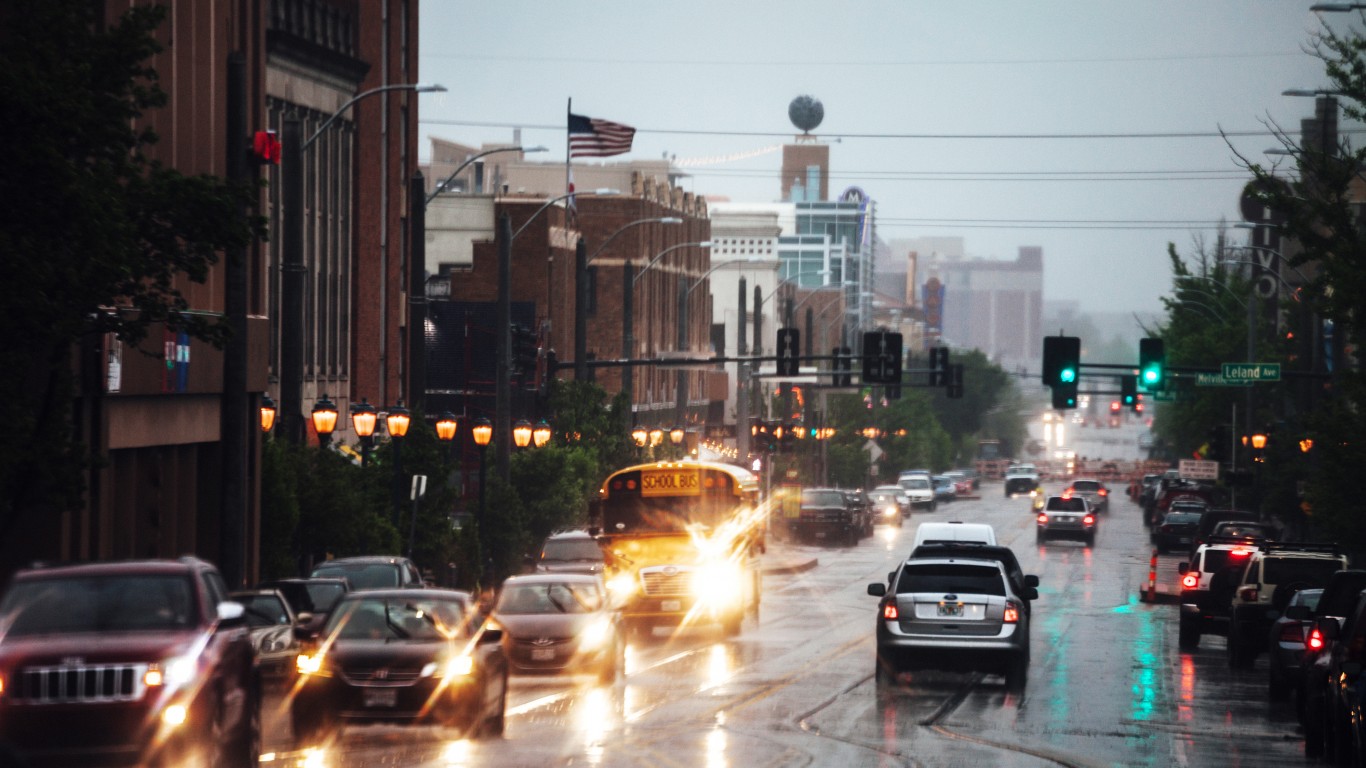
26. Missouri
> Bars per 100,000 residents 21 and older: 5.27
> Total bars: 646 (21st highest)
> Population 21 and older: 12,248,320 (18th highest)
25. Hawaii
> Bars per 100,000 residents 21 and older: 6.30
> Total bars: 179 (11th lowest)
> Population 21 and older: 2,840,148 (11th lowest)
[in-text-ad]
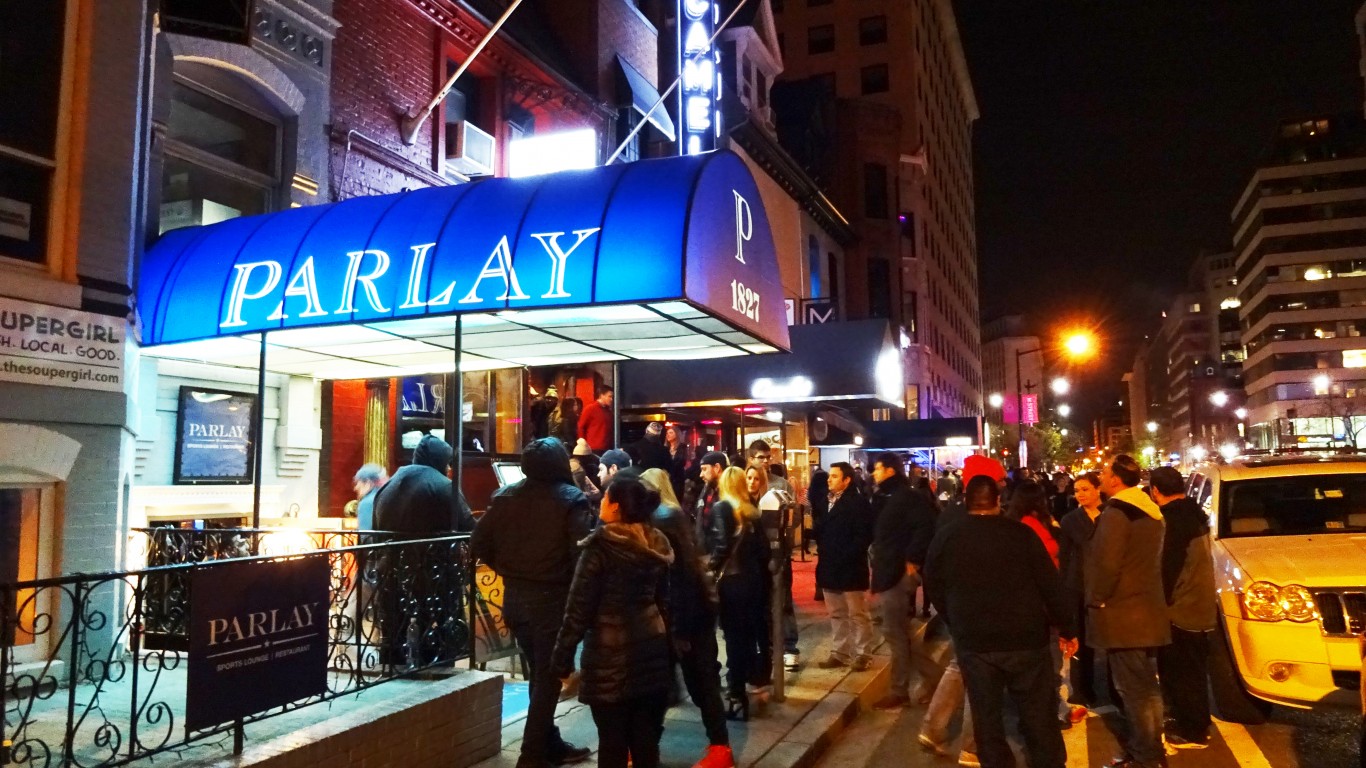
24. Washington
> Bars per 100,000 residents 21 and older: 6.33
> Total bars: 951 (10th highest)
> Population 21 and older: 15,024,930 (13th highest)
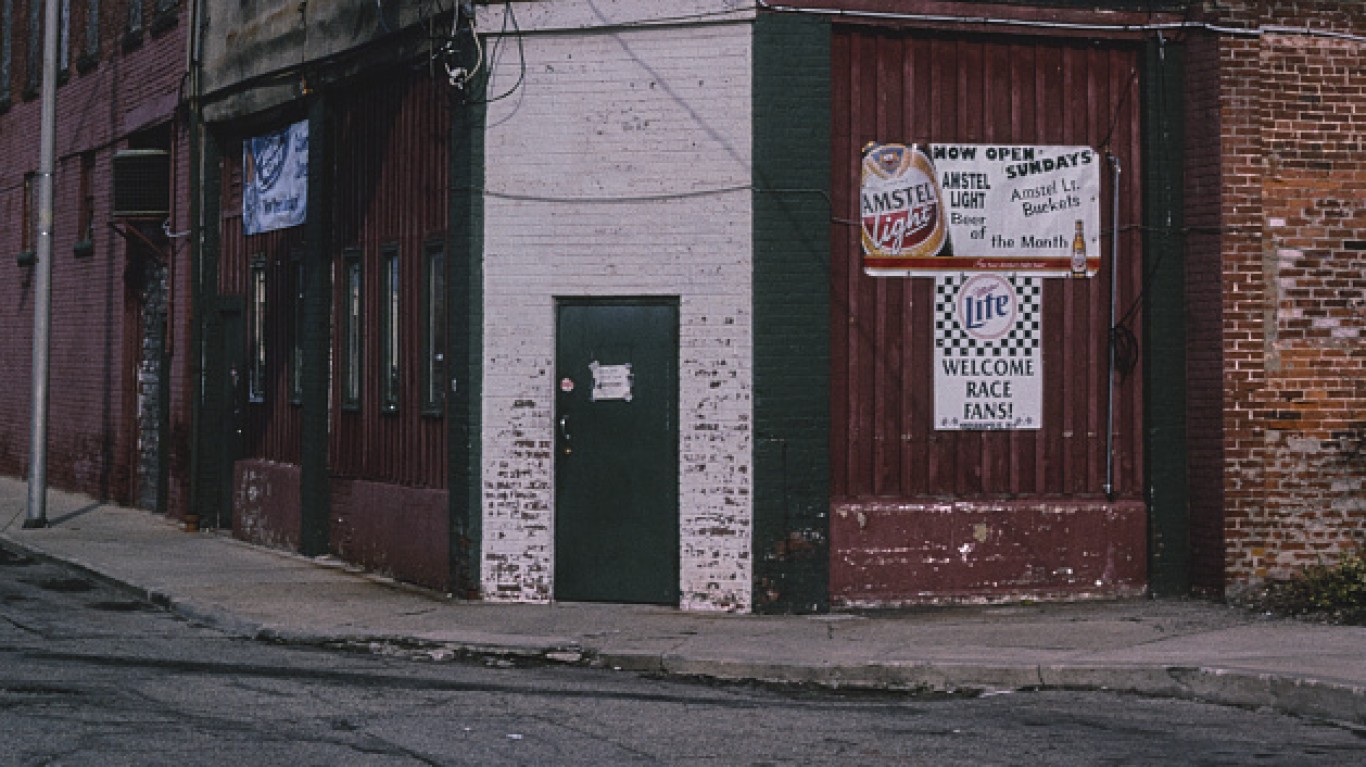
23. Indiana
> Bars per 100,000 residents 21 and older: 6.53
> Total bars: 875 (12th highest)
> Population 21 and older: 13,393,786 (17th highest)
22. Michigan
> Bars per 100,000 residents 21 and older: 6.60
> Total bars: 1316 (9th highest)
> Population 21 and older: 19,947,814 (10th highest)
[in-text-ad-2]

21. Colorado
> Bars per 100,000 residents 21 and older: 6.86
> Total bars: 780 (17th highest)
> Population 21 and older: 11,369,852 (21st highest)
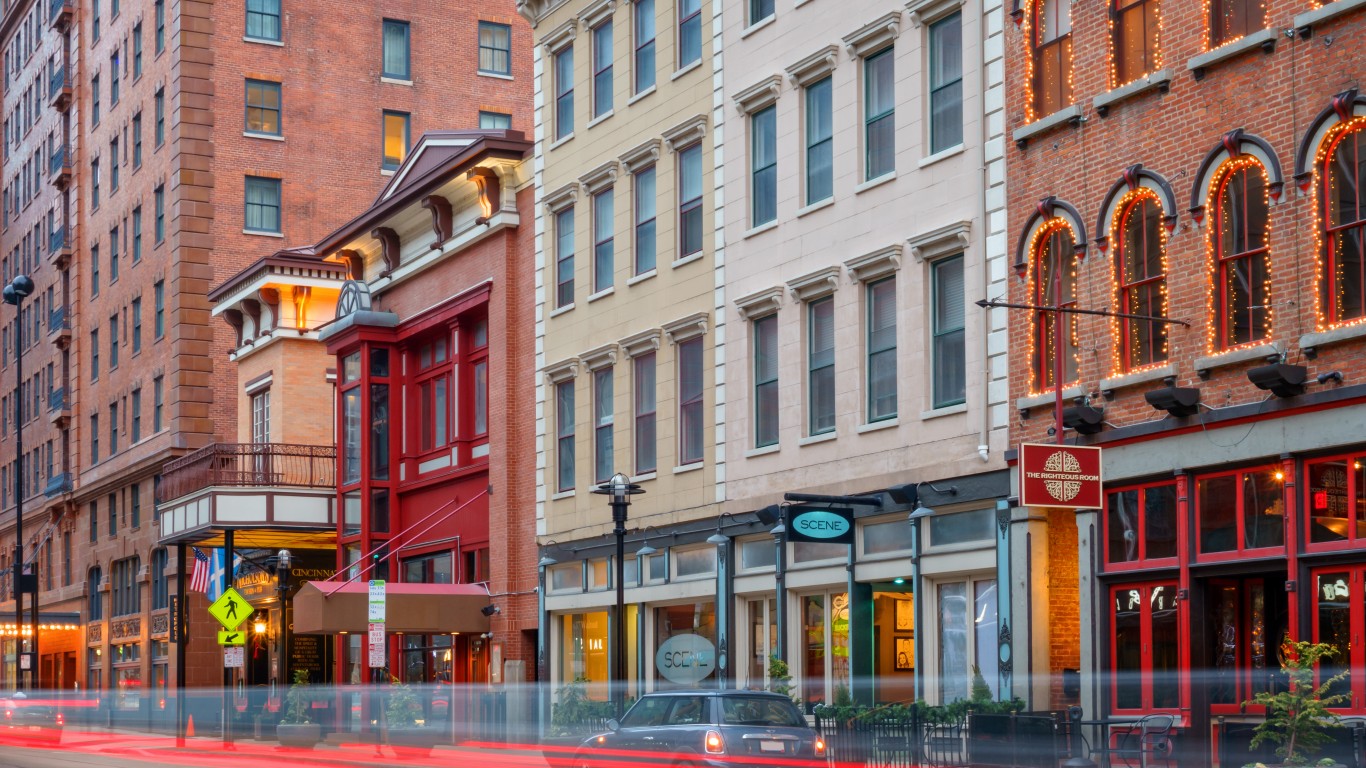
20. Ohio
> Bars per 100,000 residents 21 and older: 7.64
> Total bars: 1784 (7th highest)
> Population 21 and older: 23,350,550 (7th highest)
[in-text-ad]
19. Minnesota
> Bars per 100,000 residents 21 and older: 7.72
> Total bars: 865 (14th highest)
> Population 21 and older: 11,200,332 (22nd highest)
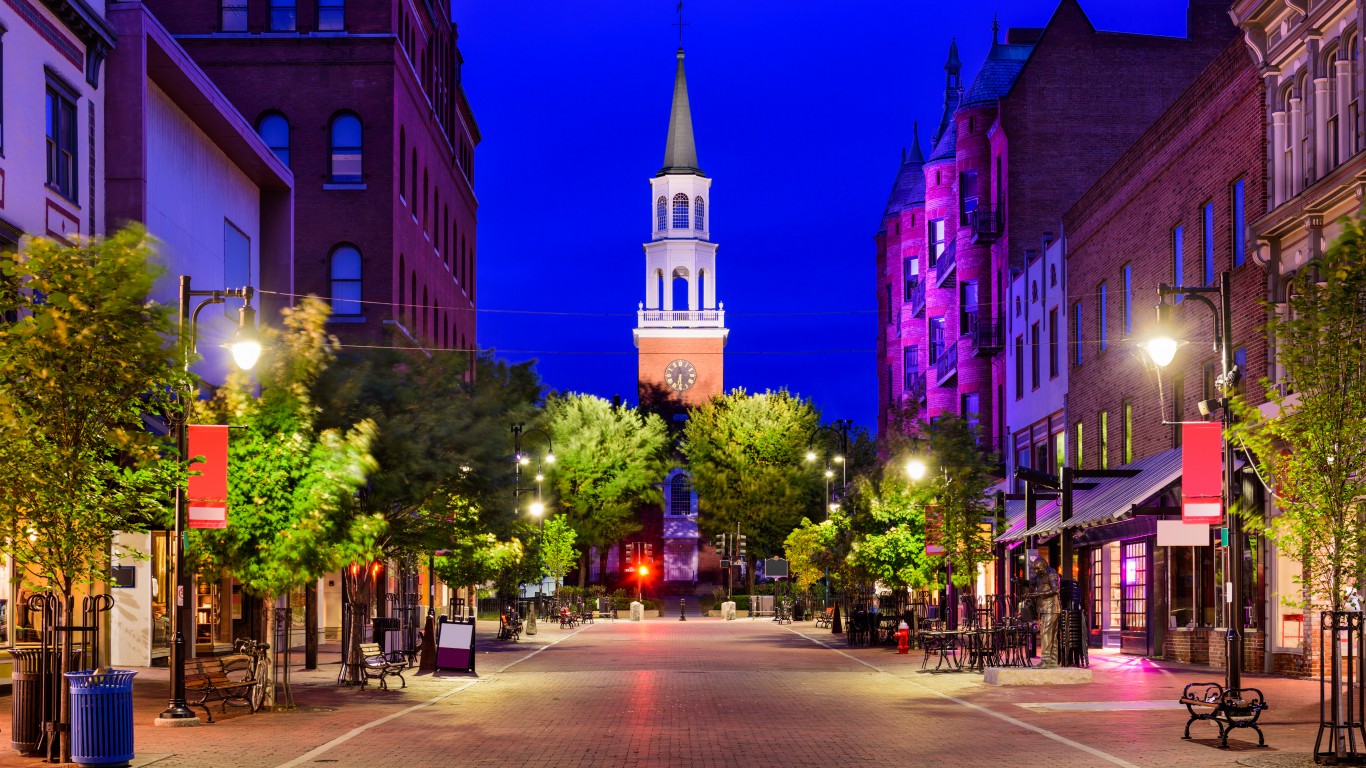
18. Vermont
> Bars per 100,000 residents 21 and older: 8.17
> Total bars: 102 (3rd lowest)
> Population 21 and older: 1,248,680 (2nd lowest)
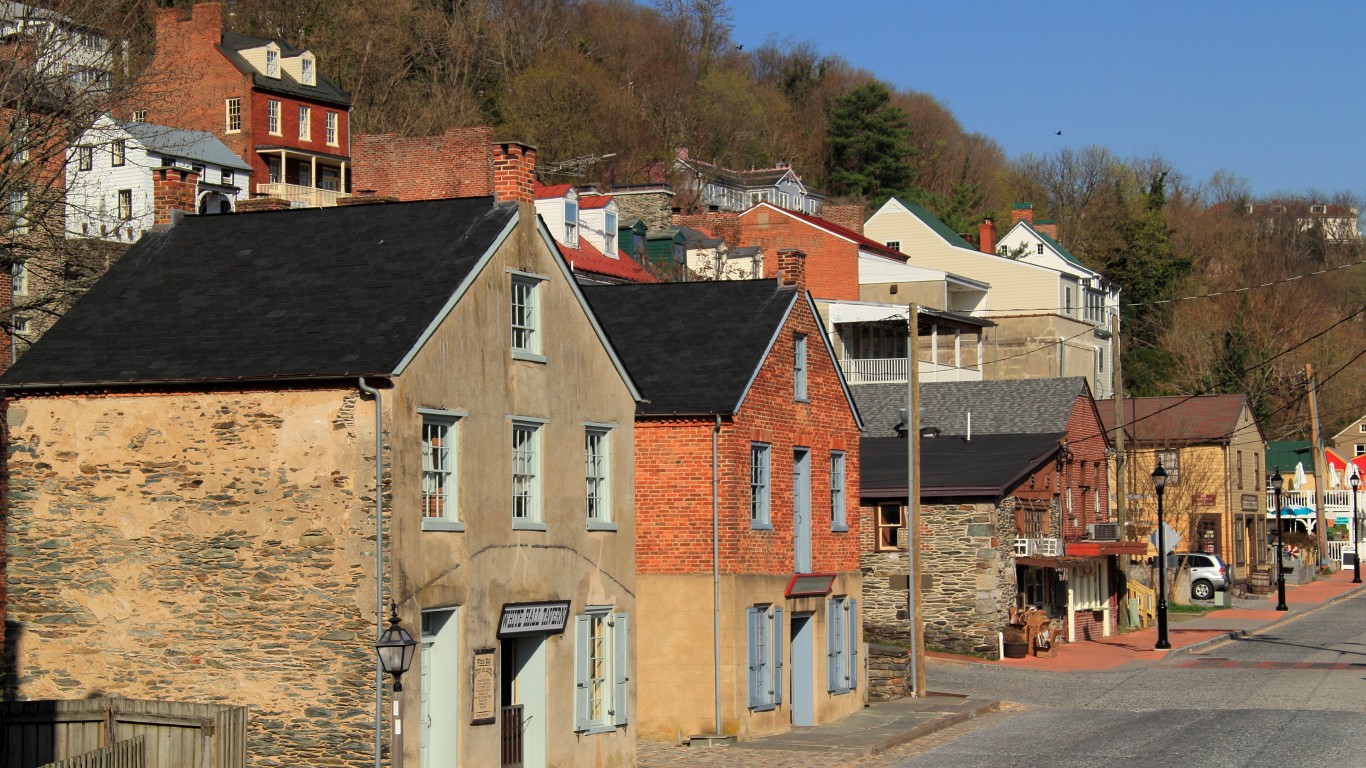
17. West Virginia
> Bars per 100,000 residents 21 and older: 8.41
> Total bars: 304 (17th lowest)
> Population 21 and older: 3,614,852 (13th lowest)
[in-text-ad-2]
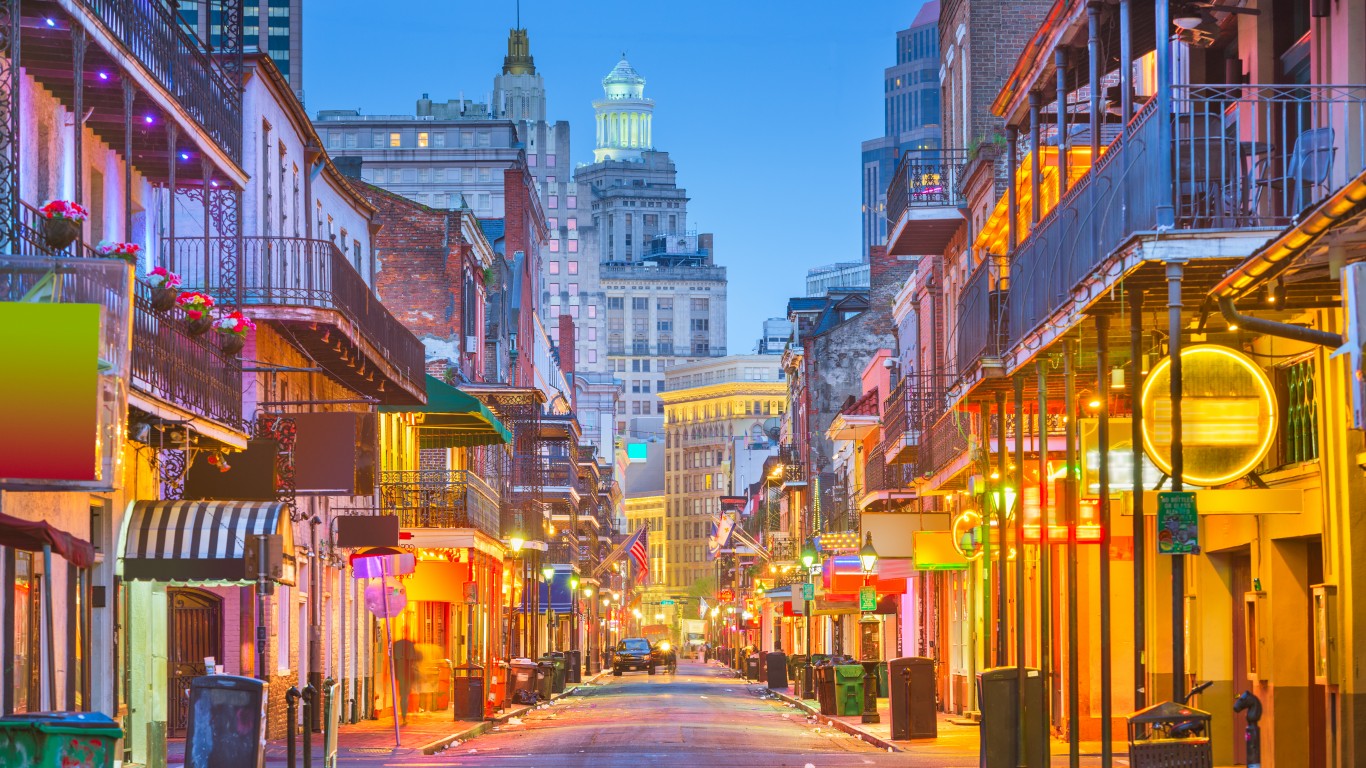
16. Louisiana
> Bars per 100,000 residents 21 and older: 8.44
> Total bars: 787 (16th highest)
> Population 21 and older: 9,329,232 (25th highest)

15. New York
> Bars per 100,000 residents 21 and older: 8.68
> Total bars: 3389 (the highest)
> Population 21 and older: 39,029,698 (4th highest)
[in-text-ad]

14. Pennsylvania
> Bars per 100,000 residents 21 and older: 9.16
> Total bars: 2345 (6th highest)
> Population 21 and older: 25,589,770 (5th highest)
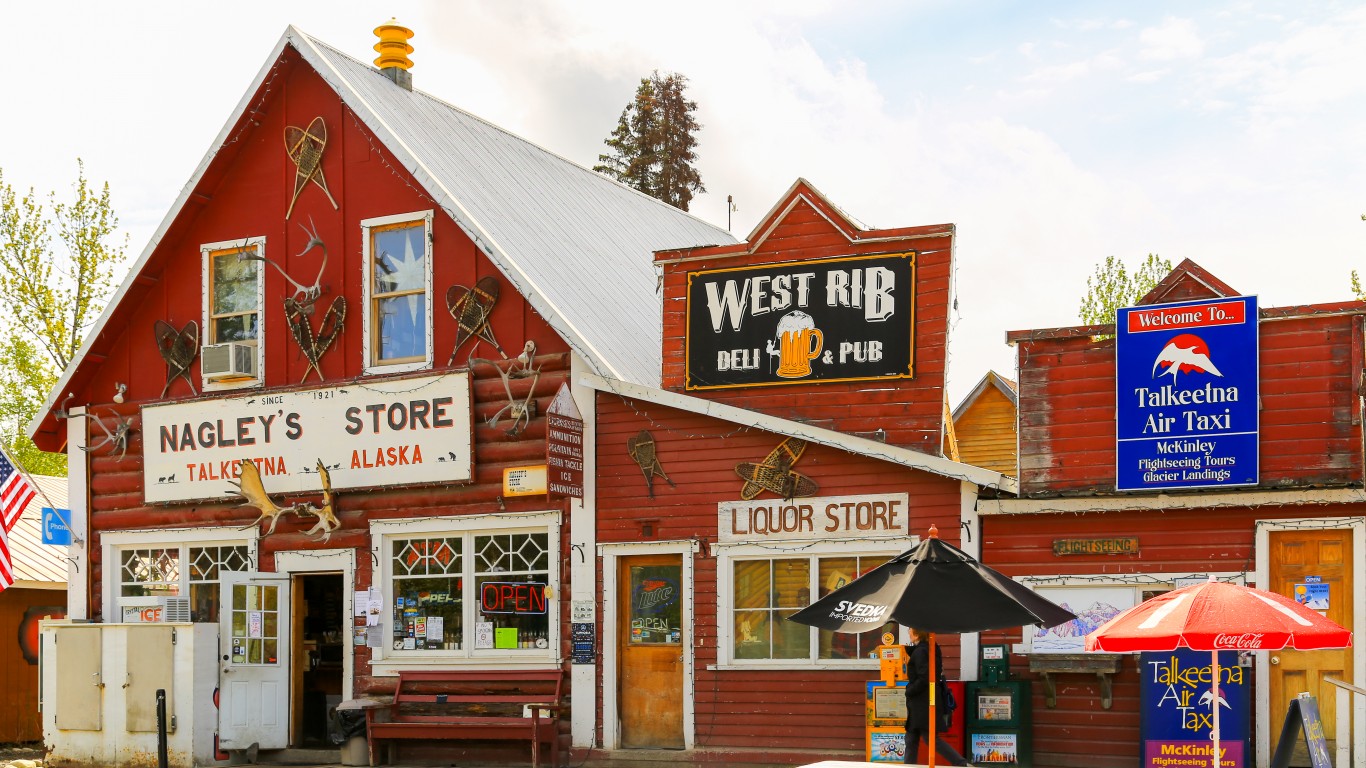
13. Alaska
> Bars per 100,000 residents 21 and older: 9.91
> Total bars: 146 (8th lowest)
> Population 21 and older: 1,473,980 (3rd lowest)
12. Idaho
> Bars per 100,000 residents 21 and older: 10.03
> Total bars: 352 (21st lowest)
> Population 21 and older: 3,508,734 (12th lowest)
[in-text-ad-2]
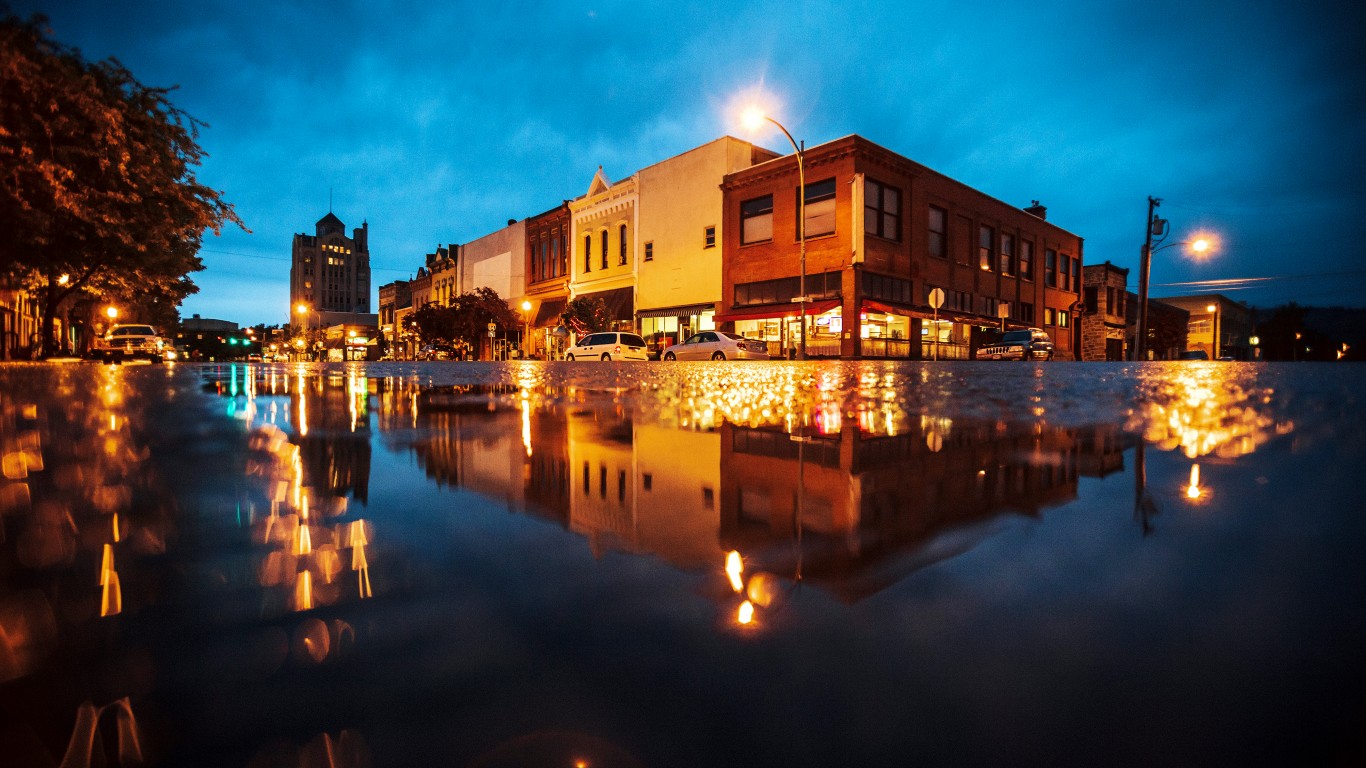
11. Oregon
> Bars per 100,000 residents 21 and older: 10.27
> Total bars: 858 (15th highest)
> Population 21 and older: 8,352,692 (24th lowest)
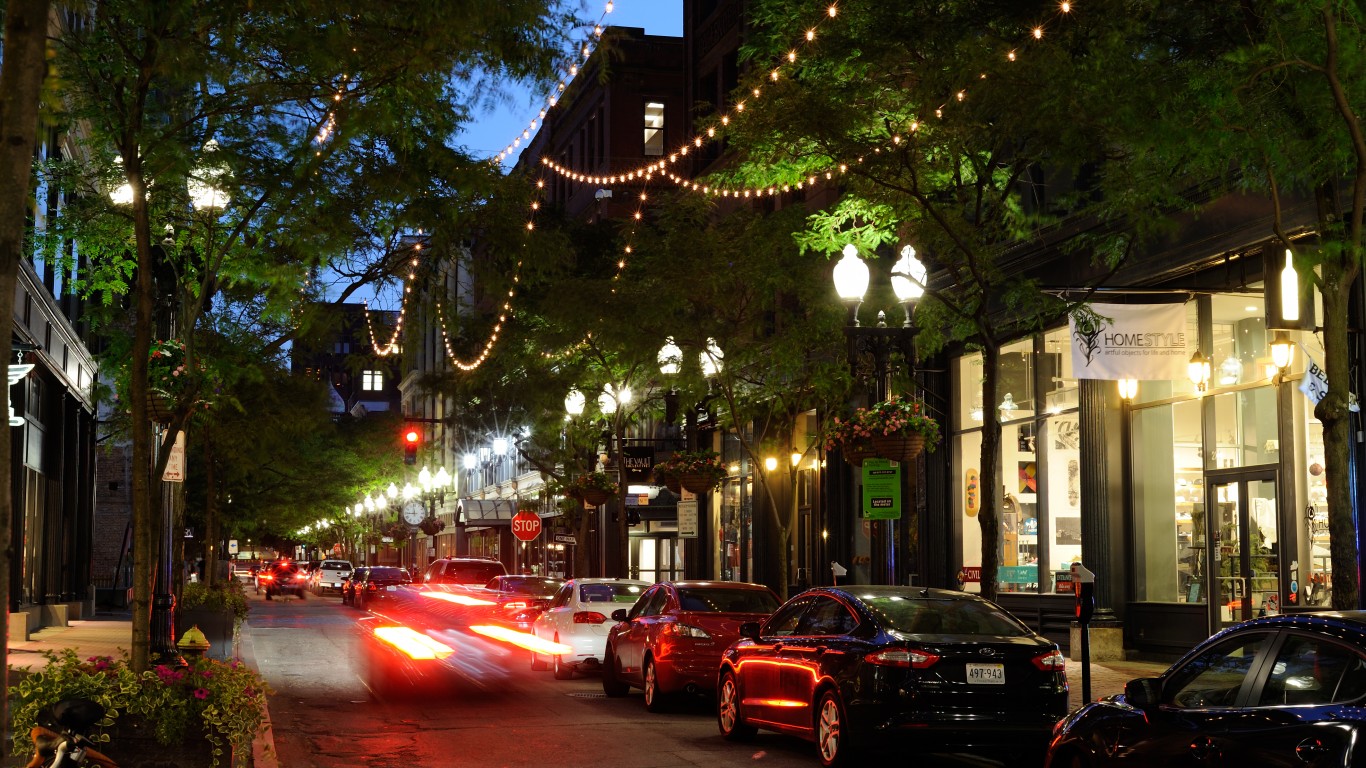
10. Rhode Island
> Bars per 100,000 residents 21 and older: 10.82
> Total bars: 229 (13th lowest)
> Population 21 and older: 2,115,596 (7th lowest)
[in-text-ad]

9. Nevada
> Bars per 100,000 residents 21 and older: 10.91
> Total bars: 661 (20th highest)
> Population 21 and older: 6,060,562 (19th lowest)
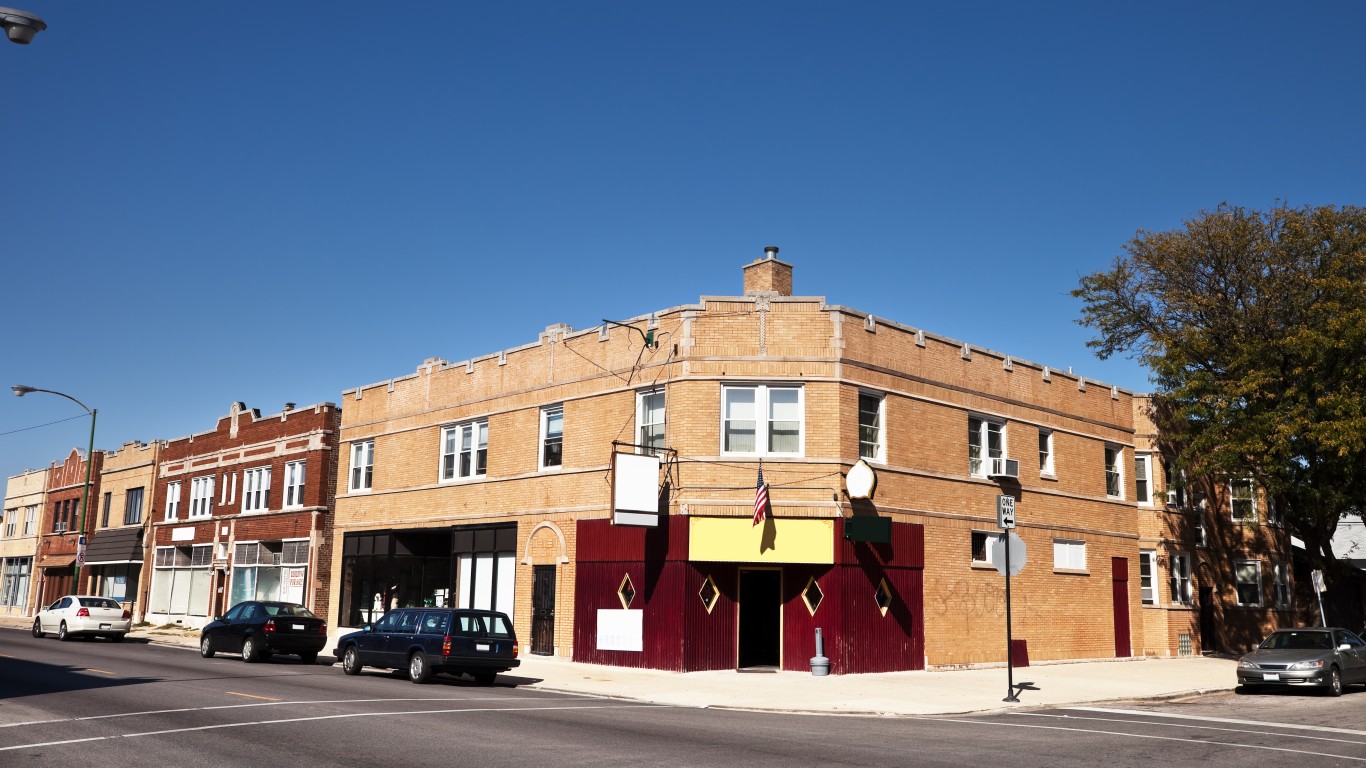
8. Illinois
> Bars per 100,000 residents 21 and older: 10.98
> Total bars: 2792 (4th highest)
> Population 21 and older: 25,432,328 (6th highest)
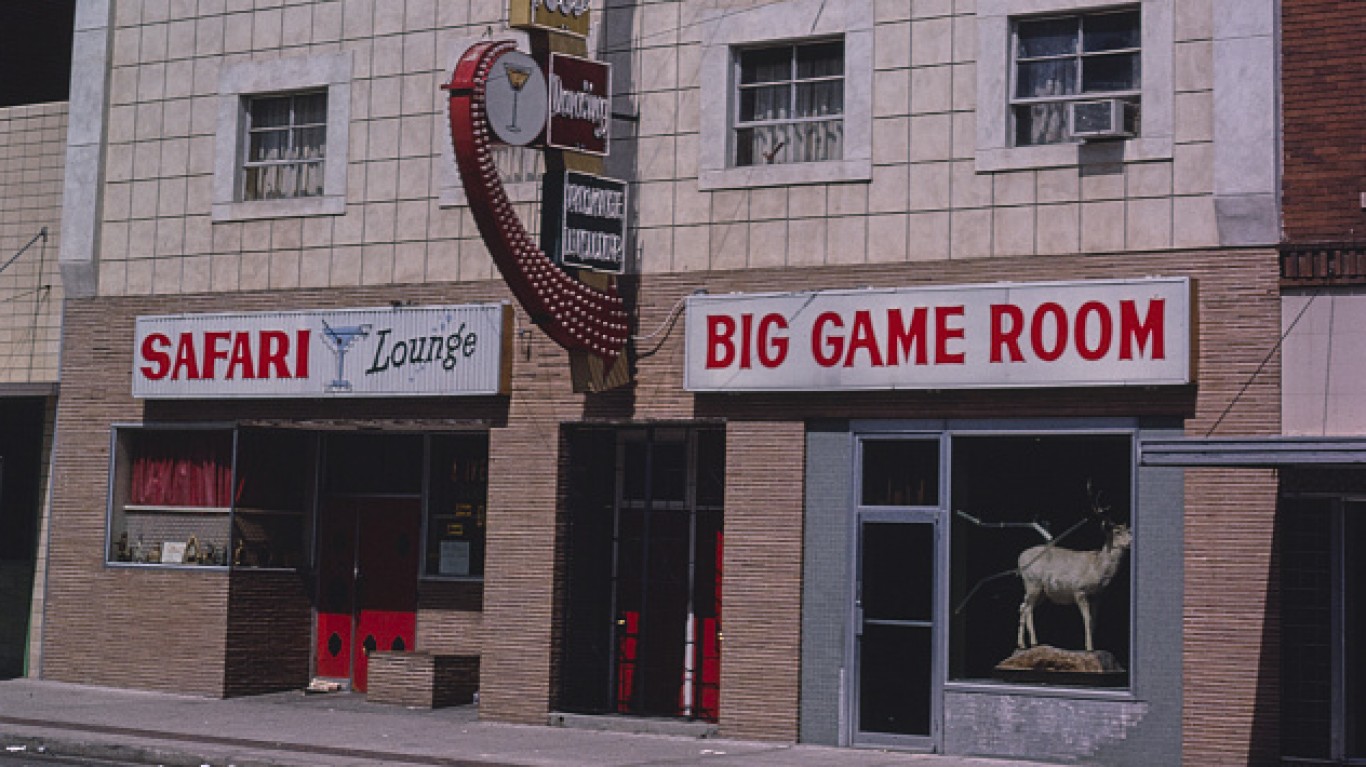
7. Nebraska
> Bars per 100,000 residents 21 and older: 13.77
> Total bars: 530 (23rd highest)
> Population 21 and older: 3,847,652 (14th lowest)
[in-text-ad-2]
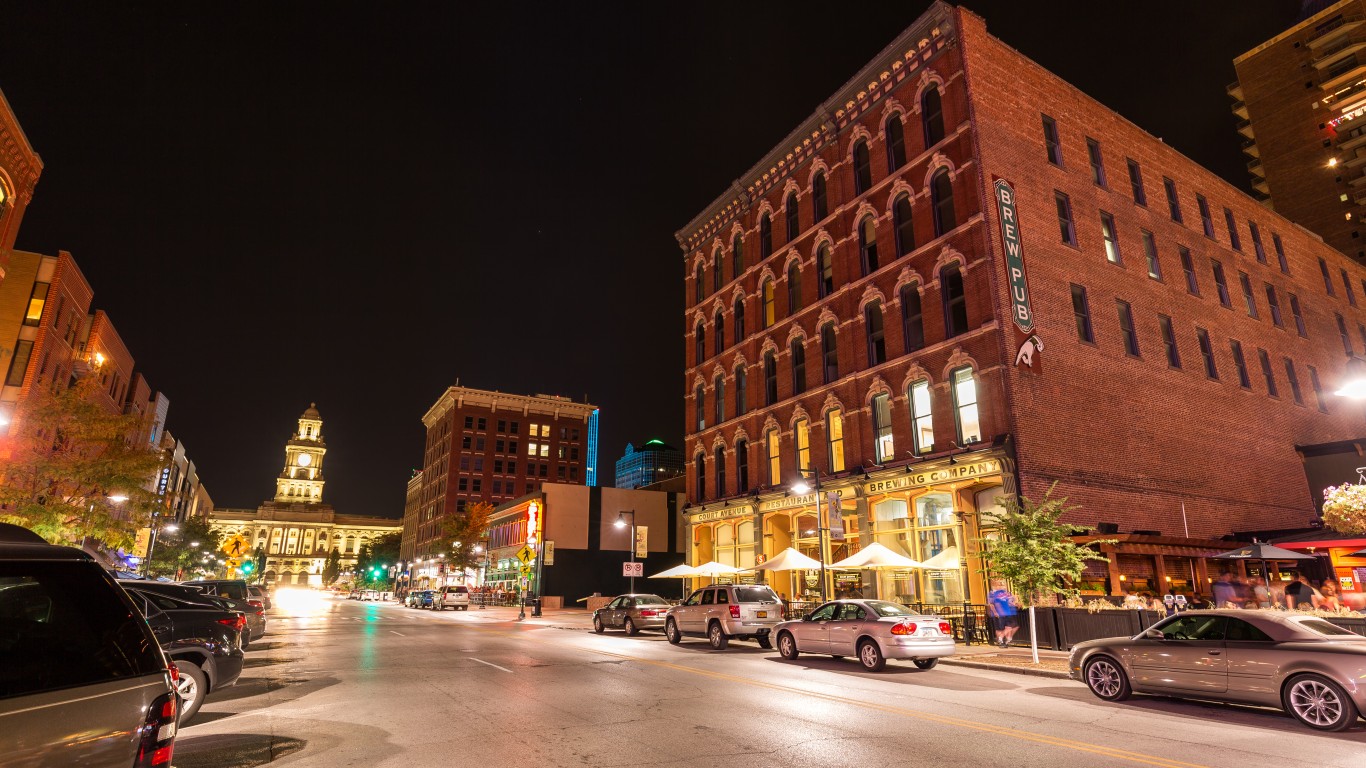
6. Iowa
> Bars per 100,000 residents 21 and older: 13.83
> Total bars: 871 (13th highest)
> Population 21 and older: 6,300,022 (20th lowest)
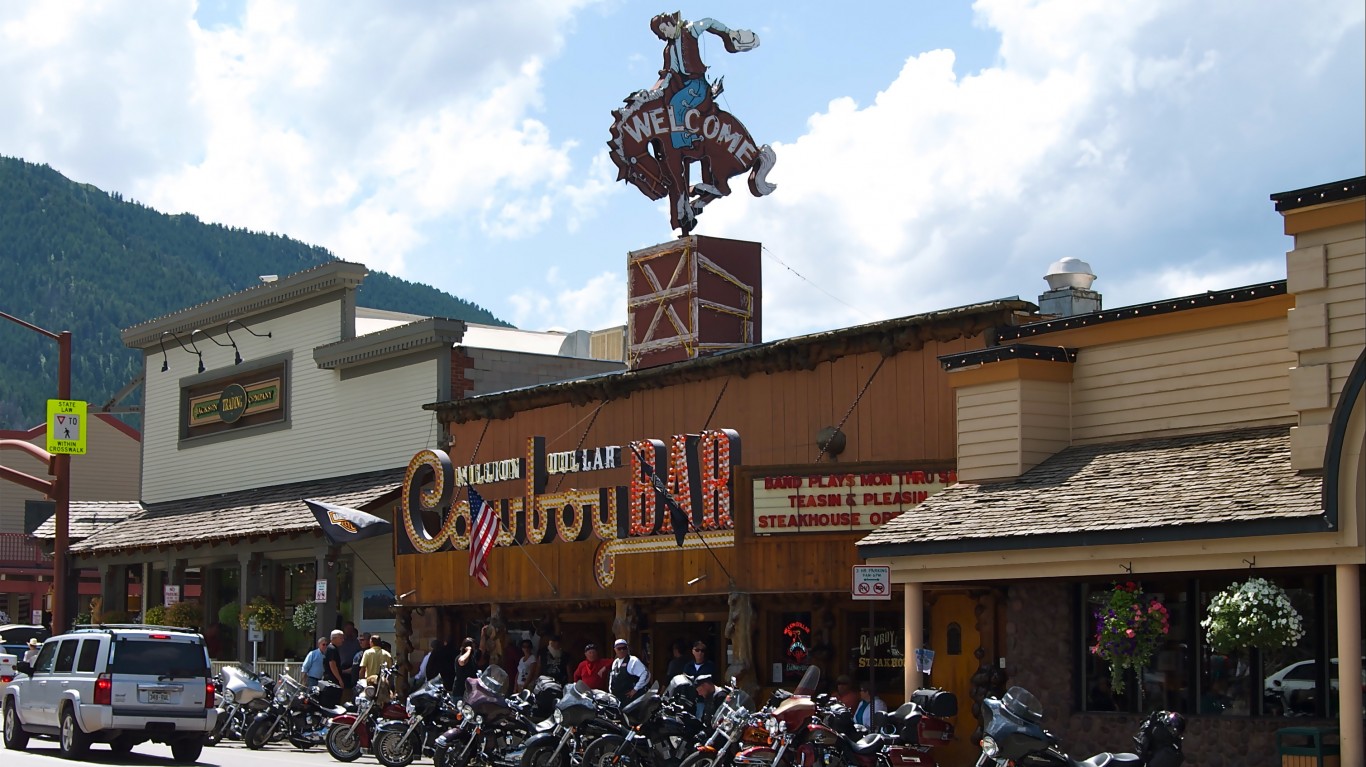
5. Wyoming
> Bars per 100,000 residents 21 and older: 13.85
> Total bars: 161 (10th lowest)
> Population 21 and older: 1,162,696 (the lowest)
[in-text-ad]
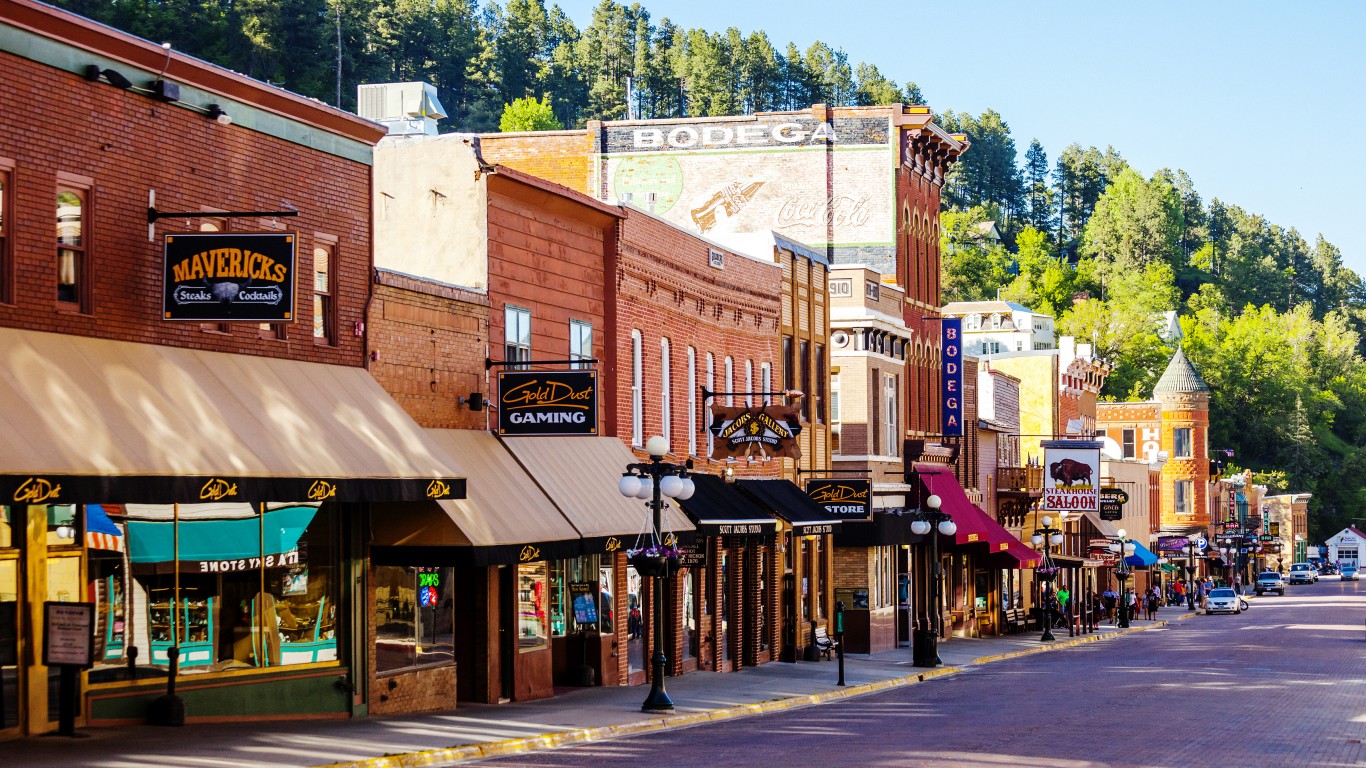
4. South Dakota
> Bars per 100,000 residents 21 and older: 17.91
> Total bars: 315 (19th lowest)
> Population 21 and older: 1,758,672 (5th lowest)

3. Wisconsin
> Bars per 100,000 residents 21 and older: 23.52
> Total bars: 2732 (5th highest)
> Population 21 and older: 11,613,950 (20th highest)
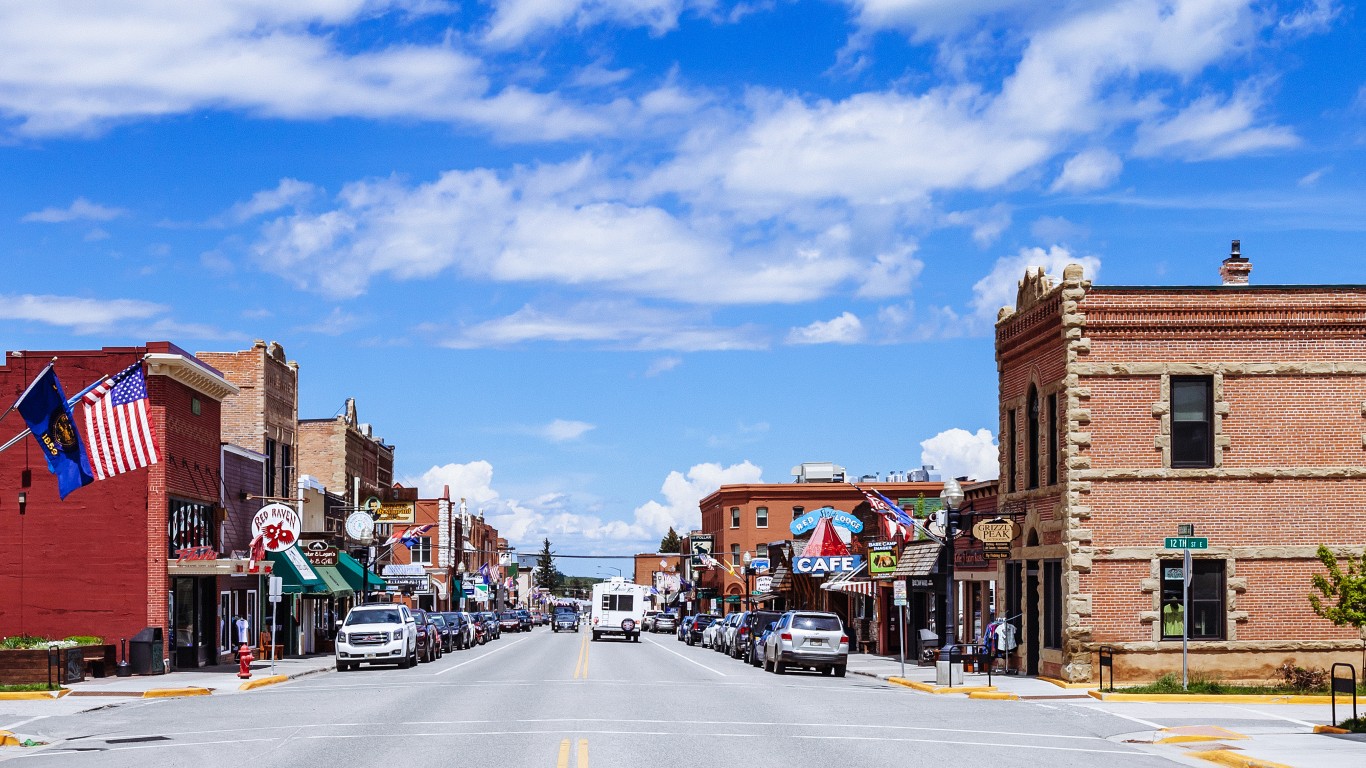
2. Montana
> Bars per 100,000 residents 21 and older: 24.58
> Total bars: 522 (24th highest)
> Population 21 and older: 2,123,410 (8th lowest)
[in-text-ad-2]
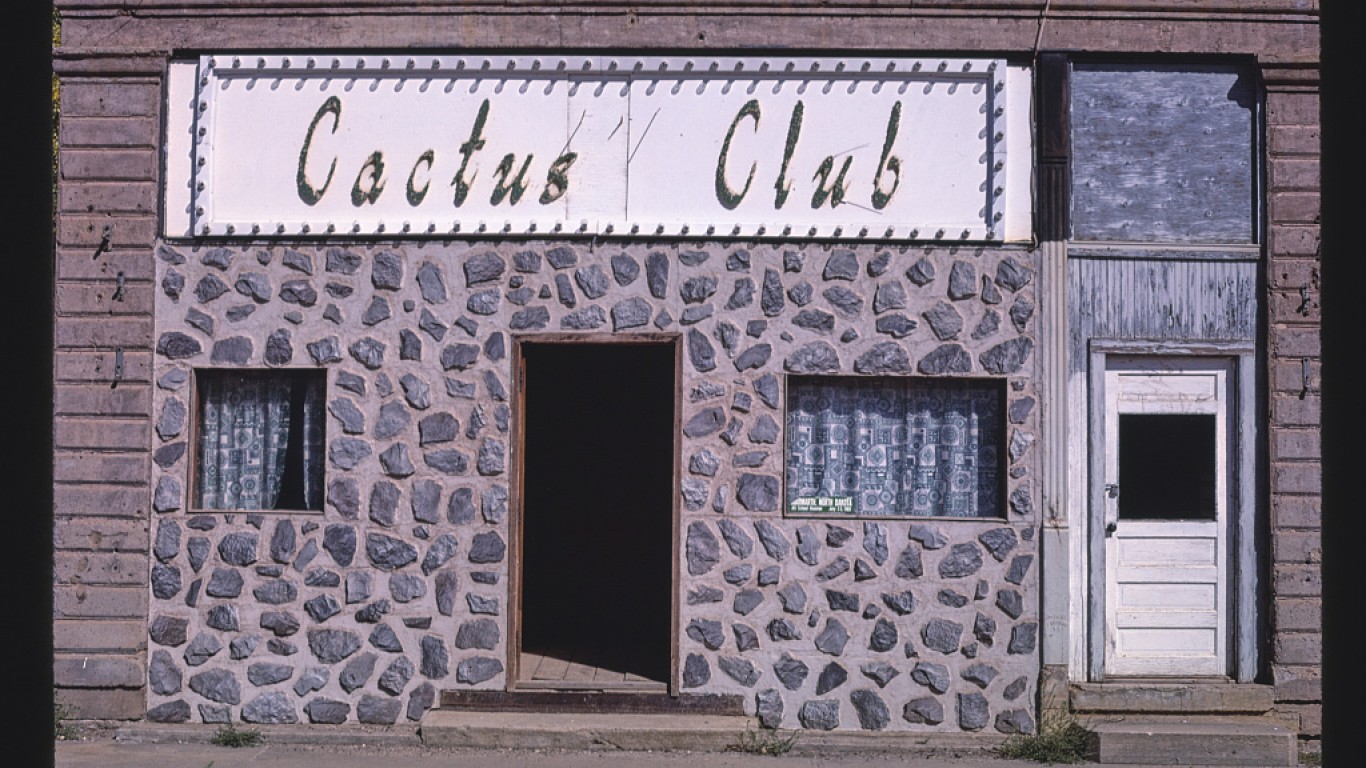
1. North Dakota
> Bars per 100,000 residents 21 and older: 24.92
> Total bars: 379 (23rd lowest)
> Population 21 and older: 1,520,788 (4th lowest)
100 Million Americans Are Missing This Crucial Retirement Tool
The thought of burdening your family with a financial disaster is most Americans’ nightmare. However, recent studies show that over 100 million Americans still don’t have proper life insurance in the event they pass away.
Life insurance can bring peace of mind – ensuring your loved ones are safeguarded against unforeseen expenses and debts. With premiums often lower than expected and a variety of plans tailored to different life stages and health conditions, securing a policy is more accessible than ever.
A quick, no-obligation quote can provide valuable insight into what’s available and what might best suit your family’s needs. Life insurance is a simple step you can take today to help secure peace of mind for your loved ones tomorrow.
Click here to learn how to get a quote in just a few minutes.
Thank you for reading! Have some feedback for us?
Contact the 24/7 Wall St. editorial team.
 24/7 Wall St.
 24/7 Wall St.
 24/7 Wall St.