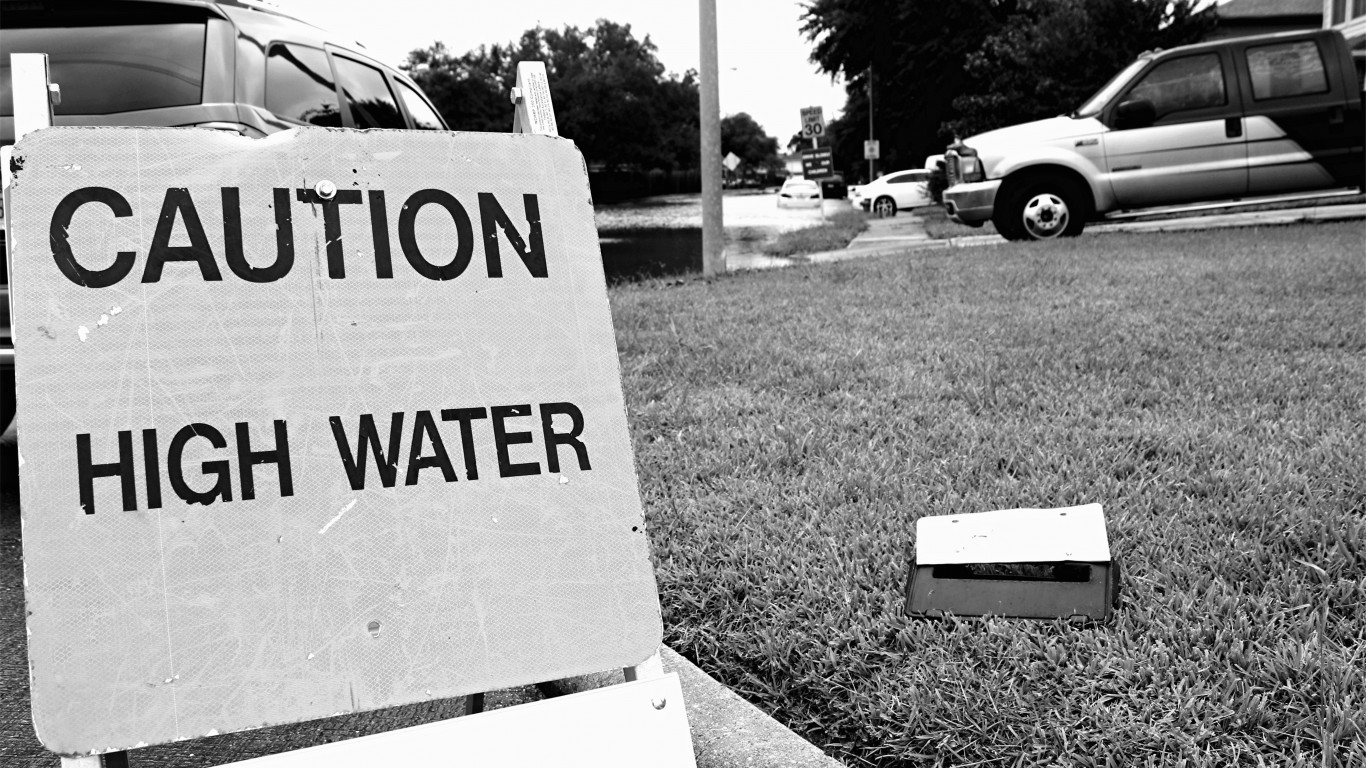
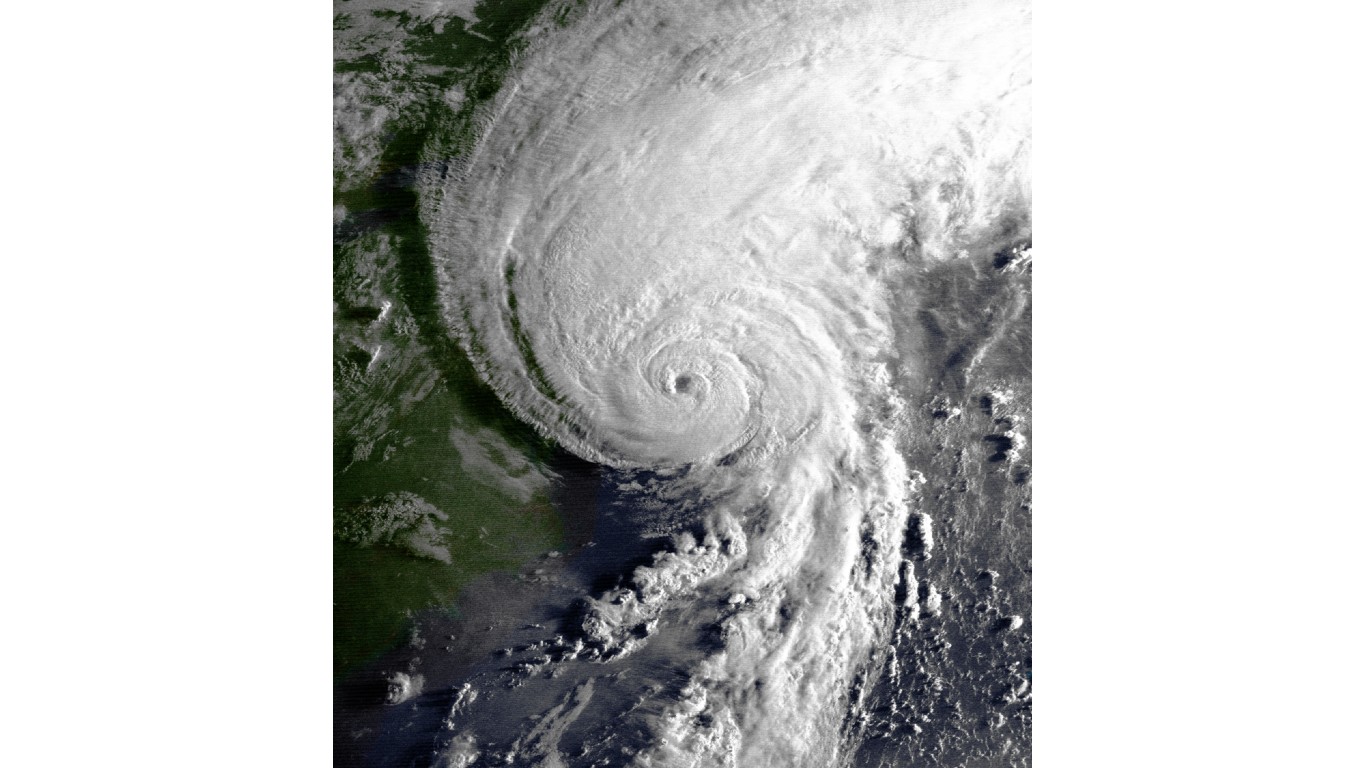
The 2022 Atlantic hurricane season kicked off in June and will run through Nov. 1, and the National Oceanic and Atmospheric Administration already predicts above-average hurricane activity this year. NOAA is projecting 14 to 21 named storms with winds of 39 miles per hour or higher. Of that number, six to 10 are likely to accelerate into hurricanes marked by at least 74 mph winds. Three to six of these could be major hurricanes classified as category 3, 4, or 5, with winds of 111 mph or greater.
Areas along the Gulf Coast and the Atlantic Seaboard traditionally have been hit hardest by these devastating storms. (Here are before and after pictures of the worst hurricanes in American history.)
To determine the cities where hurricanes could cause the most damage, 24/7 Wall St. reviewed data from housing information provider CoreLogic’s 2022 Hurricane Report. Metropolitan areas were ranked in two lists: one based on the number of single-family homes at moderate or greater risk of damage from storm surge flooding this hurricane season, and the second based on the number of single-family homes at risk of hurricane force winds. All other data came either from the report or the U.S. Census Bureau.
In 2021, Hurricane Ida caused the most destruction. Hitting Louisiana in late August, the storm’s devastating effects reached as far as New York City, where massive flooding shut down the city’s transportation system. As the largest catastrophe in the U.S. last year, Hurricane Ida led to $37 billion in insured losses, reinsurance firm Gallagher Re calculates. In total, CoreLogic estimates damages from the last hurricane season hit $80 billion, making it the third most costly year behind 2005 and 2017.
Perhaps the greatest threat to lives and property is a storm surge. Pushed by high winds and low pressure, sea waters rise, forming a massive wall of water that levels properties in its wake. Coming onshore, the storm surge overwhelms drainage systems already burdened by days of heavy rains.
The city at risk of bearing the greatest financial hit from the upcoming hurricane season is not located along the Gulf Coast. It is the heavily-populated New York City. With a population of nearly 19.3 million, the city has 786,279 single-family homes at risk of storm surge and 3.8 million homes at risk of high winds. In a storm surge event, repair costs for those single-family residences could total $369.9 billion, while repair costs from wind damage could cost an estimated $1.9 trillion. (But what is the worst natural disaster in every state?)
Click here to see the cities at the greatest risk of hurricane disaster this year
Click here to read our detailed methodology
STORM SURGE

15. Salisbury, MD
> Single-family homes at storm surge risk: 136,220 (repair cost: $39.3 billion)
> Multi-family homes at storm surge risk: N/A
> Metro area population: 411,137
> Median home value: $243,900
> Homes built before 1980: 34.0%
[in-text-ad]
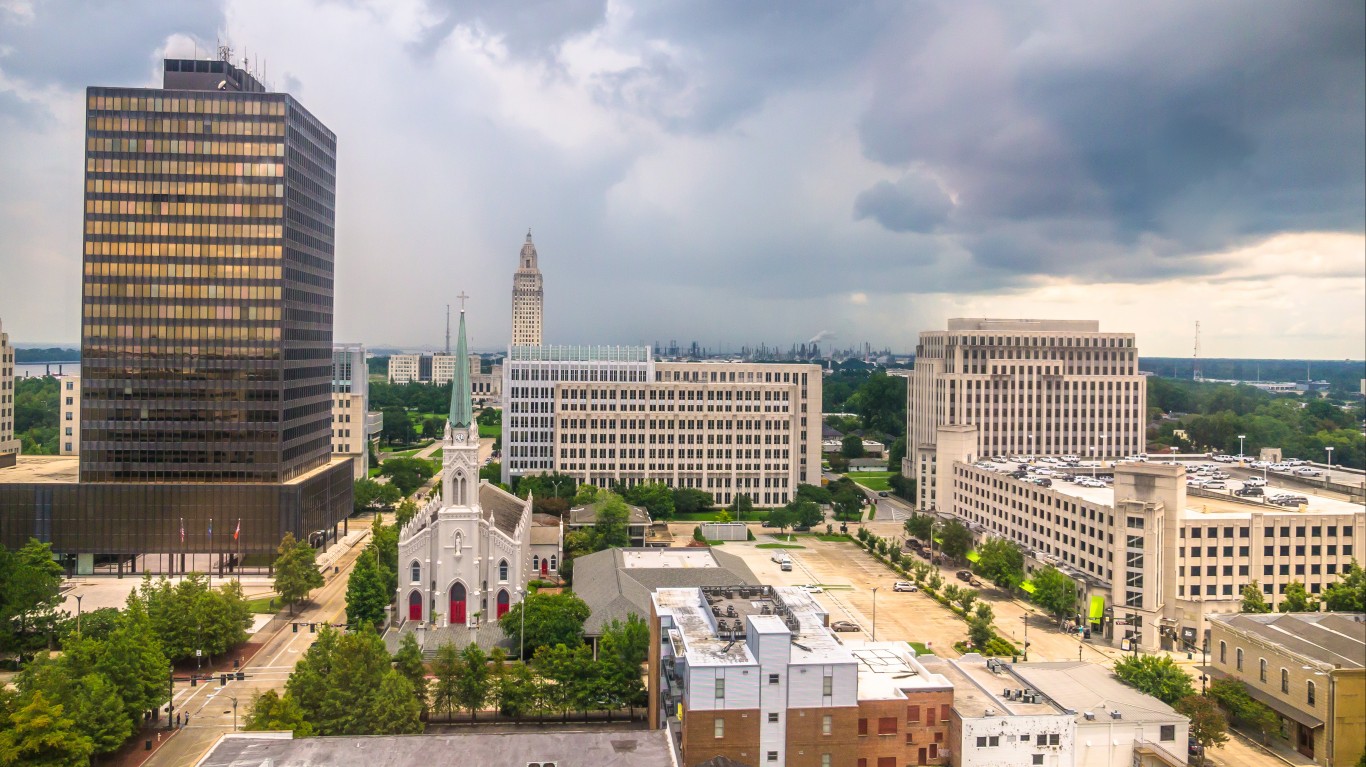
14. Baton Rouge, LA
> Single-family homes at storm surge risk: 141,932 (repair cost: $40.8 billion)
> Multi-family homes at storm surge risk: N/A
> Metro area population: 856,779
> Median home value: $190,000
> Homes built before 1980: 39.7%

13. Lafayette, LA
> Single-family homes at storm surge risk: 148,646 (repair cost: $37.1 billion)
> Multi-family homes at storm surge risk: N/A
> Metro area population: 490,220
> Median home value: $162,600
> Homes built before 1980: 44.6%

12. Myrtle Beach, SC
> Single-family homes at storm surge risk: 183,757 (repair cost: $41.9 billion)
> Multi-family homes at storm surge risk: N/A
> Metro area population: 481,489
> Median home value: $195,700
> Homes built before 1980: 18.1%
[in-text-ad-2]

11. Charleston, SC
> Single-family homes at storm surge risk: 188,329 (repair cost: $61.5 billion)
> Multi-family homes at storm surge risk: N/A
> Metro area population: 790,955
> Median home value: $249,800
> Homes built before 1980: 33.3%
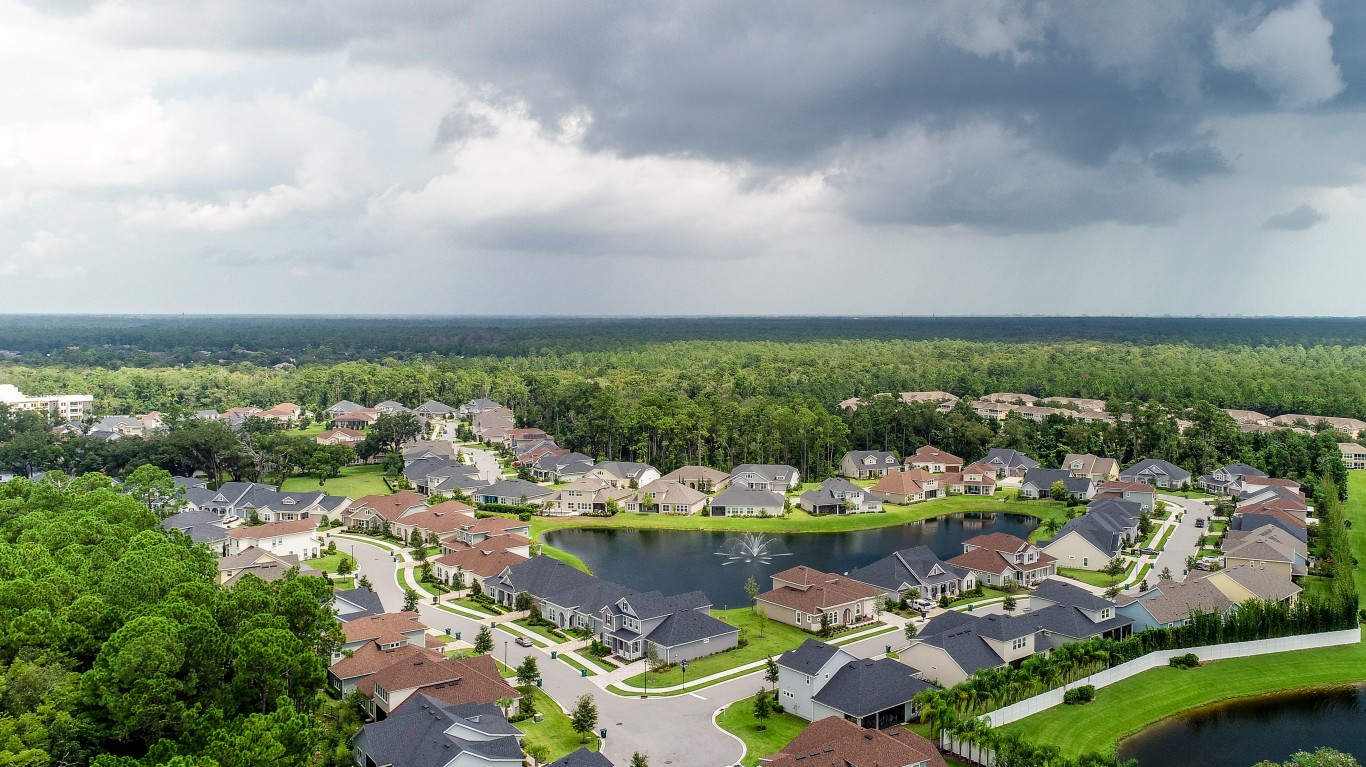
10. Jacksonville, FL
> Single-family homes at storm surge risk: 194,583 (repair cost: $55.4 billion)
> Multi-family homes at storm surge risk: 4,219 (repair cost: $1.8 billion)
> Metro area population: 1,533,796
> Median home value: $220,000
> Homes built before 1980: 35.4%
[in-text-ad]
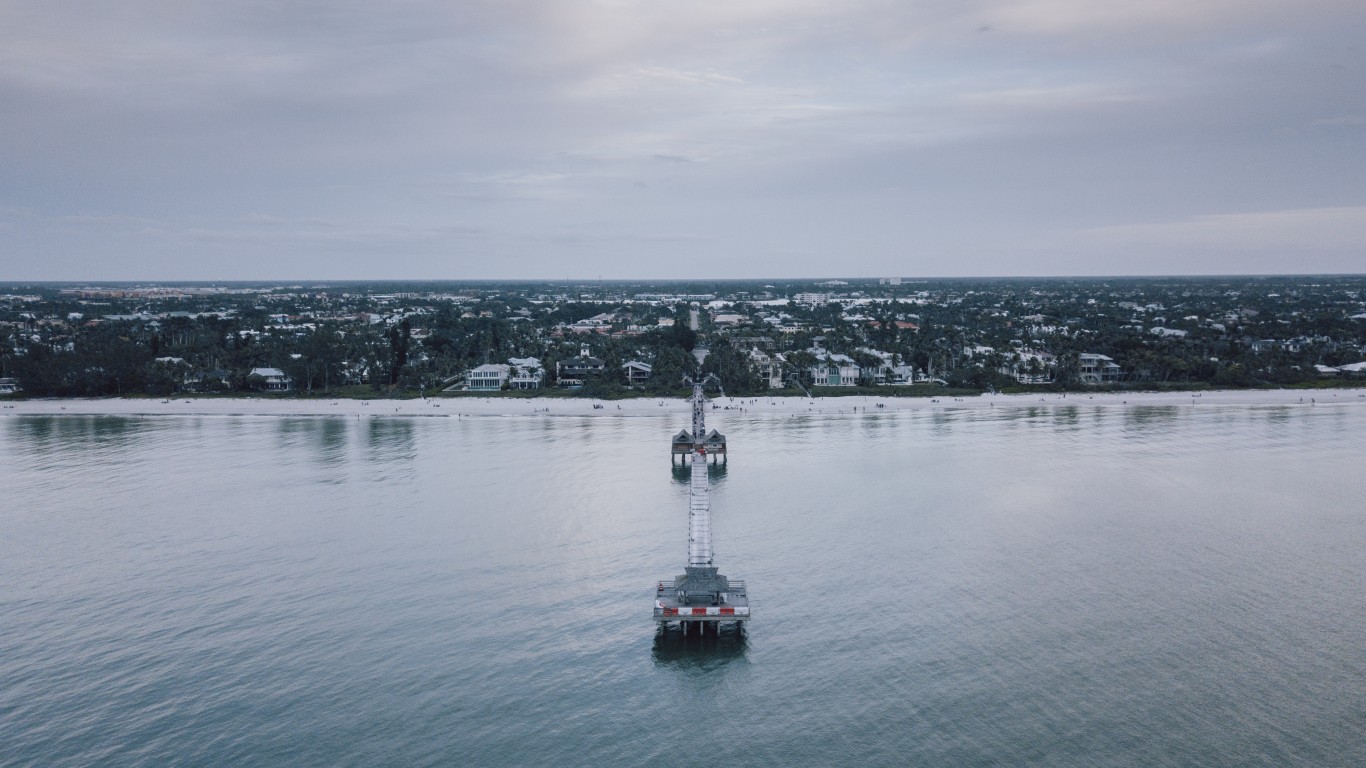
9. Naples, FL
> Single-family homes at storm surge risk: 200,276 (repair cost: $55.4 billion)
> Multi-family homes at storm surge risk: 2,498 (repair cost: $1.0 billion)
> Metro area population: 379,345
> Median home value: $366,600
> Homes built before 1980: 18.1%
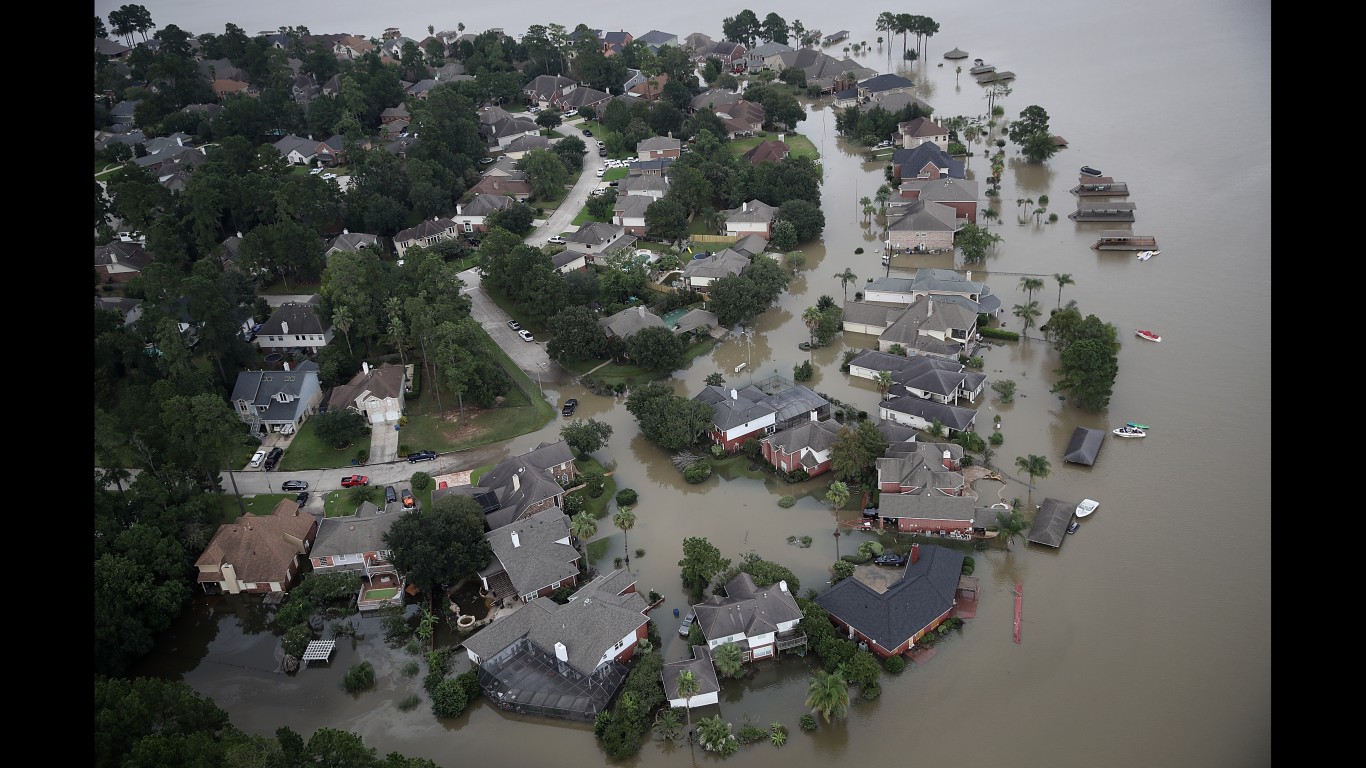
8. Houston, TX
> Single-family homes at storm surge risk: 264,461 (repair cost: $71.0 billion)
> Multi-family homes at storm surge risk: N/A
> Metro area population: 6,979,613
> Median home value: $208,100
> Homes built before 1980: 35.7%
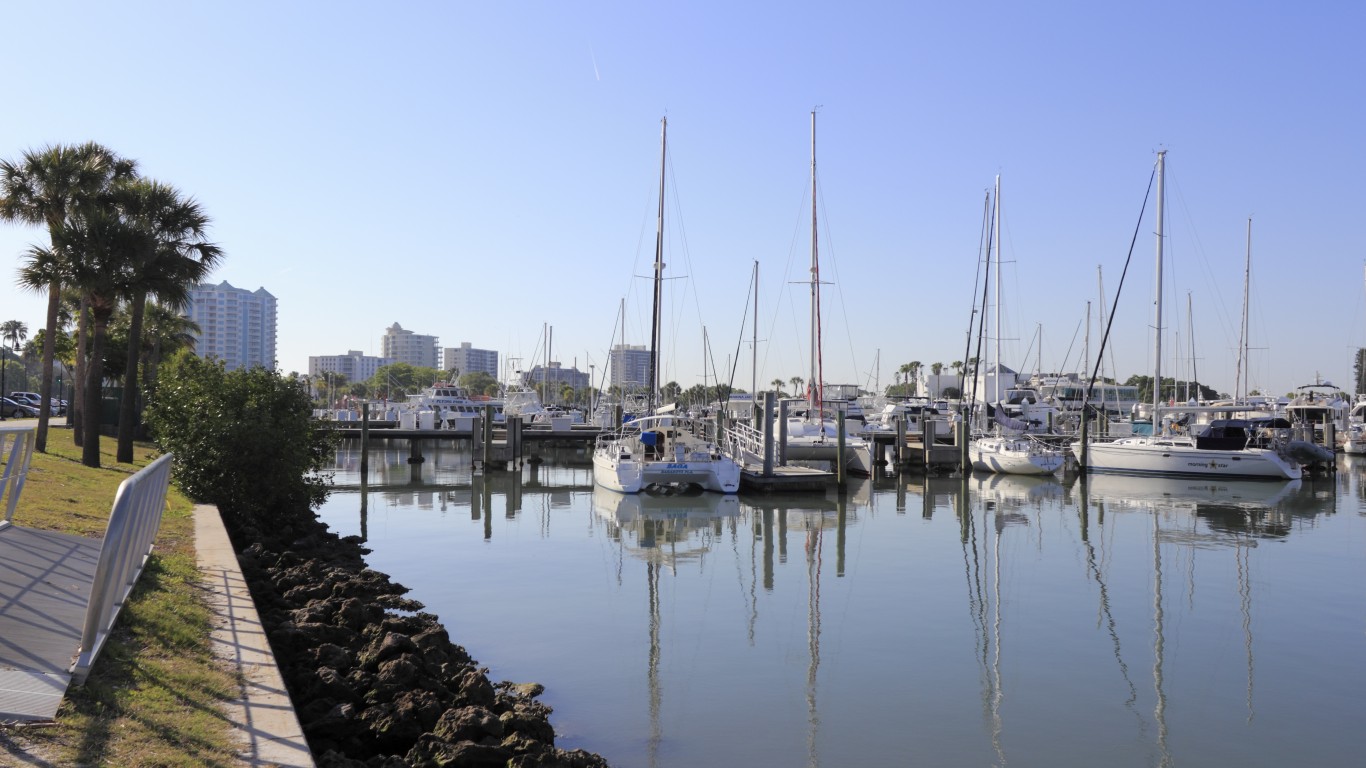
7. North Port, FL
> Single-family homes at storm surge risk: 293,538 (repair cost: $73.4 billion)
> Multi-family homes at storm surge risk: 3,330 (repair cost: $1.1 billion)
> Metro area population: 821,613
> Median home value: $261,100
> Homes built before 1980: 38.5%
[in-text-ad-2]
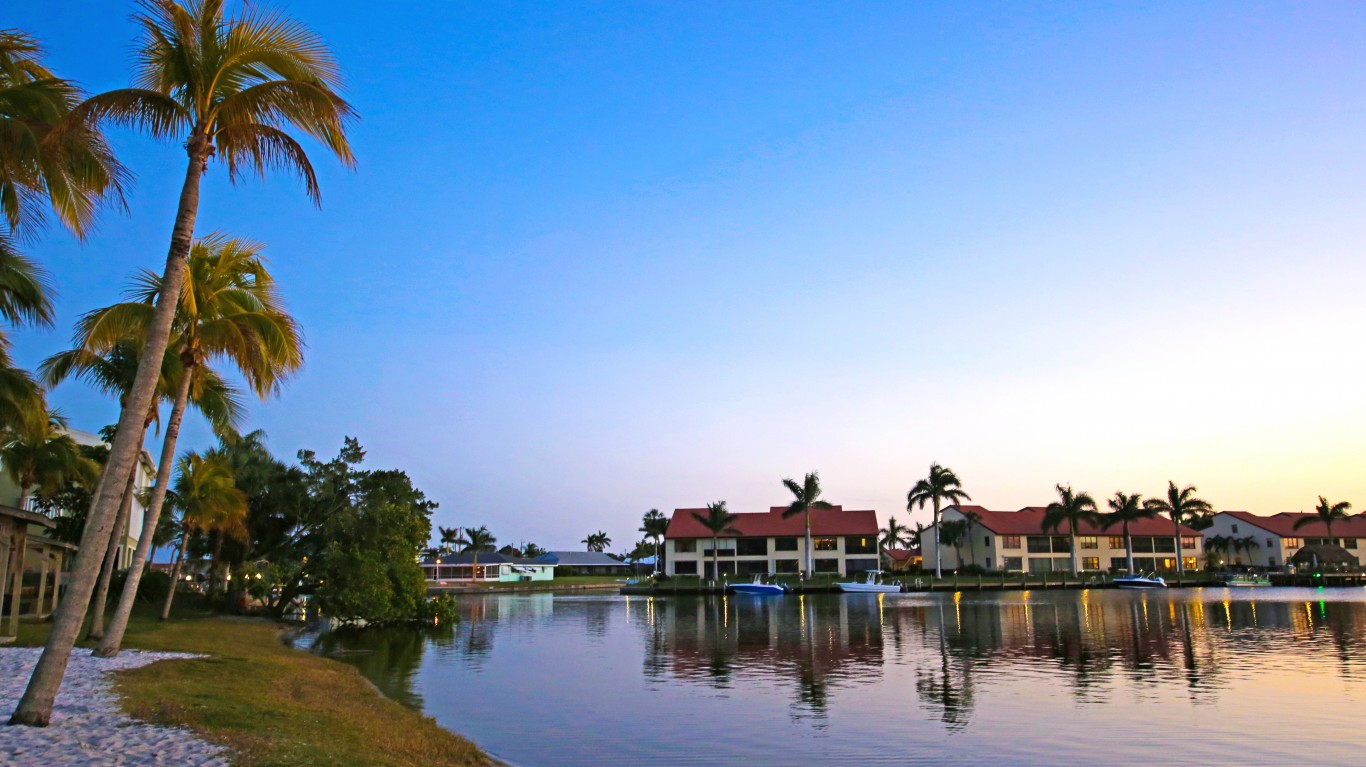
6. Cape Coral, FL
> Single-family homes at storm surge risk: 330,465 (repair cost: $84.4 billion)
> Multi-family homes at storm surge risk: 13,726 (repair cost: $4.1 billion)
> Metro area population: 756,570
> Median home value: $235,300
> Homes built before 1980: 23.5%
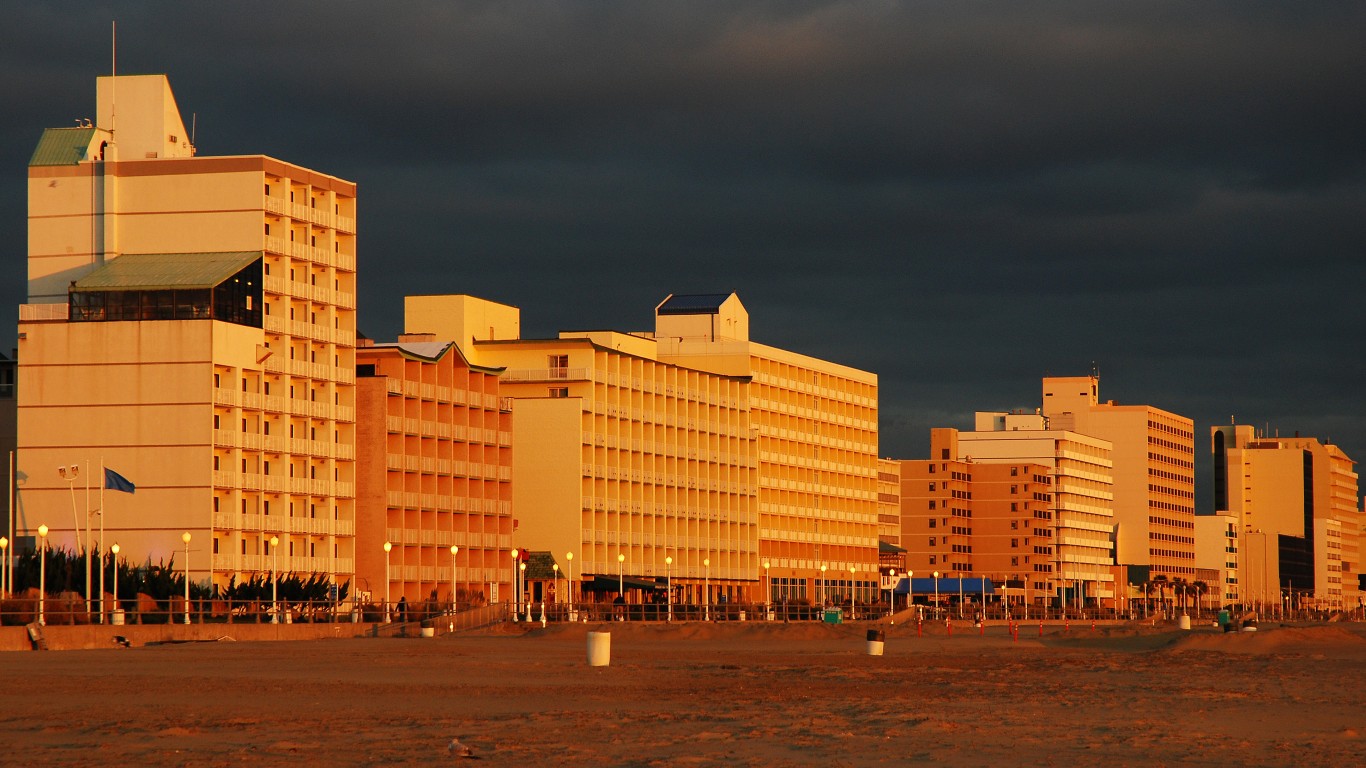
5. Virginia Beach, VA
> Single-family homes at storm surge risk: 397,947 (repair cost: $120.1 billion)
> Multi-family homes at storm surge risk: 4,286 (repair cost: $1.8 billion)
> Metro area population: 1,768,956
> Median home value: $253,800
> Homes built before 1980: 46.5%
[in-text-ad]

4. New Orleans, LA
> Single-family homes at storm surge risk: 405,369 (repair cost: $124.3 billion)
> Multi-family homes at storm surge risk: 6,626 (repair cost: $4.4 billion)
> Metro area population: 1,271,651
> Median home value: $205,500
> Homes built before 1980: 60.5%
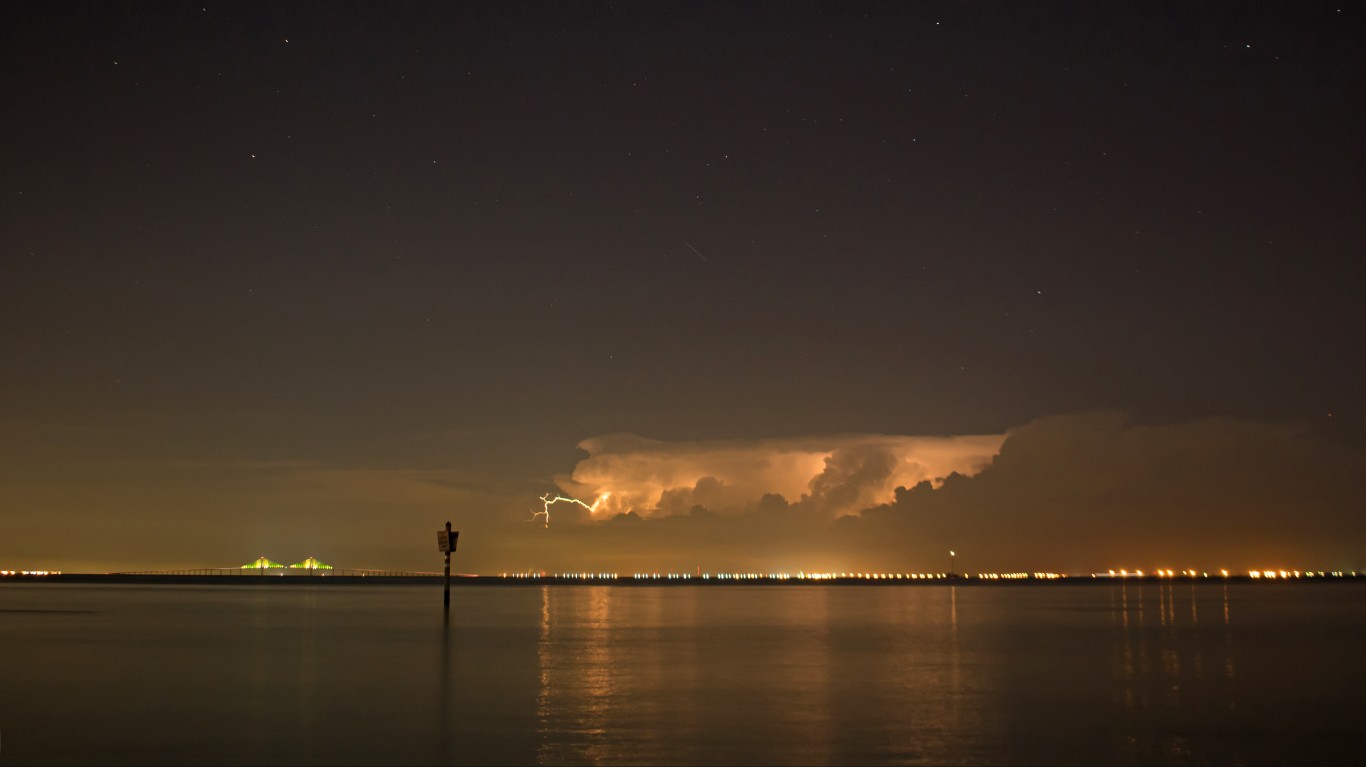
3. Tampa, FL
> Single-family homes at storm surge risk: 555,474 (repair cost: $125.9 billion)
> Multi-family homes at storm surge risk: 14,271 (repair cost: $4.9 billion)
> Metro area population: 3,152,928
> Median home value: $210,900
> Homes built before 1980: 43.0%
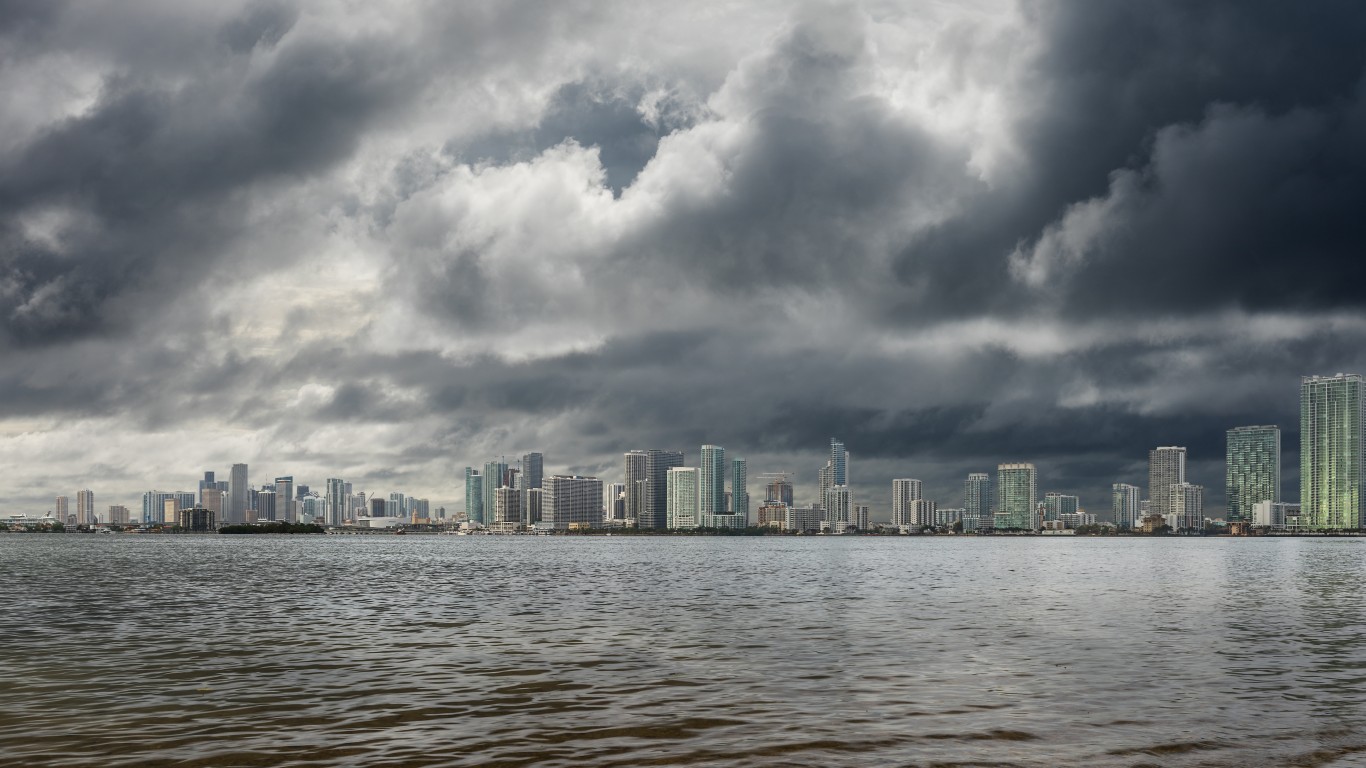
2. Miami, FL
> Single-family homes at storm surge risk: 740,744 (repair cost: $183.9 billion)
> Multi-family homes at storm surge risk: 28,645 (repair cost: $8.7 billion)
> Metro area population: 6,129,858
> Median home value: $298,400
> Homes built before 1980: 47.9%
[in-text-ad-2]

1. New York, NY
> Single-family homes at storm surge risk: 786,279 (repair cost: $369.9 billion)
> Multi-family homes at storm surge risk: 109,317 (repair cost: $62.8 billion)
> Metro area population: 19,261,570
> Median home value: $465,400
> Homes built before 1980: 76.0%
HURRICANE WINDS

15. Hartford, CT
> Single-family homes at Hurricane winds risk: 380,080 (repair cost: $143.4 billion)
> Multi-family homes at hurricane winds risk: 11,308 (repair cost: $9.2 billion)
> Metro area population: 1,205,842
> Median home value: $252,500
> Homes built before 1980: 0.7%
[in-text-ad]

14. North Port, FL
> Single-family homes at Hurricane winds risk: 386,689 (repair cost: $102.0 billion)
> Multi-family homes at hurricane winds risk: N/A
> Metro area population: 821,613
> Median home value: $261,100
> Homes built before 1980: 0.4%
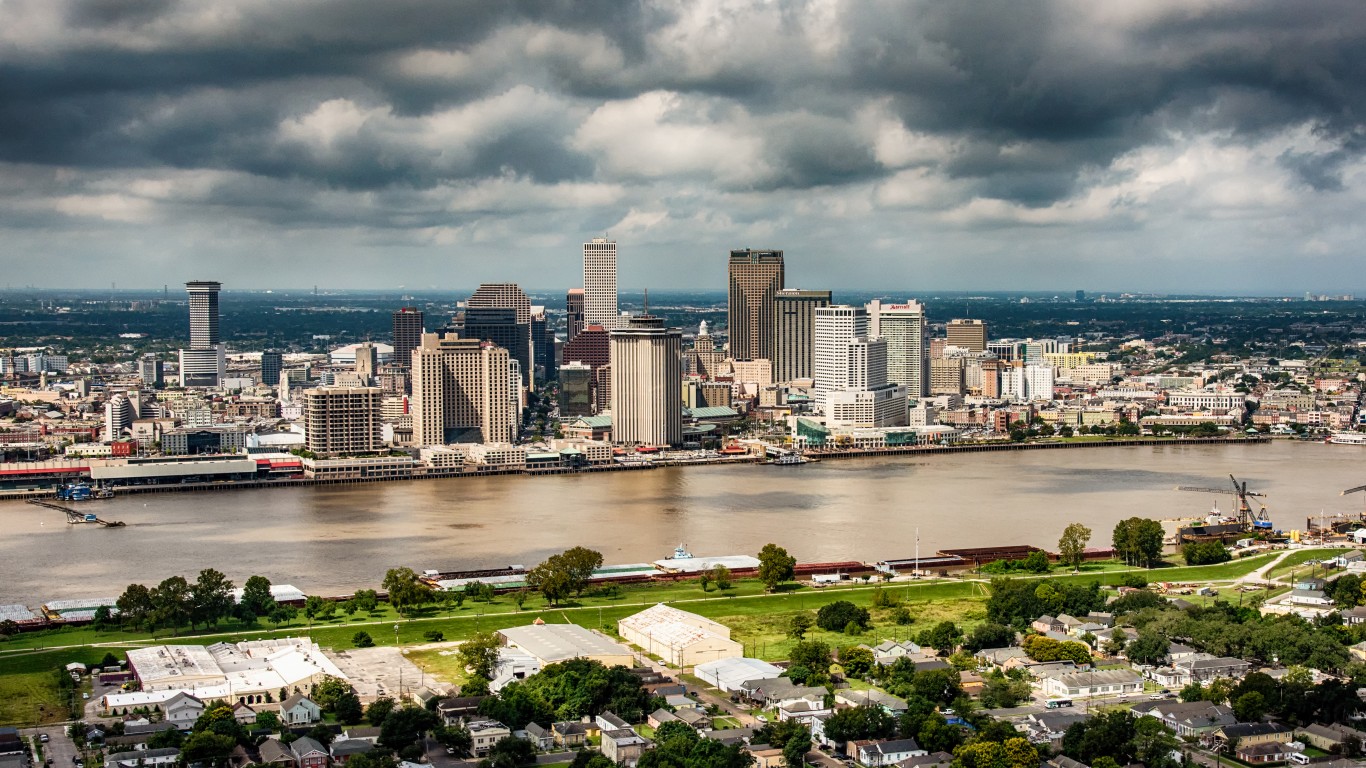
13. New Orleans, LA
> Single-family homes at Hurricane winds risk: 435,865 (repair cost: $133.9 billion)
> Multi-family homes at hurricane winds risk: N/A
> Metro area population: 1,271,651
> Median home value: $205,500
> Homes built before 1980: 0.6%

12. Richmond, VA
> Single-family homes at Hurricane winds risk: 452,639 (repair cost: $150.4 billion)
> Multi-family homes at hurricane winds risk: N/A
> Metro area population: 1,282,067
> Median home value: $247,500
> Homes built before 1980: 0.5%
[in-text-ad-2]

11. Providence, RI
> Single-family homes at Hurricane winds risk: 474,328 (repair cost: $176.0 billion)
> Multi-family homes at hurricane winds risk: 33,577 (repair cost: $24.6 billion)
> Metro area population: 1,621,099
> Median home value: $290,500
> Homes built before 1980: 0.7%
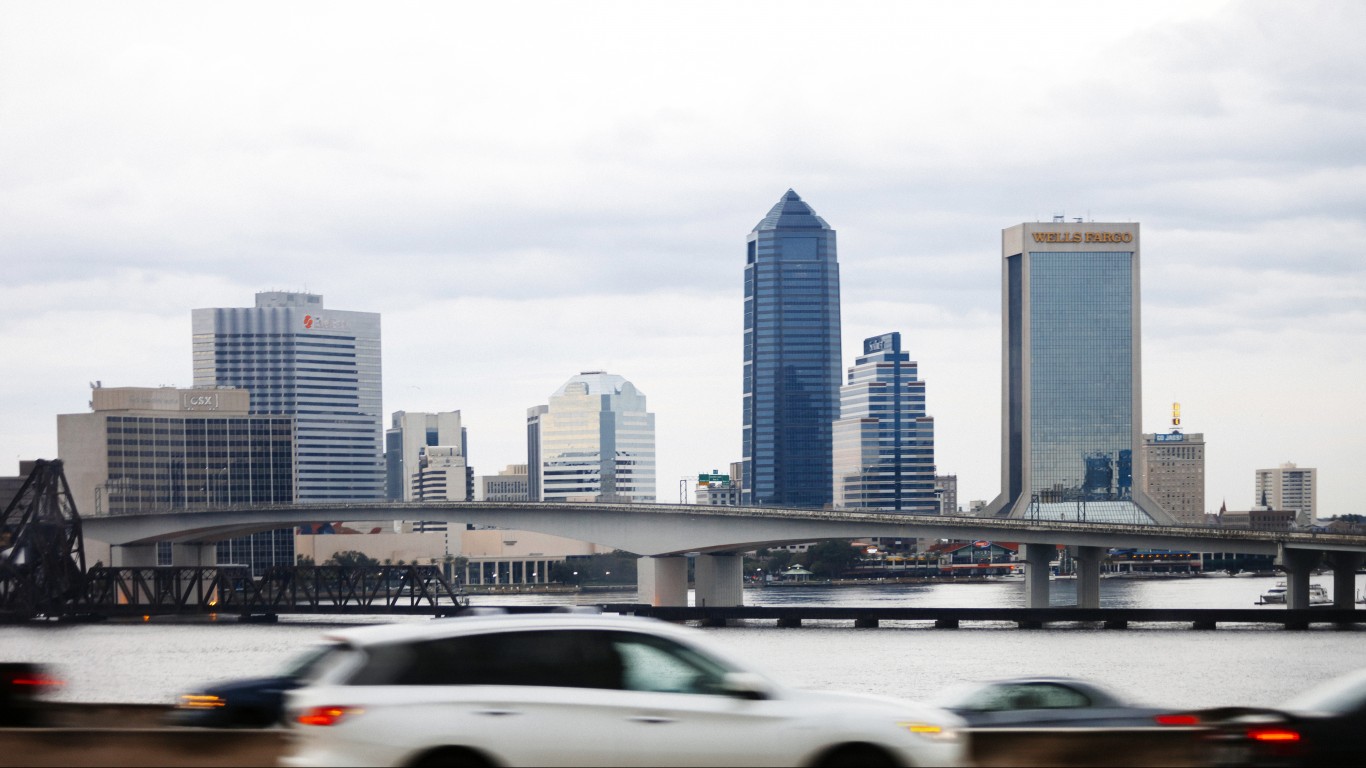
10. Jacksonville, FL
> Single-family homes at Hurricane winds risk: 566,825 (repair cost: $157.0 billion)
> Multi-family homes at hurricane winds risk: 8,602 (repair cost: $3.5 billion)
> Metro area population: 1,533,796
> Median home value: $220,000
> Homes built before 1980: 0.4%
[in-text-ad]
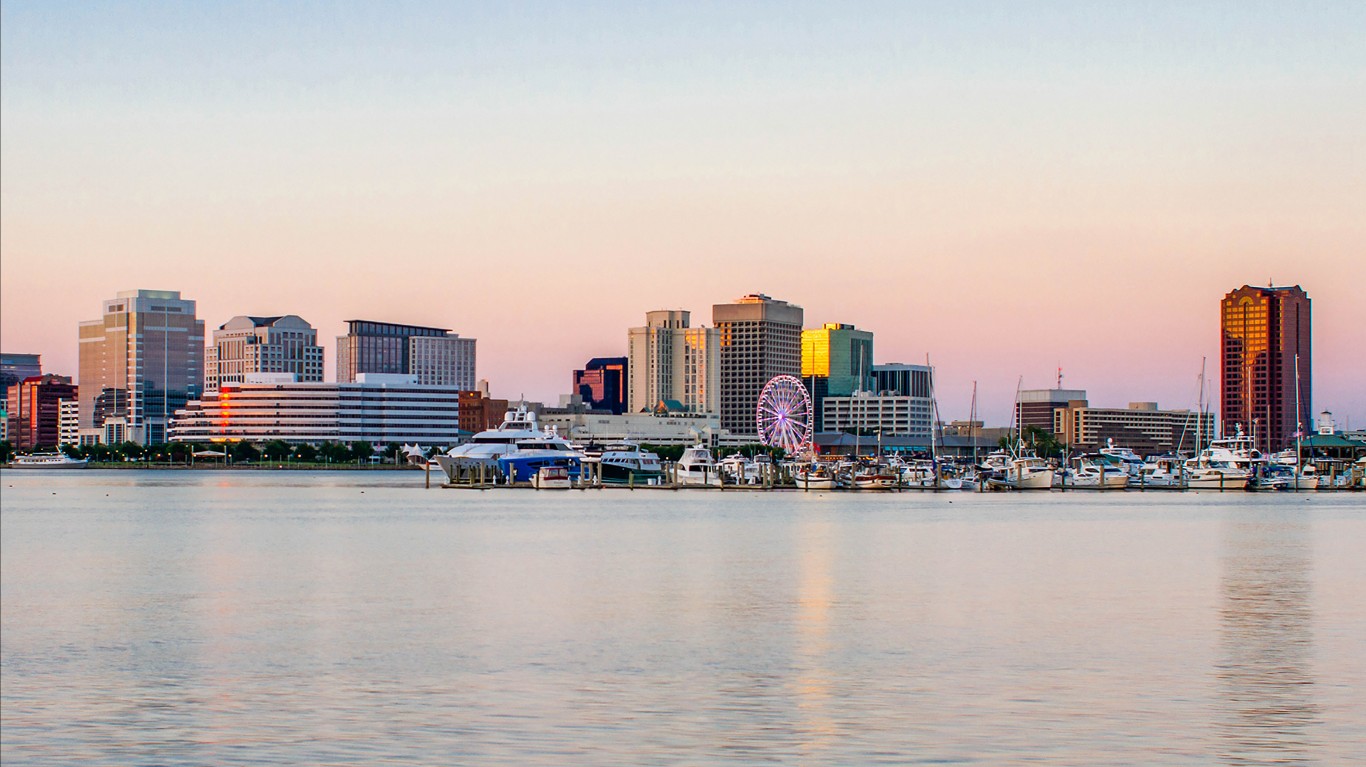
9. Virginia Beach, VA
> Single-family homes at Hurricane winds risk: 580,002 (repair cost: $177.5 billion)
> Multi-family homes at hurricane winds risk: N/A
> Metro area population: 1,768,956
> Median home value: $253,800
> Homes built before 1980: 0.5%

8. Baltimore, MD
> Single-family homes at Hurricane winds risk: 910,522 (repair cost: $283.0 billion)
> Multi-family homes at hurricane winds risk: 12,340 (repair cost: $4.1 billion)
> Metro area population: 2,800,427
> Median home value: $307,200
> Homes built before 1980: 0.6%
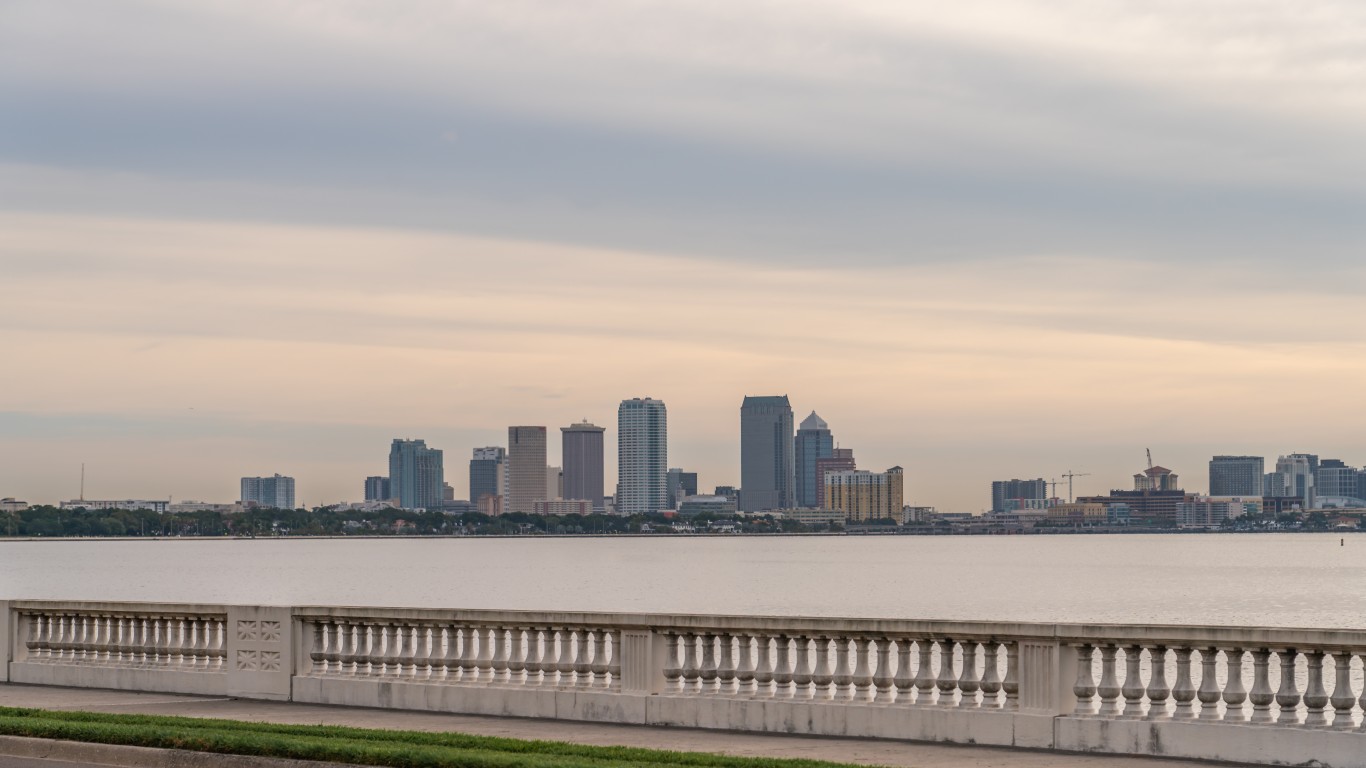
7. Tampa, FL
> Single-family homes at Hurricane winds risk: 1,116,079 (repair cost: $275.5 billion)
> Multi-family homes at hurricane winds risk: 26,324 (repair cost: $8.7 billion)
> Metro area population: 3,152,928
> Median home value: $210,900
> Homes built before 1980: 0.4%
[in-text-ad-2]

6. Boston, MA
> Single-family homes at Hurricane winds risk: 1,303,433 (repair cost: $555.5 billion)
> Multi-family homes at hurricane winds risk: 82,249 (repair cost: $55.7 billion)
> Metro area population: 4,854,808
> Median home value: $461,500
> Homes built before 1980: 0.7%

5. Washington
> Single-family homes at Hurricane winds risk: 1,753,336 (repair cost: $628.5 billion)
> Multi-family homes at hurricane winds risk: 100,532 (repair cost: $24.8 billion)
> Metro area population: 6,250,309
> Median home value: $436,600
> Homes built before 1980: 0.5%
[in-text-ad]

4. Philadelphia, PA
> Single-family homes at Hurricane winds risk: 1,924,785 (repair cost: $762.9 billion)
> Multi-family homes at hurricane winds risk: 59,237 (repair cost: $34.3 billion)
> Metro area population: 6,092,403
> Median home value: $259,500
> Homes built before 1980: 0.7%

3. Miami, FL
> Single-family homes at Hurricane winds risk: 2,009,913 (repair cost: $501.1 billion)
> Multi-family homes at hurricane winds risk: 61,467 (repair cost: $20.1 billion)
> Metro area population: 6,129,858
> Median home value: $298,400
> Homes built before 1980: 0.5%
2. Houston, TX
> Single-family homes at Hurricane winds risk: 2,032,661 (repair cost: $619.8 billion)
> Multi-family homes at hurricane winds risk: 18,092 (repair cost: $6.2 billion)
> Metro area population: 6,979,613
> Median home value: $208,100
> Homes built before 1980: 0.4%
[in-text-ad-2]

1. New York, NY
> Single-family homes at Hurricane winds risk: 3,814,468 (repair cost: $1.9 trillion)
> Multi-family homes at hurricane winds risk: 459,184 (repair cost: $261.8 billion)
> Metro area population: 19,261,570
> Median home value: $465,400
> Homes built before 1980: 0.8%
Methodology:
To determine the cities where hurricanes could cause the most damage, 24/7 Wall St. reviewed data on hurricane risk in metropolitan areas along the Gulf and Atlantic coasts from housing data provider CoreLogic’s 2022 Hurricane Report. Metropolitan areas were ranked in two lists: one based on the number of single-family residential structures less than four stories at moderate or greater risk of damage from storm surge flooding in the 2022 hurricane season, and the second is ranked on single-family homes at risk from hurricane force winds.
Additional data, including the number of multi-family buildings at-risk and the estimated reconstruction cost value of the at-risk homes also came from CoreLogic and includes the cost of materials, equipment, and labor that would result from reconstruction of these homes after 100% destruction. Data on population, age of structures, and median home value for each metro area came from the U.S. Census Bureau’s 2020 American Community Survey and are five-year estimates.
Credit Card Companies Are Doing Something Nuts
Credit card companies are at war. The biggest issuers are handing out free rewards and benefits to win the best customers.
It’s possible to find cards paying unlimited 1.5%, 2%, and even more today. That’s free money for qualified borrowers, and the type of thing that would be crazy to pass up. Those rewards can add up to thousands of dollars every year in free money, and include other benefits as well.
We’ve assembled some of the best credit cards for users today. Don’t miss these offers because they won’t be this good forever.
Flywheel Publishing has partnered with CardRatings for our coverage of credit card products. Flywheel Publishing and CardRatings may receive a commission from card issuers.
Thank you for reading! Have some feedback for us?
Contact the 24/7 Wall St. editorial team.
 24/7 Wall St.
 24/7 Wall St.
 24/7 Wall St.