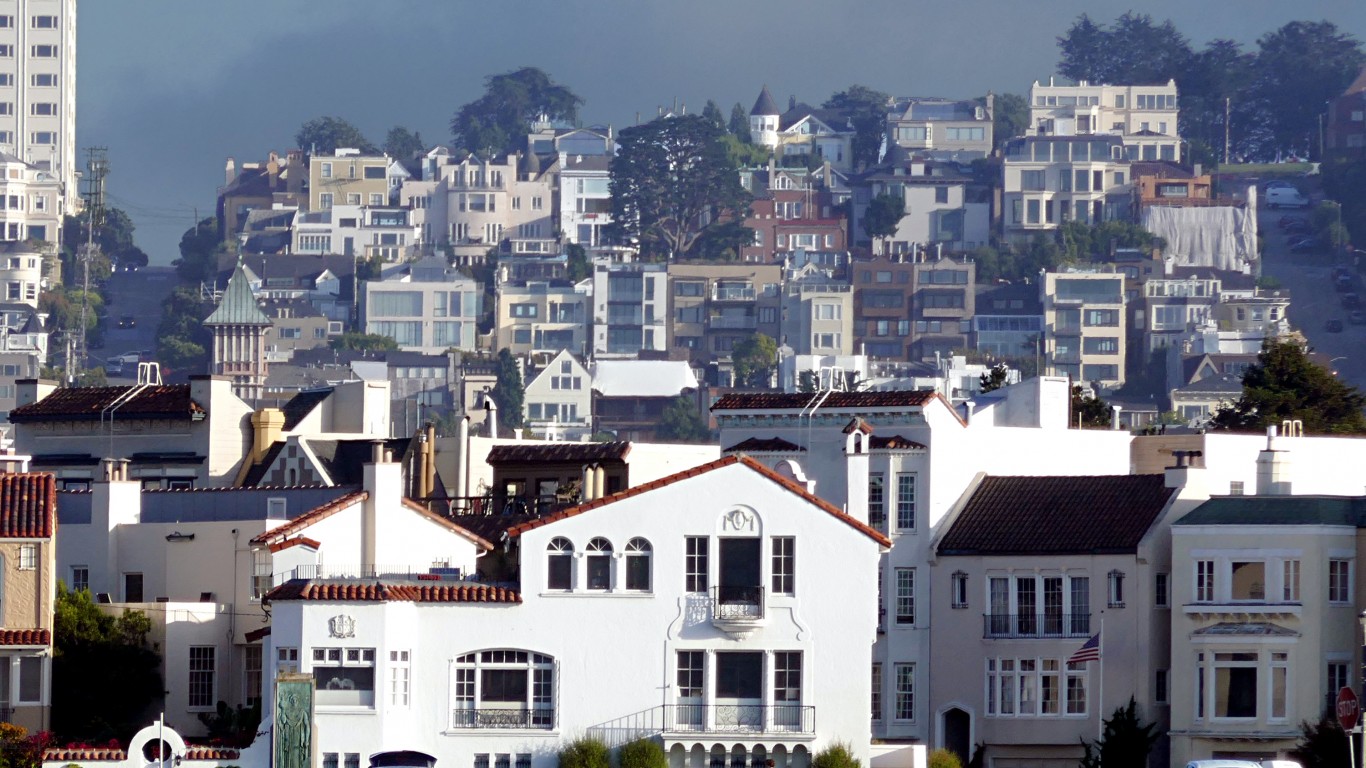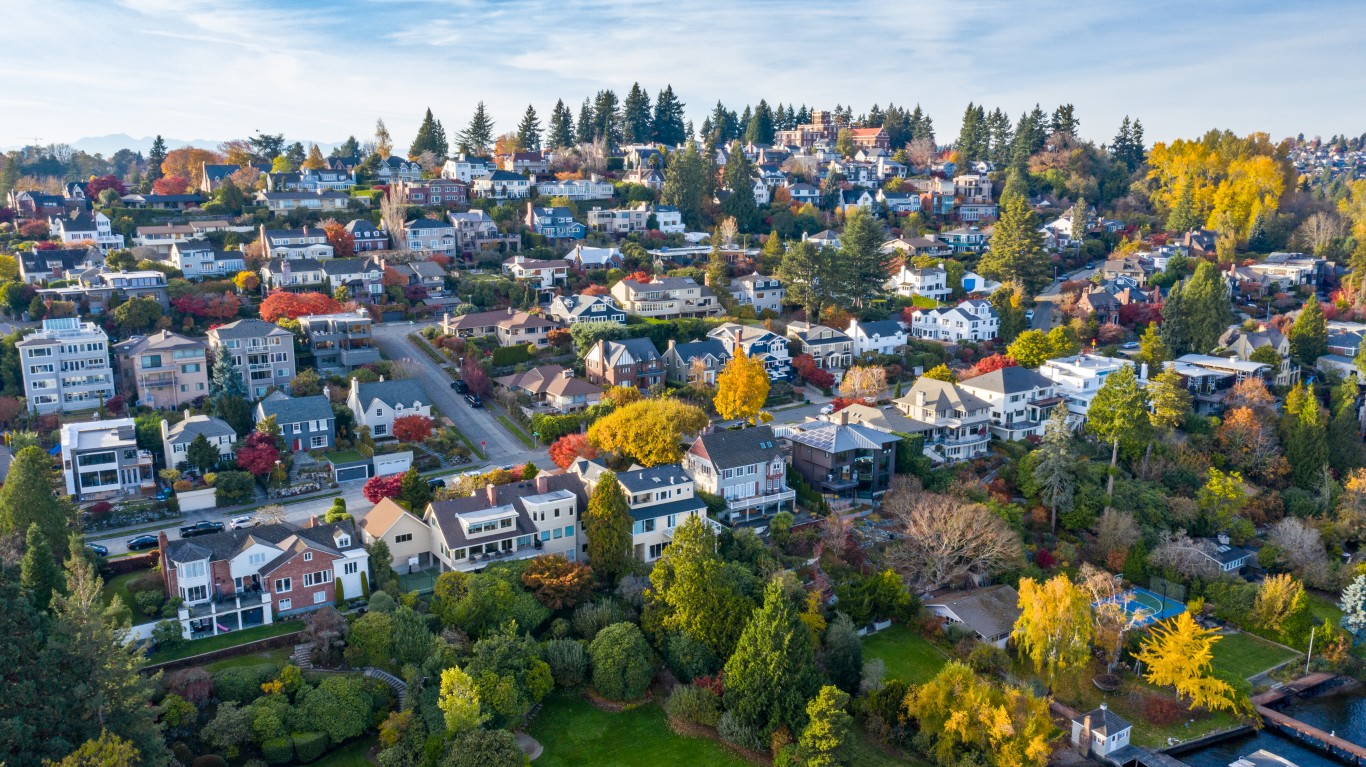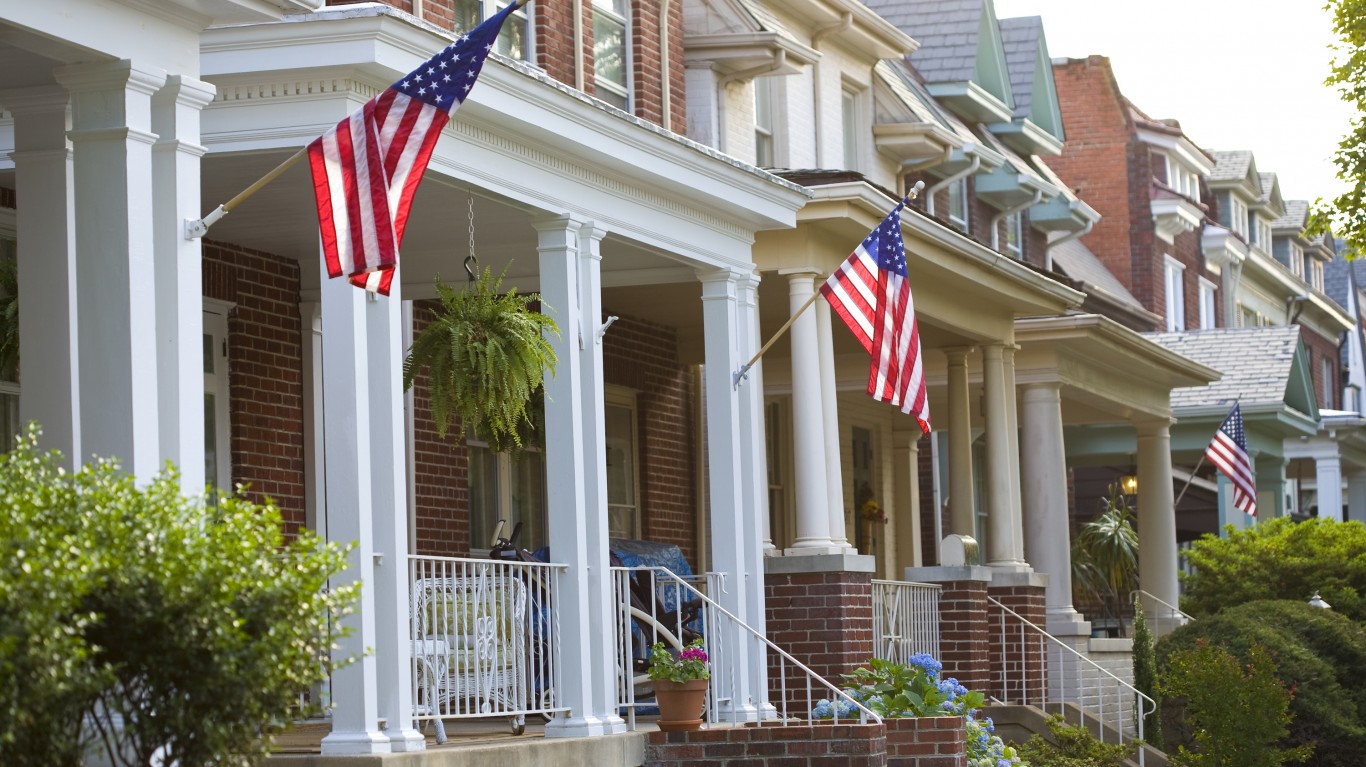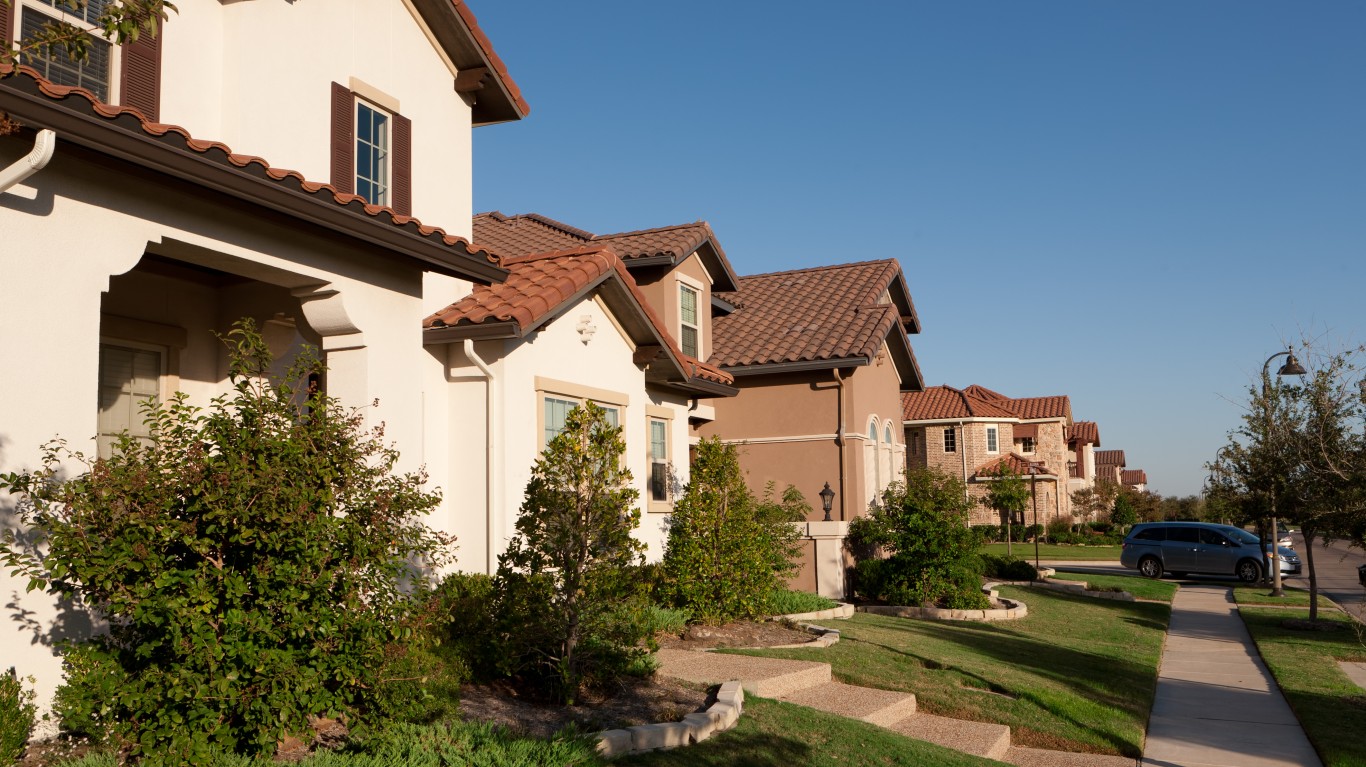
The real estate market in the U.S. over the last three years has been unprecedented, and there may not be another like it ever again. In late 2019, a prosperous economy and low unemployment rate contributed to a strong housing market. Already in 2020, markets nationwide had many $1 million homes, and many have joined their ranks since. In San Jose, California, the American city with the most $1 million homes, nearly 53% of homes are valued at least that much.
The housing market was first brutally undercut when the COVID-19 pandemic hit. GDP dropped sharply from April 2020 until nearly the end of the year. Unemployment in April 2020 reached a post World War II high. Then, as the economy has recovered home prices have soared again.
The market recently hit the point where home prices have jumped 20% many months compared to the same month the year before. The carefully followed S&P Case-Shiller report showed that, in April, home prices nationwide moved up by 20.4% compared to the same price a year ago. Craig J. Lazzara, managing director at S&P DJI, commented: “We continue to observe very broad strength in the housing market, as all 20 cities notched double-digit price increases for the 12 months ended in April.” In one of the cities — Tampa — prices rose 35.8%.
There are several specific reasons home prices have risen so fast. The first is that mortgage rates for 30-year fixed loans dropped below 3%, which made housing for many Americans more affordable. (Those days are over. Mortgage rates are now closer to 6%.)
Many Americans have also become more mobile, as the COVID-19 pandemic facilitated work-from-home culture. People who were able to work from home were also able to move to places that they thought had better quality of life and better home values. Certainly, thousands of people from expensive coastal cities like New York and San Francisco moved to less expensive cities inland. (Not just housing prices are surging, rents are soaring too. These are the 25 cities where rent is skyrocketing.)
The price surge across the nation took median home prices above $400,000 for the first time. The number of homes worth $1 million or more also rose. (These are the 15 cities with the most overpriced housing markets.)
LendingTree recently released a report titled “Million-Dollar Markets: These Metros Have the Largest Share of Homes Valued at $1 Million-Plus.” LendingTree examined U.S. Census Bureau’s data from the 2020 American Community Survey to find the percentage of homes worth over $1 million in the 50 largest U.S. cities. Across these markets, only 4.71% of homes carried a $1 million price tag in the five years ending in 2020.
The four markets with the highest percentage of $1 million homes are among California’s largest and most prosperous cities. San Jose, home of Silicon Valley, tops the list with 52.89% of owner-occupied homes worth above $1 million. It is followed by San Francisco at 43.37%, Los Angeles at 18.55%, and San Diego at 13.52%.
Click here for the 25 markets with the most $1 million homes
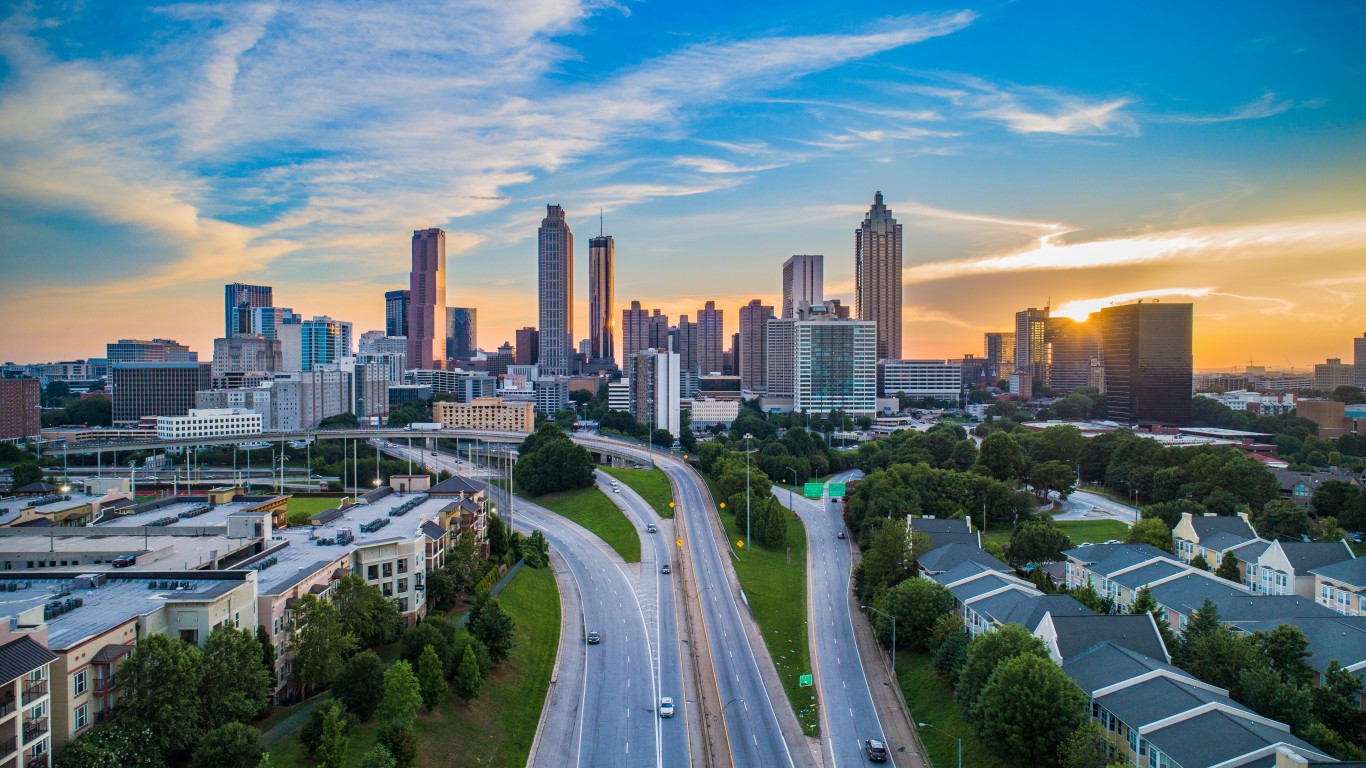
25. Atlanta, GA
> Owner occupied units: 1,382,025
> Percentage of $1 million homes 1.89%
> Median home value: $233,700
[in-text-ad]

24. Las Vegas, NV
> Owner occupied units: 443,247
> Percentage of $1 million homes 1.94%
> Median home value: $285,100
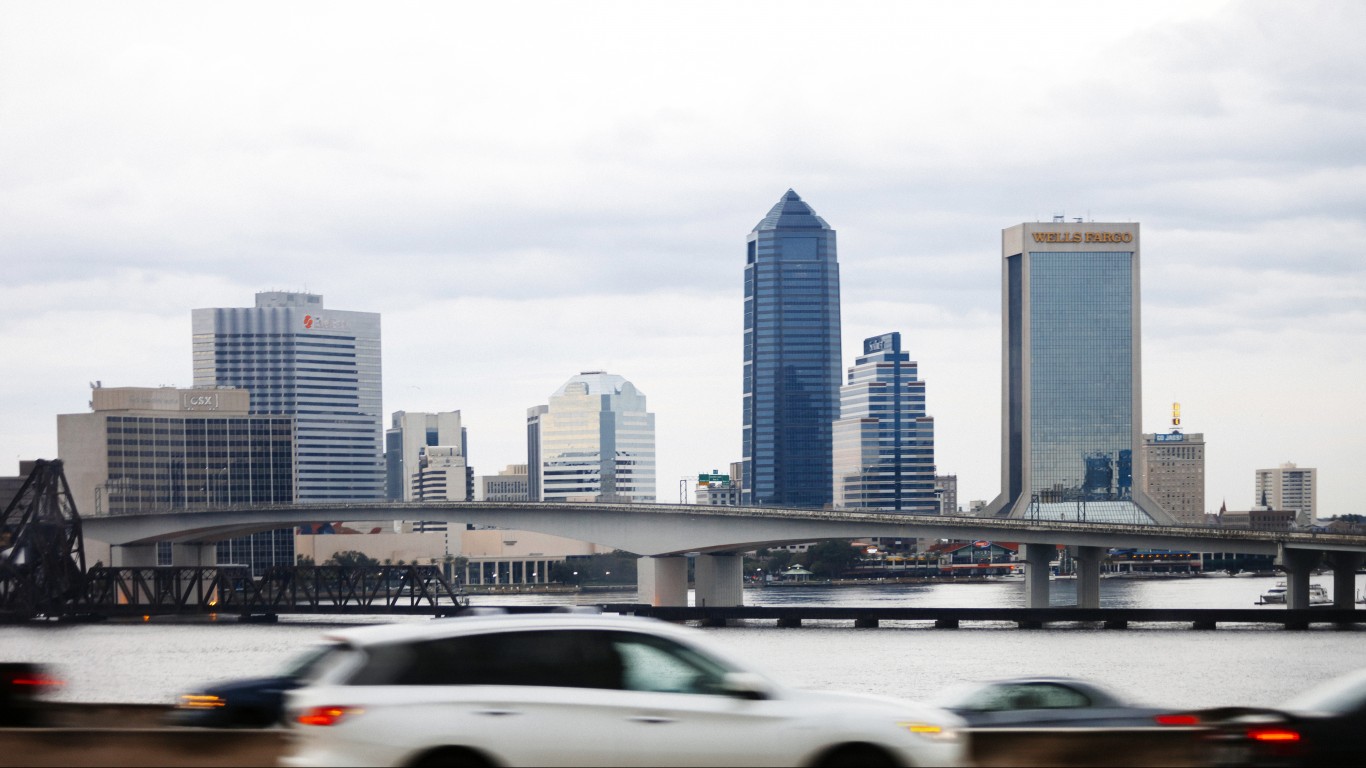
23. Jacksonville, FL
> Owner occupied units: 377,697
> Percentage of $1 million homes 2.05%
> Median home value: $220,000
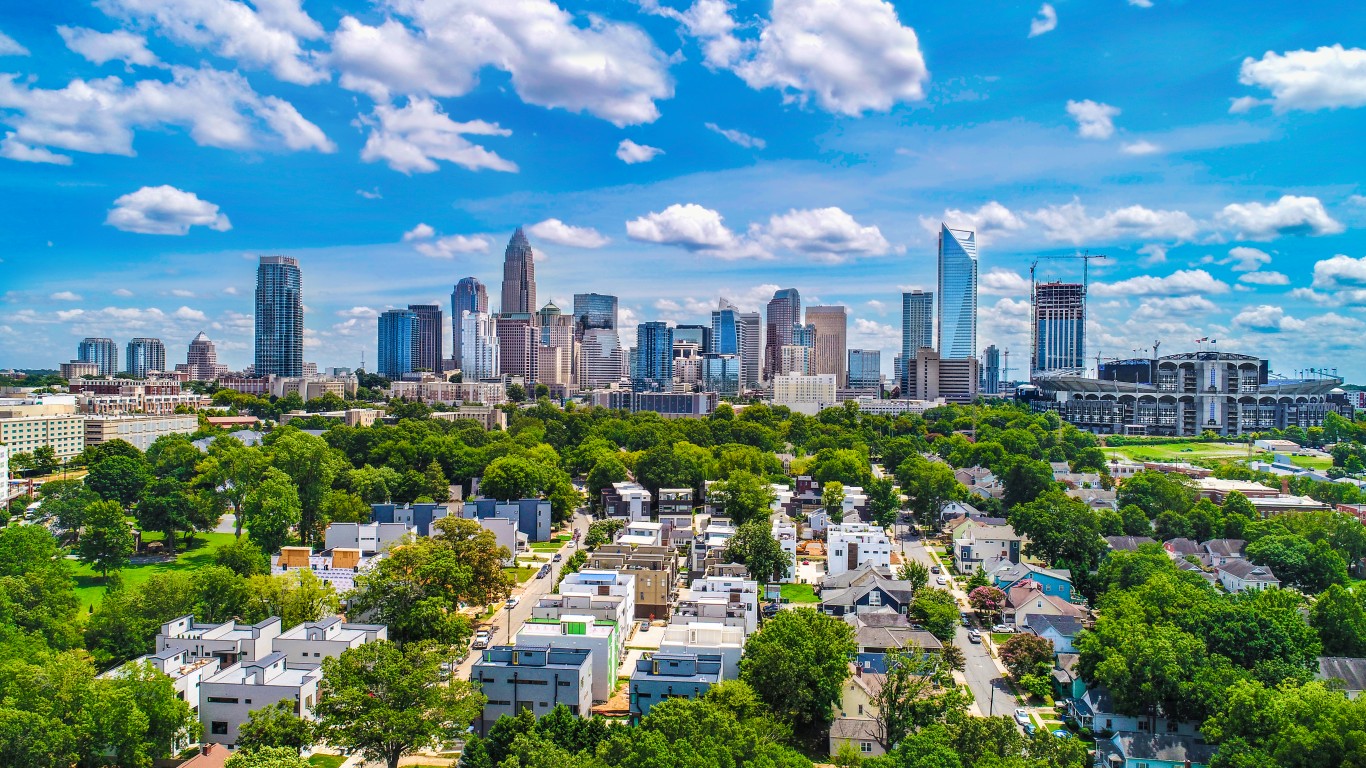
22. Charlotte, NC
> Owner occupied units: 644,100
> Percentage of $1 million homes 2.07%
> Median home value: $216,700
[in-text-ad-2]
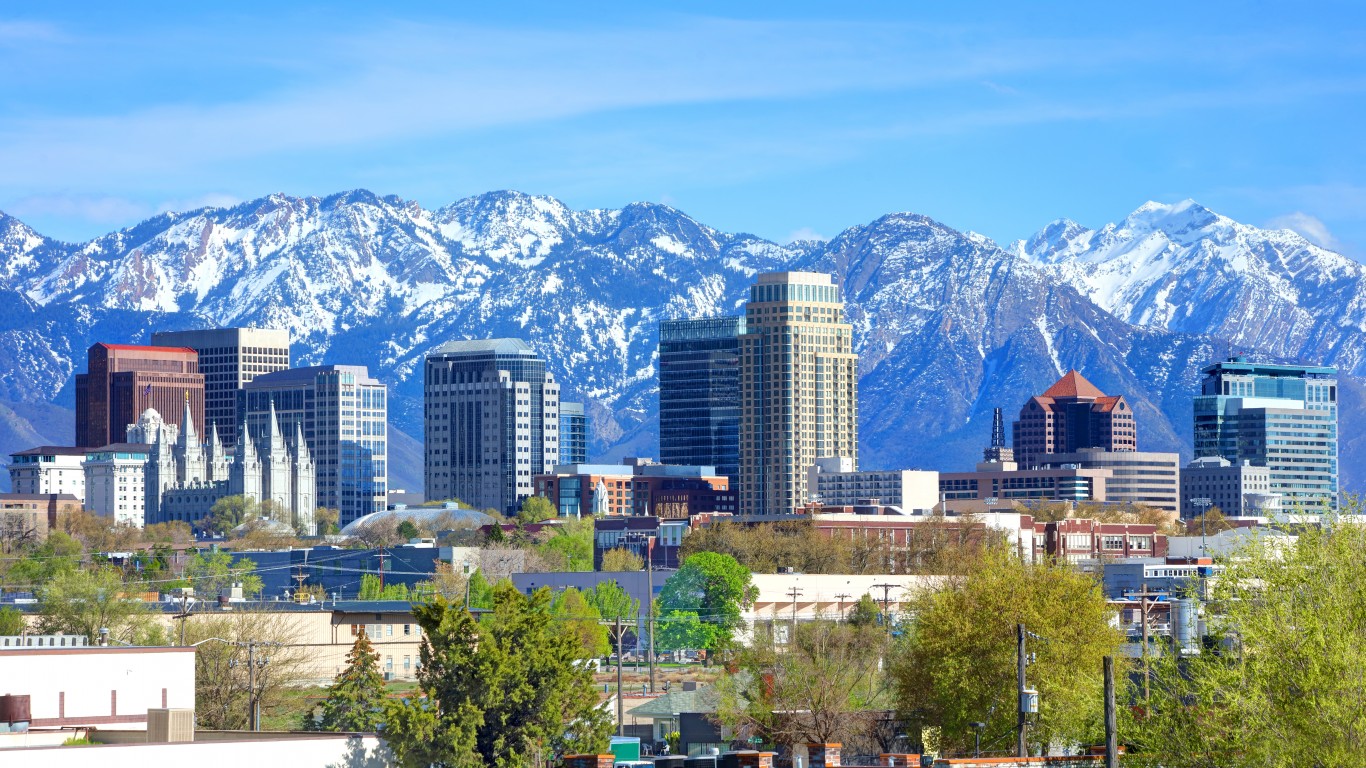
21. Salt Lake City, UT
> Owner occupied units: 275,979
> Percentage of $1 million homes 2.09%
> Median home value: $329,200
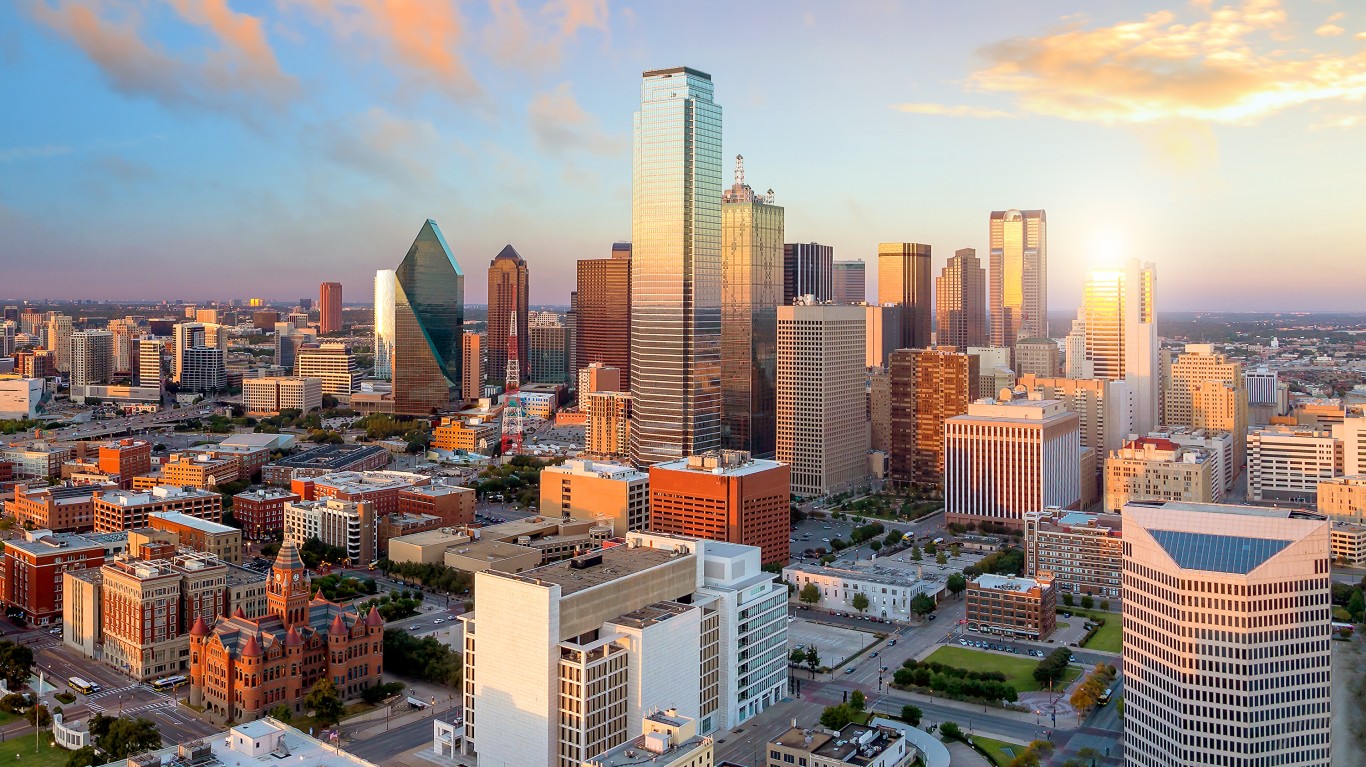
20. Dallas, TX
> Owner occupied units: 1,561,136
> Percentage of $1 million homes 2.20%
> Median home value: $236,200
[in-text-ad]
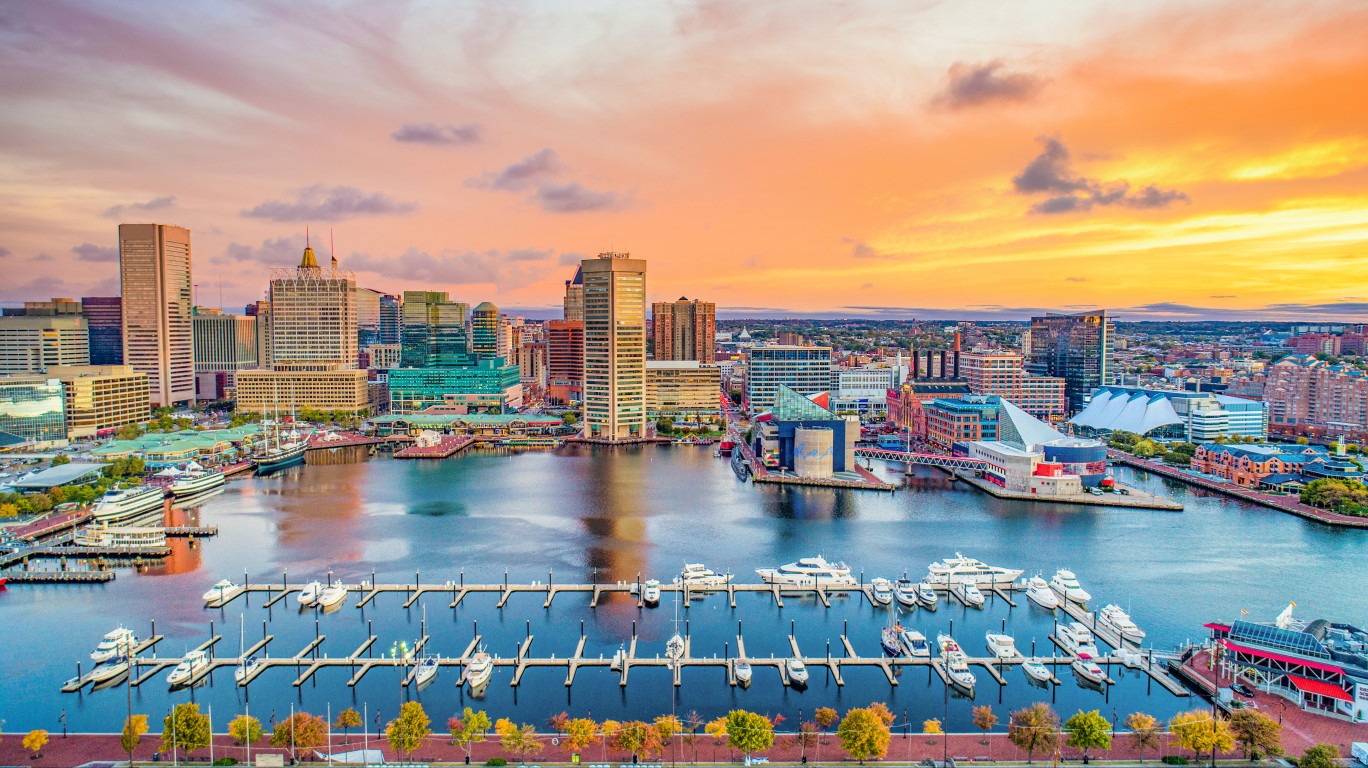
19. Baltimore, MD
> Owner occupied units: 707,862
> Percentage of $1 million homes 2.21% (tie)
> Median home value: $307,200

18. Riverside, CA
> Owner occupied units: 882,033
> Percentage of $1 million homes 2.21% (tie)
> Median home value: $360,100
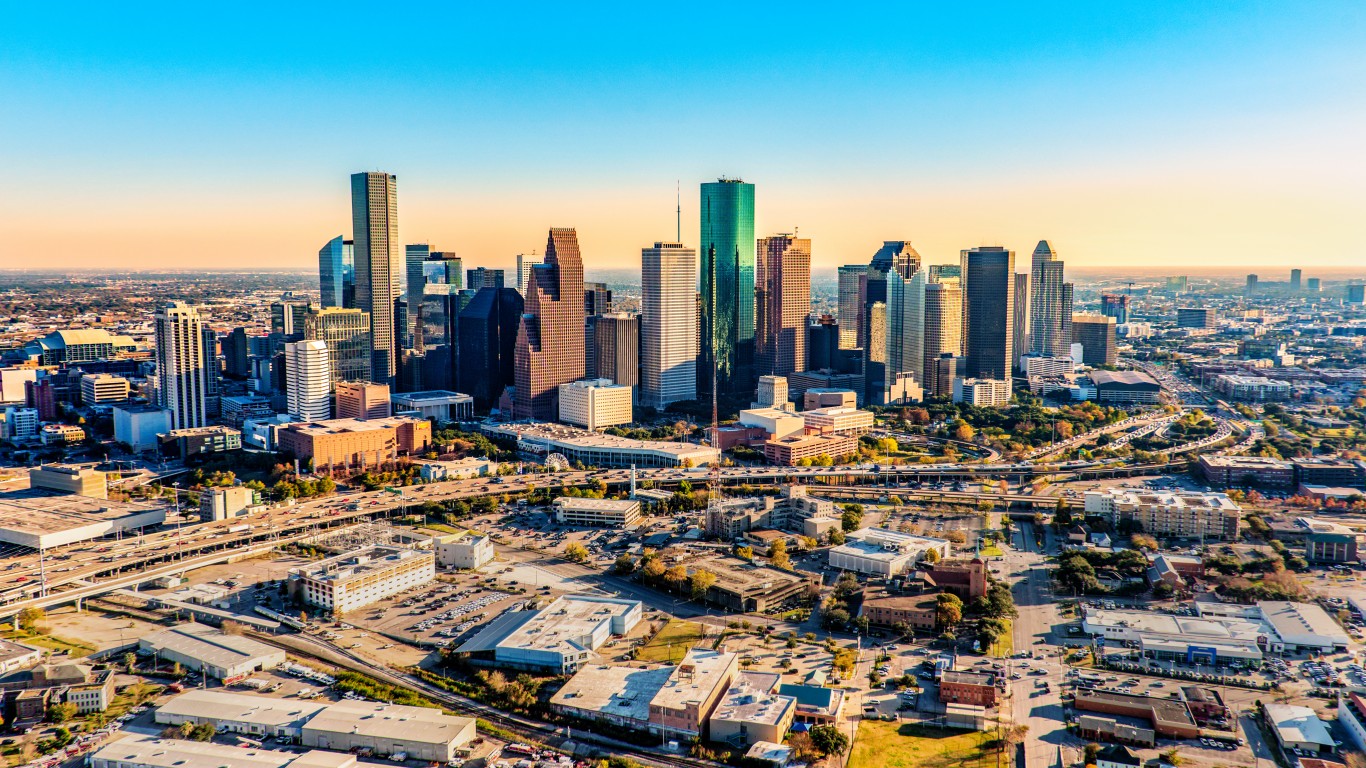
17. Houston, TX
> Owner occupied units: 1,466,613
> Percentage of $1 million homes 2.40%
> Median home value: $208,100
[in-text-ad-2]

16. Chicago, IL
> Owner occupied units: 2,299,451
> Percentage of $1 million homes 2.45%
> Median home value: $247,400

15. Nashville, TN
> Owner occupied units: 477,503
> Percentage of $1 million homes 2.46%
> Median home value: $262,900
[in-text-ad]
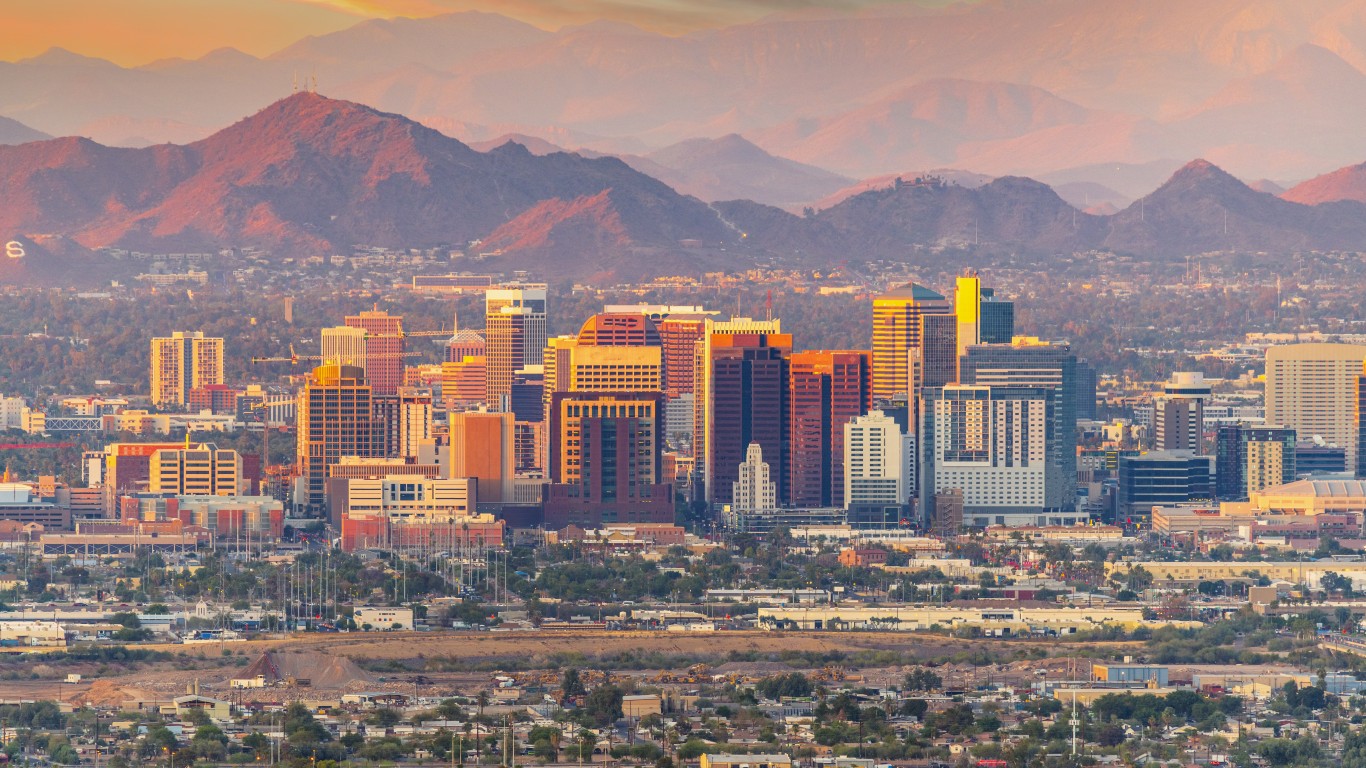
14. Phoenix, AZ
> Owner occupied units: 1,123,410
> Percentage of $1 million homes 2.53%
> Median home value: $269,300
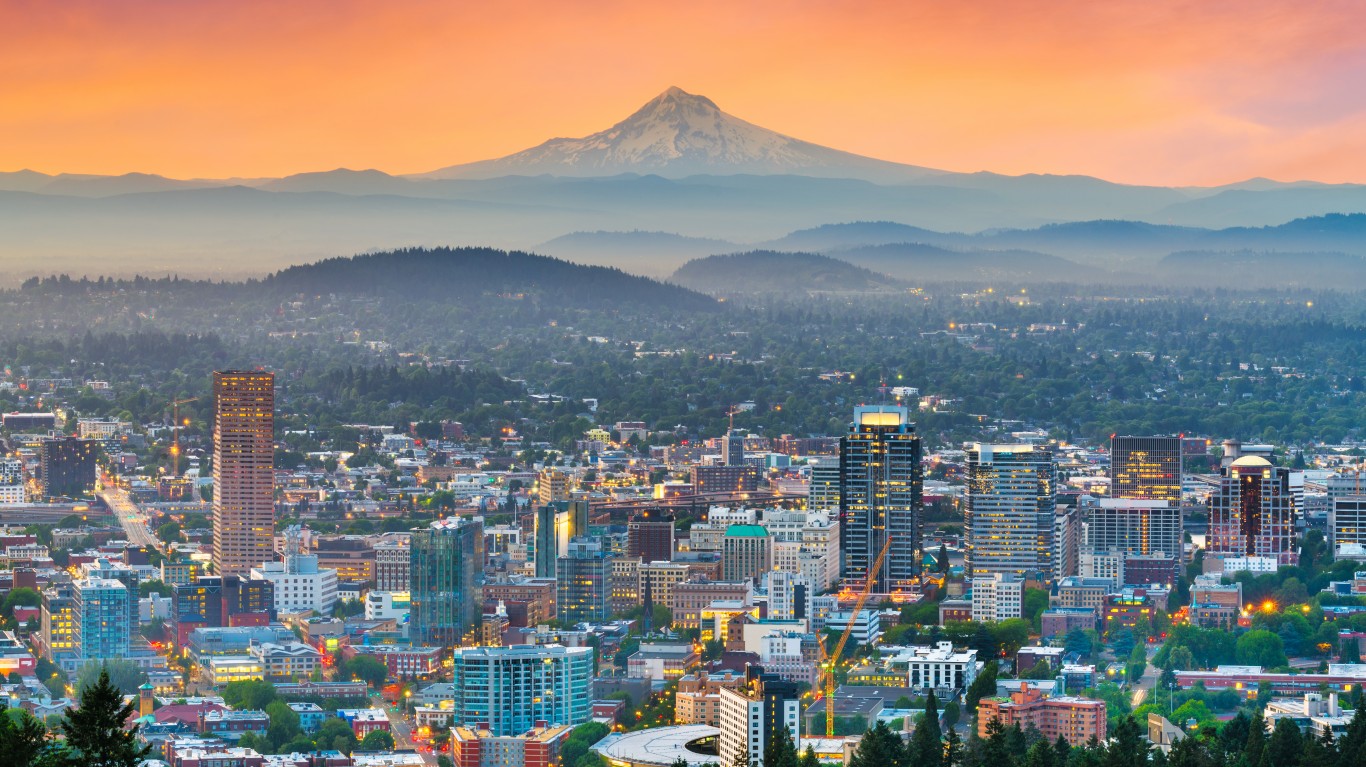
13. Portland, OR
> Owner occupied units: 596,748
> Percentage of $1 million homes 3.00%
> Median home value: $392,000

12. Austin, TX
> Owner occupied units: 466,441
> Percentage of $1 million homes 3.51%
> Median home value: $303,300
[in-text-ad-2]

11. Sacramento, CA
> Owner occupied units: 514,601
> Percentage of $1 million homes 3.60%
> Median home value: $412,400

10. Denver, CO
> Owner occupied units: 711,209
> Percentage of $1 million homes 4.02%
> Median home value: $411,800
[in-text-ad]
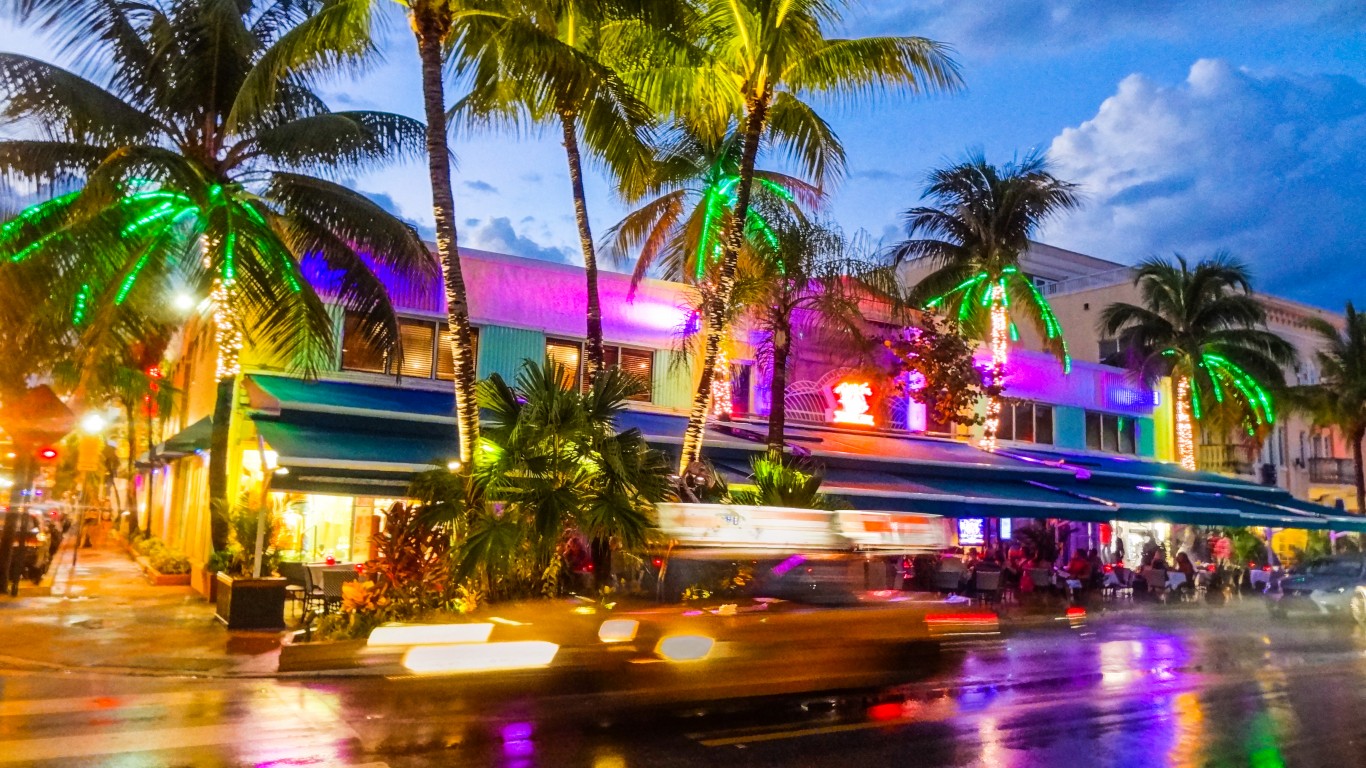
9. Miami, FL
> Owner occupied units: 1,299,739
> Percentage of $1 million homes 4.65%
> Median home value: $298,400

8. Washington, DC
> Owner occupied units: 1,434,386
> Percentage of $1 million homes 7.14%
> Median home value: $436,600
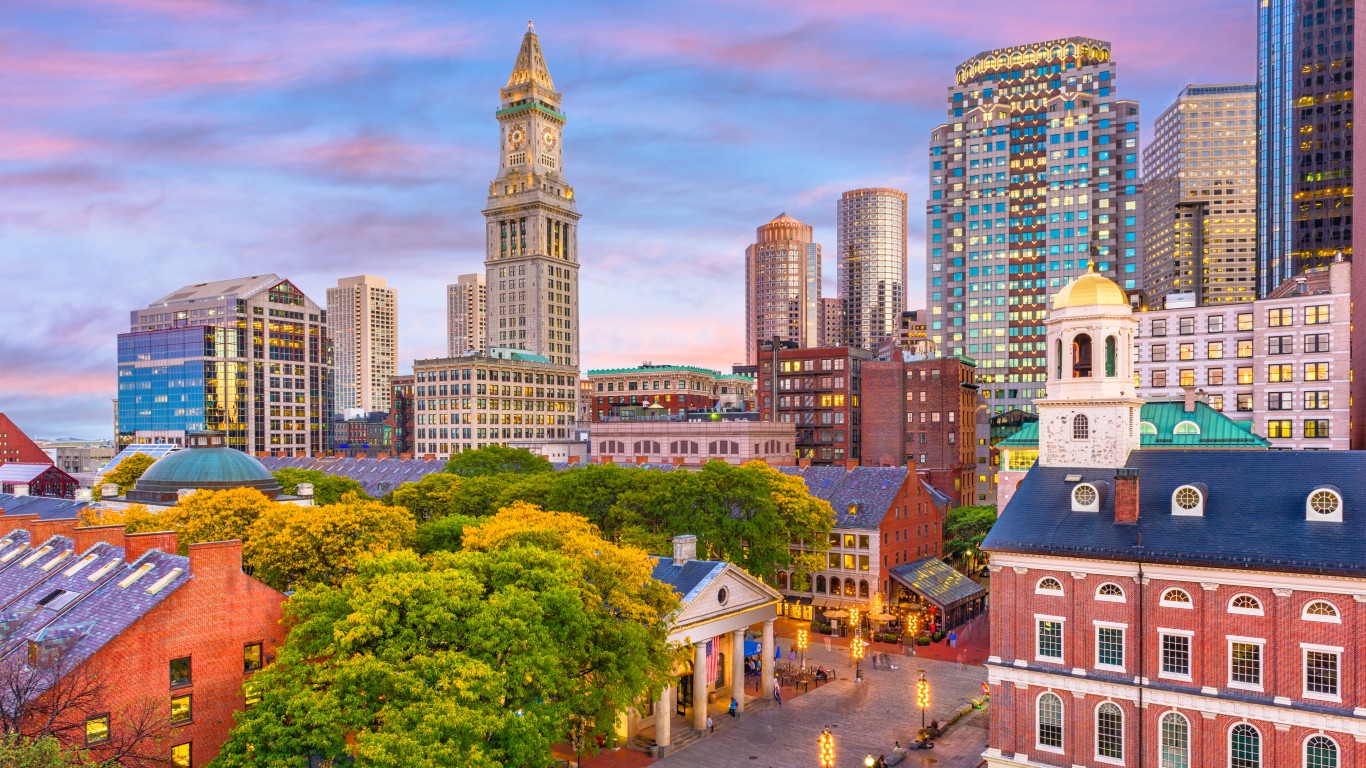
7. Boston, MA
> Owner occupied units: 1,143,559
> Percentage of $1 million homes 8.35%
> Median home value: $461,500
[in-text-ad-2]

6. Seattle, WA
> Owner occupied units: 921,152
> Percentage of $1 million homes 10.10%
> Median home value: $471,900

5. New York, NY
> Owner occupied units: 3,643,816
> Percentage of $1 million homes 10.53%
> Median home value: $465,400
[in-text-ad]

4. San Diego, CA
> Owner occupied units: 609,350
> Percentage of $1 million homes 13.52%
> Median home value: $595,600

3. Los Angeles, CA
> Owner occupied units: 2,129,700
> Percentage of $1 million homes 18.55%
> Median home value: $641,300
2. San Francisco, CA
> Owner occupied units: 935,620
> Percentage of $1 million homes 40.37%
> Median home value: $888,500
[in-text-ad-2]
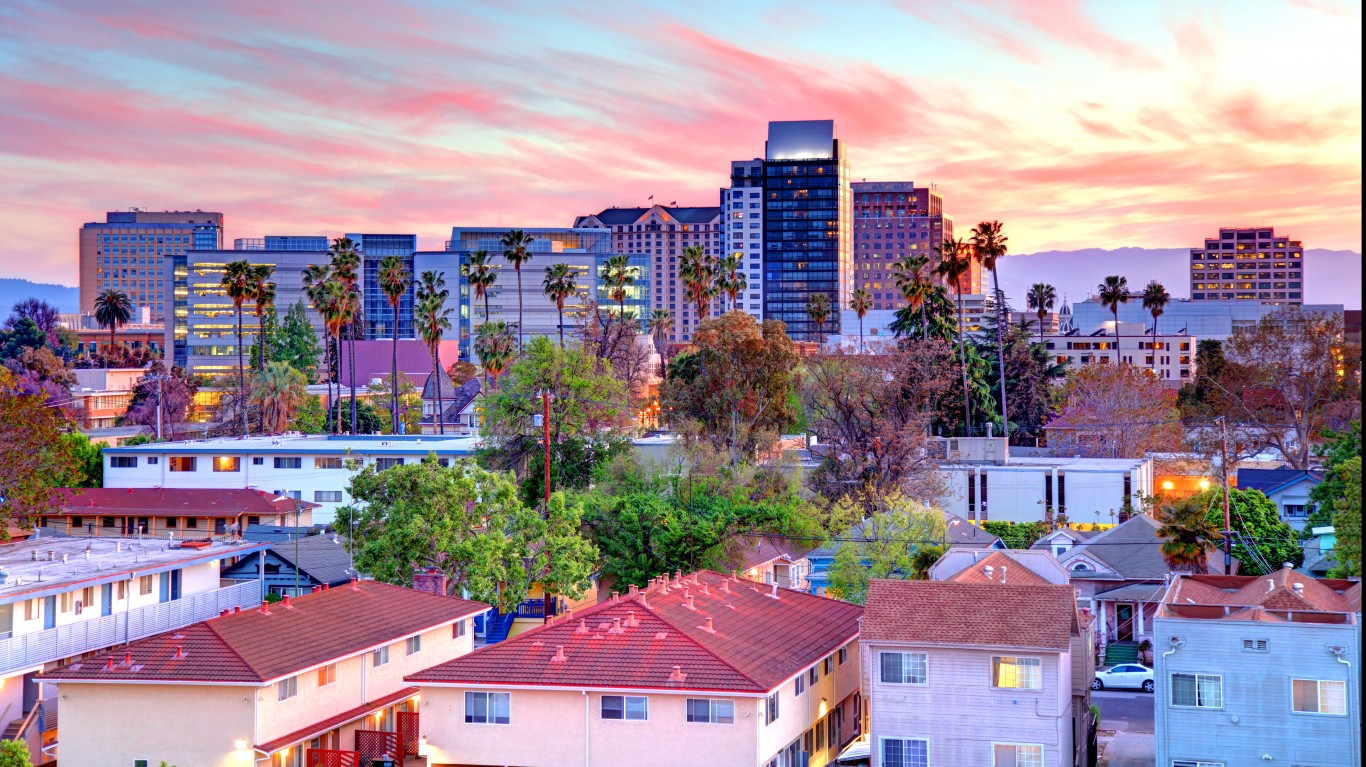
1. San Jose, CA
> Owner occupied units: 370,241
> Percentage of $1 million homes 52.89%
> Median home value: $1,041,800
Get Ready To Retire (Sponsored)
Start by taking a quick retirement quiz from SmartAsset that will match you with up to 3 financial advisors that serve your area and beyond in 5 minutes, or less.
Each advisor has been vetted by SmartAsset and is held to a fiduciary standard to act in your best interests.
Here’s how it works:
1. Answer SmartAsset advisor match quiz
2. Review your pre-screened matches at your leisure. Check out the advisors’ profiles.
3. Speak with advisors at no cost to you. Have an introductory call on the phone or introduction in person and choose whom to work with in the future
Thank you for reading! Have some feedback for us?
Contact the 24/7 Wall St. editorial team.
 24/7 Wall St.
 24/7 Wall St.