It might not be surprising that Washington D.C., as the nation’s capital, consistently ranks as having one of the nation’s best park systems. Even setting aside the many federal green spaces devoted to national monuments, the District of Columbia provides one of the best access to parks and outdoors spaces, even for its most marginalized residents.
According to the Trust for Public Land, a 50-year-old nonprofit parks and protected-lands advocacy group, low-income households have an average of 42% less park space than residents in affluent areas. By contrast, 98% of all D.C. residents – including those in low-income neighborhoods – live within a 10-minute walk of a park. (These are the major U.S. cities with the best access to parks.)
The nation’s capital is one of nine U.S. cities that provide park access to virtually all of their residents. The historic cities of Boston and San Francisco both provide 100% of their residents with this close-to-home park access. San Francisco does it by investing the most in parks and rec facilities, an annual average of $420 per resident. Boston does the same with just $168, investing the least among the 20 U.S. cities that spend the most on park development and management. (Boston’s main public park, Boston Common, is also at the top of the list of the oldest city parks in America.)
This suggests that while devoting public funds to parks is an important factor, park access isn’t just a matter of hosw much a city spends. For example, Boise, Idaho, spends more on parks than Boston – an average of $190 per person per year – but ranks at the bottom of these 20 cities with just 65% of residents living within a 10-minute walk to the closest park.
Click here to see the U.S. cities investing the most in parks
Half of these 20 cities provide this access to at least 90% of their residents. Among these cities, Cincinnati ranks the lowest in median household income, and it spends an average of $183 per person per year on parks, providing 88% of its population nearby access to these green spaces.
To identify the U.S. cities investing the most in parks, 24/7 Wall St. looked at the Trust for Public Land’s ParkScore 2022 for city investment in parks and rec per resident per year and the percentage of the population living within a 10 minute walk of a park. The total population and the median household income come from the U.S. Census Bureau’s American Community Survey 2020 5-year estimates.
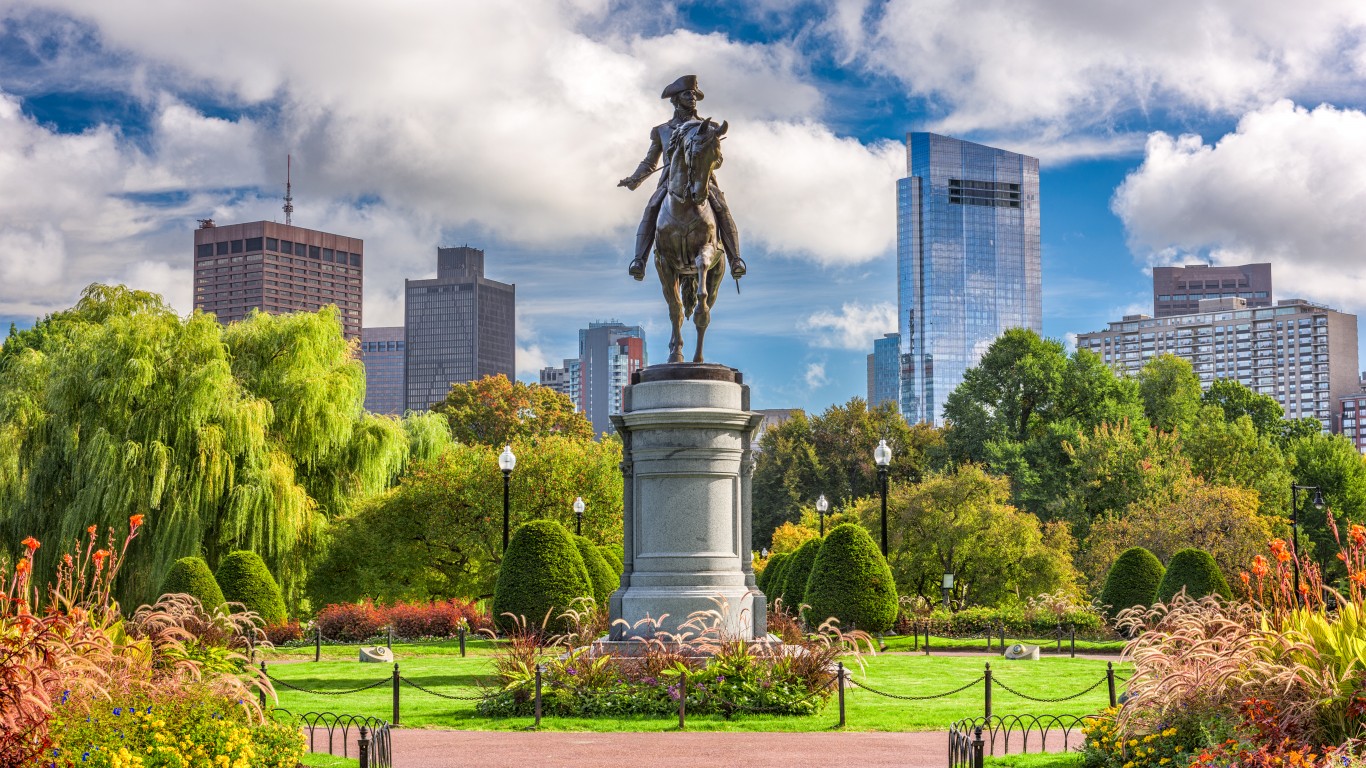
20. Boston, MA
> Average annual parks and rec investment: $168 per person
> Residents within a 10 min walk of a park : 100% – #1 highest out of 100 largest cities
> Median household income: $76,298 – #20 highest in nation
> Total population: 689,326 – #20 largest in nation
[in-text-ad]

19. Henderson, NV
> Average annual parks and rec investment: $170 per person
> Residents within a 10 min walk of a park : 73% – #50 highest out of 100 largest cities
> Median household income: $75,430 – #22 highest in nation
> Total population: 309,955 – #60 largest in nation
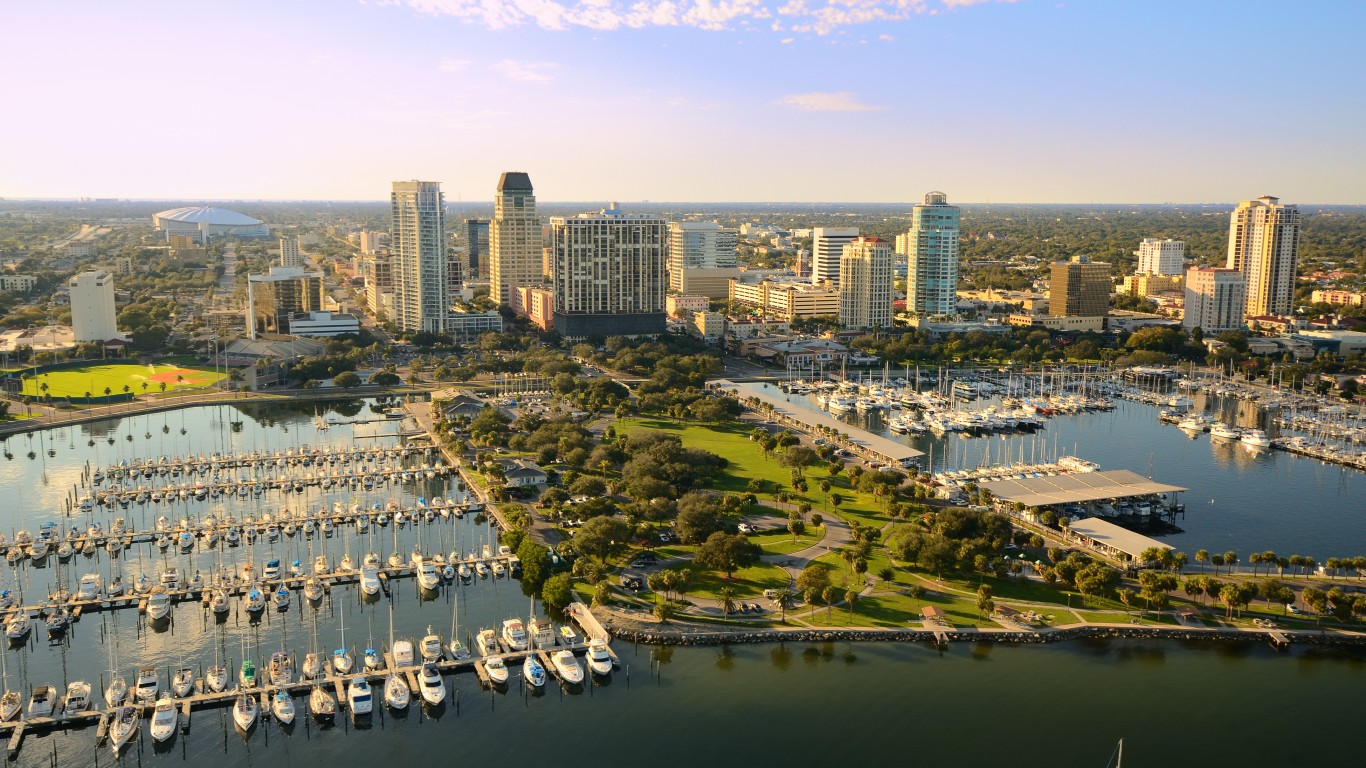
18. St. Petersburg, FL
> Average annual parks and rec investment: $175 per person
> Residents within a 10 min walk of a park : 77% – #39 highest out of 100 largest cities
> Median household income: $60,798 – #53 highest in nation
> Total population: 264,001 – #75 largest in nation
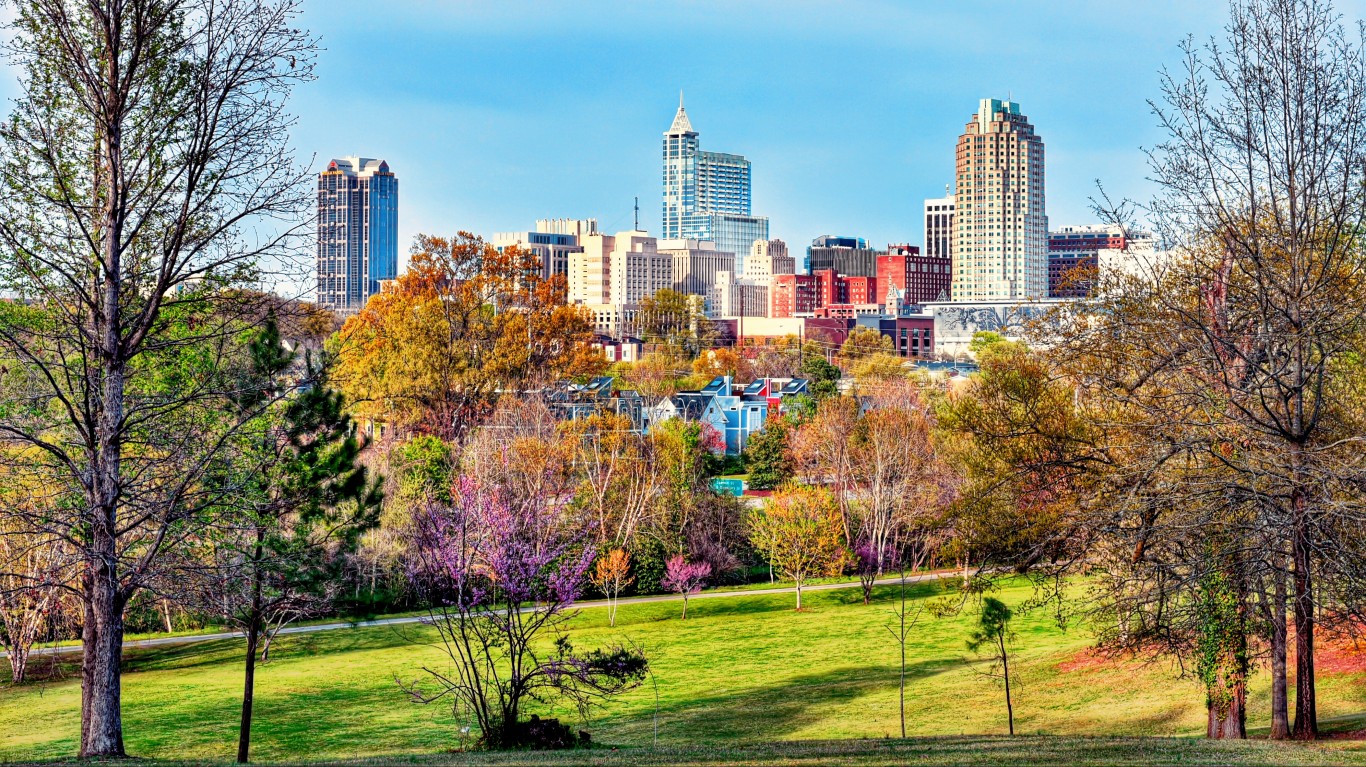
17. Raleigh, NC
> Average annual parks and rec investment: $176 per person
> Residents within a 10 min walk of a park : 48% – #88 highest out of 100 largest cities
> Median household income: $69,720 – #28 highest in nation
> Total population: 469,698 – #39 largest in nation
[in-text-ad-2]
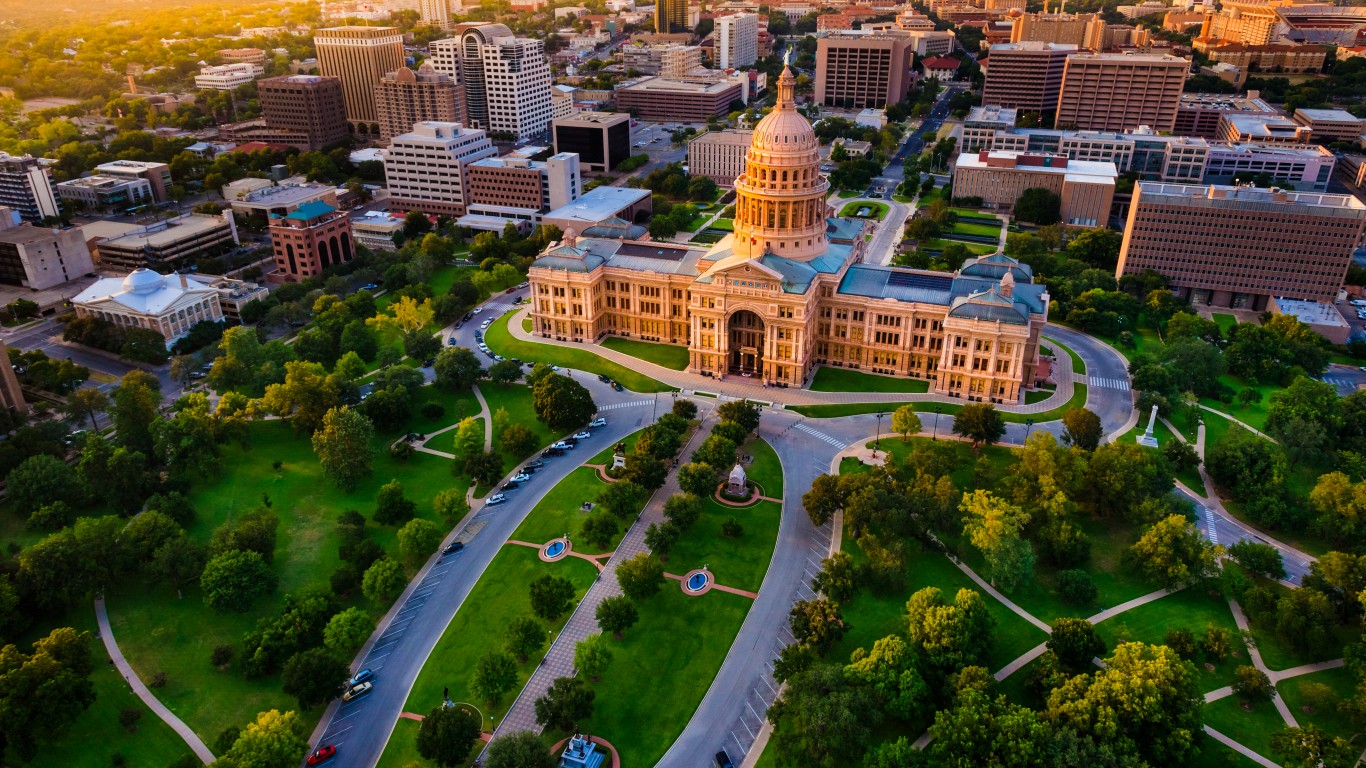
16. Austin, TX
> Average annual parks and rec investment: $178 per person
> Residents within a 10 min walk of a park : 70% – #56 highest out of 100 largest cities
> Median household income: $75,752 – #21 highest in nation
> Total population: 965,872 – #11 largest in nation
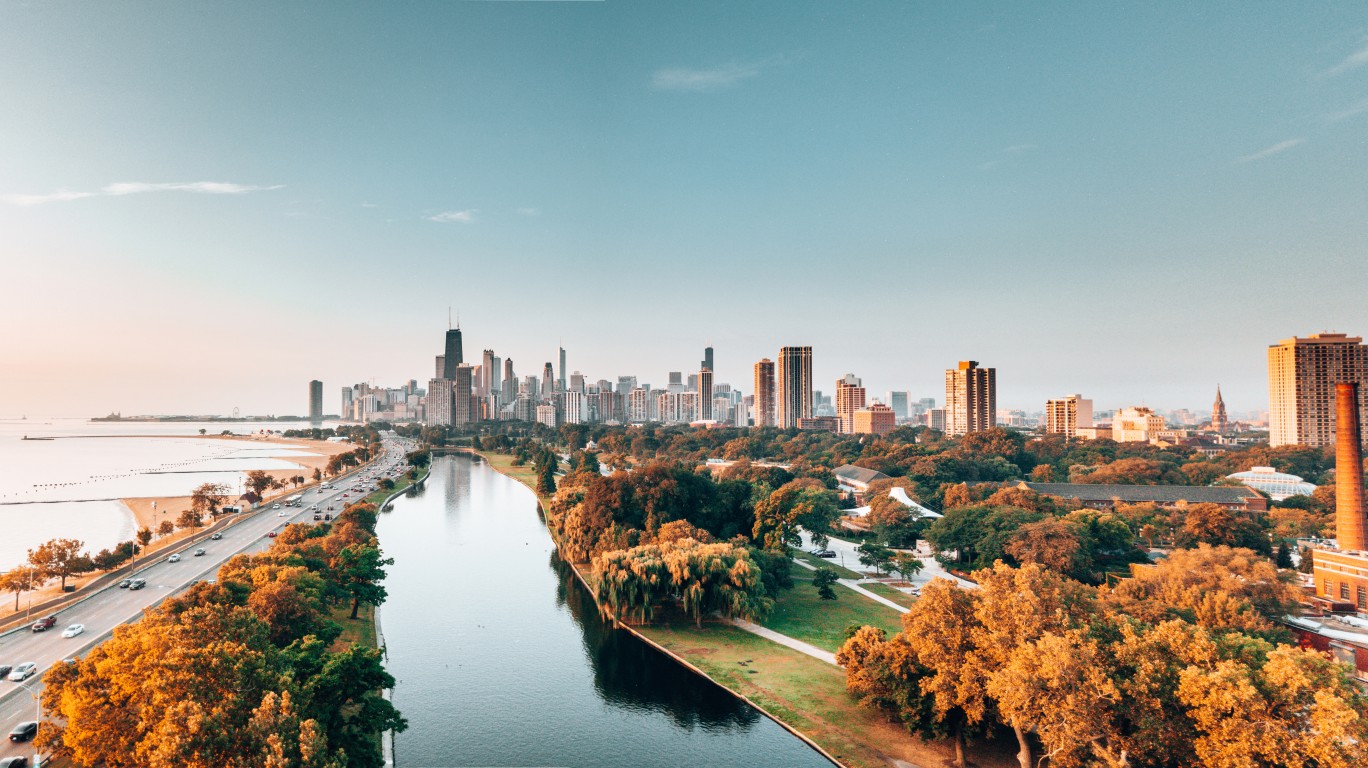
15. Chicago, IL
> Average annual parks and rec investment: $182 per person
> Residents within a 10 min walk of a park : 98% – #7 highest out of 100 largest cities
> Median household income: $62,097 – #46 highest in nation
> Total population: 2,699,347 – #3 largest in nation
[in-text-ad]
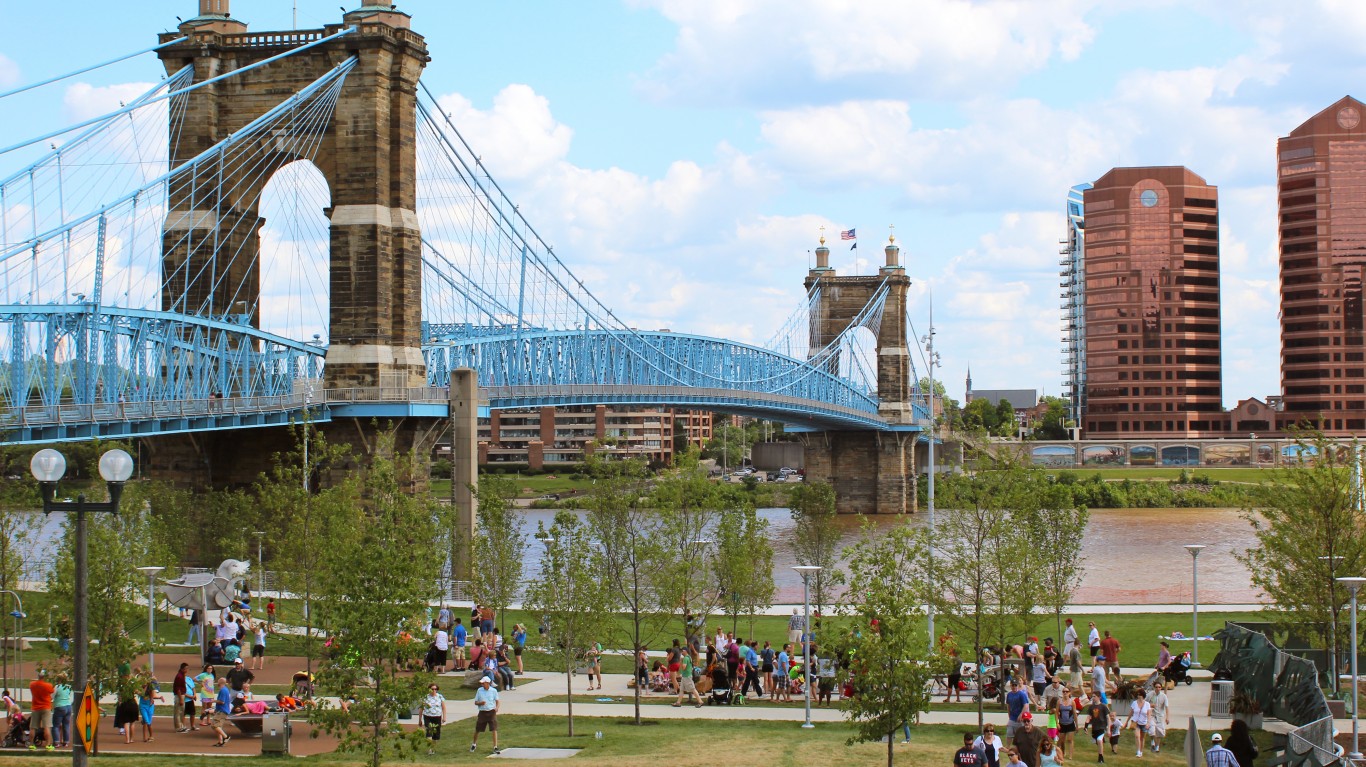
14. Cincinnati, OH
> Average annual parks and rec investment: $183 per person
> Residents within a 10 min walk of a park : 88% – #24 highest out of 100 largest cities
> Median household income: $42,663 – #92 highest in nation
> Total population: 302,687 – #63 largest in nation
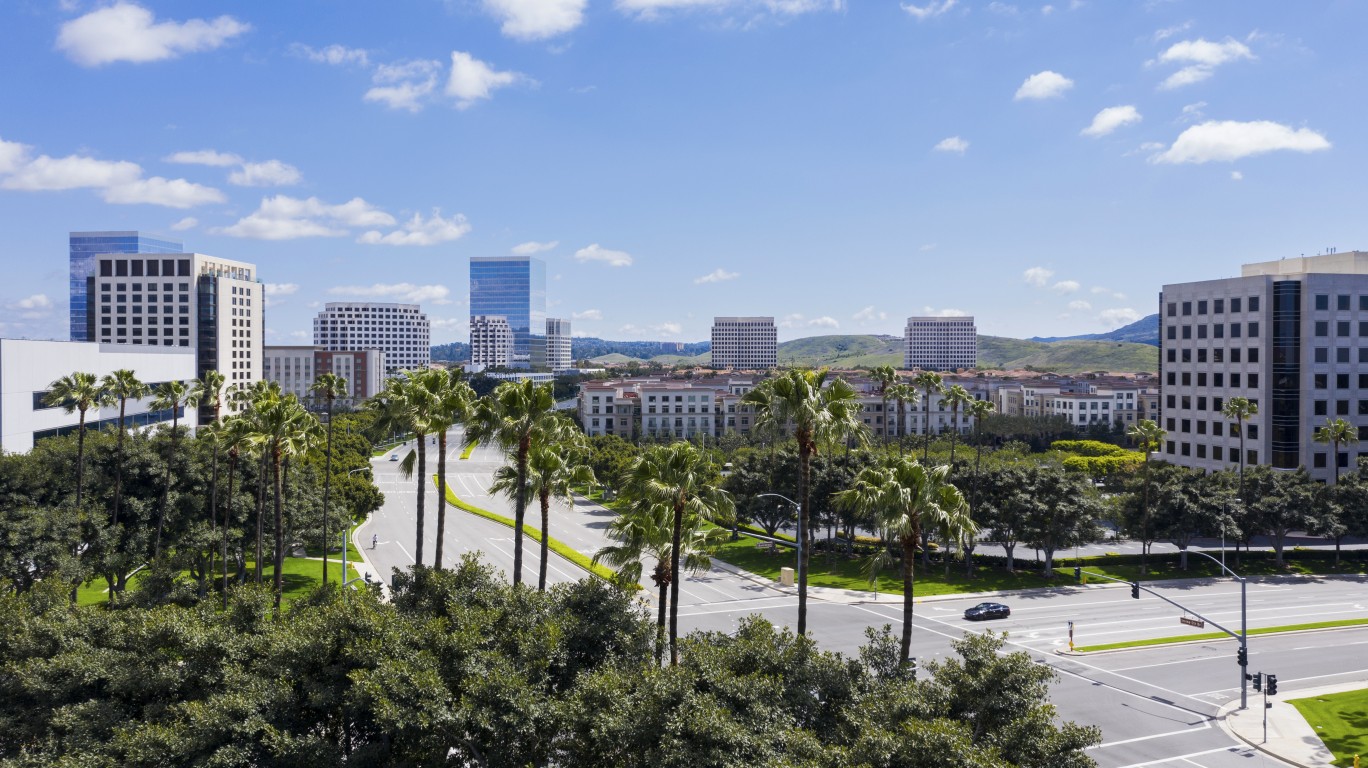
13. Irvine, CA
> Average annual parks and rec investment: $185 per person
> Residents within a 10 min walk of a park : 89% – #20 highest out of 100 largest cities
> Median household income: $108,318 – #5 highest in nation
> Total population: 272,694 – #73 largest in nation
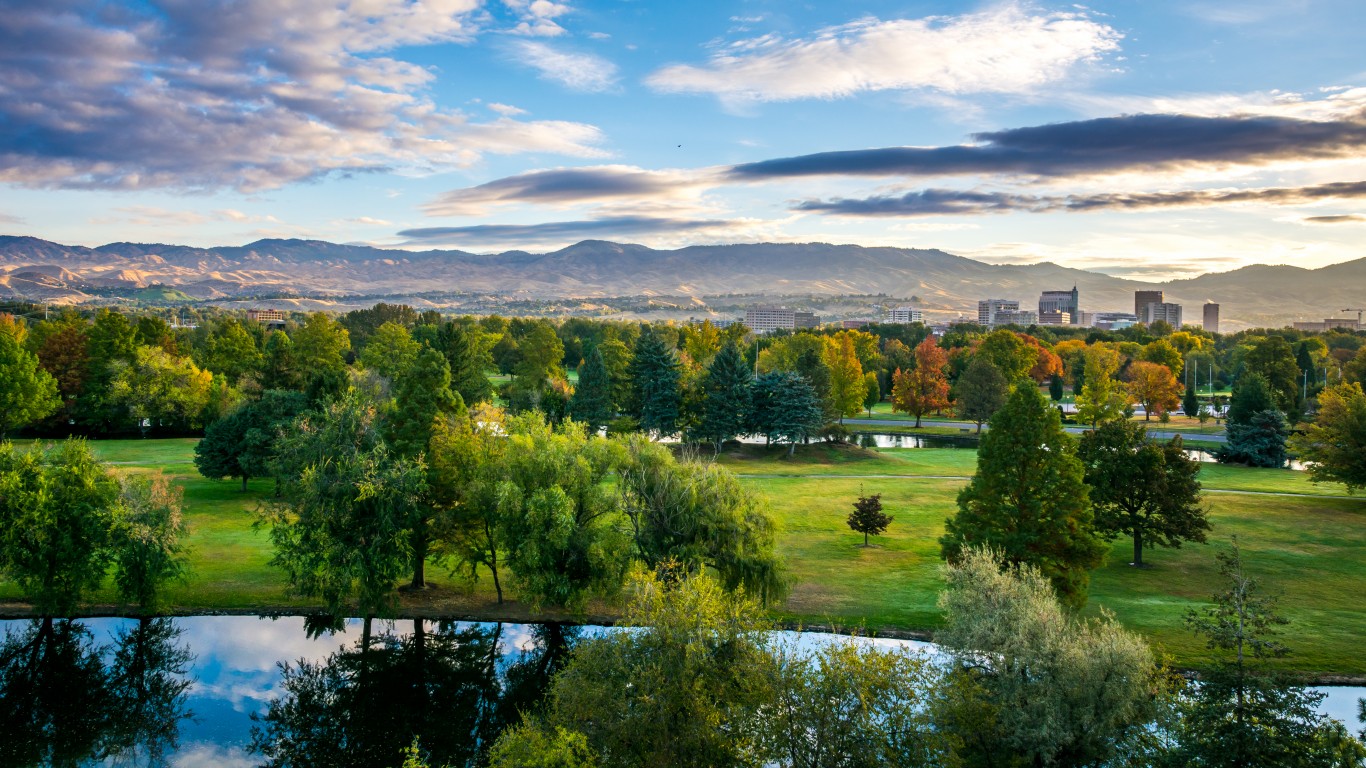
12. Boise, ID
> Average annual parks and rec investment: $190 per person
> Residents within a 10 min walk of a park : 65% – #65 highest out of 100 largest cities
> Median household income: $63,778 – #42 highest in nation
> Total population: 228,057 – #96 largest in nation
[in-text-ad-2]
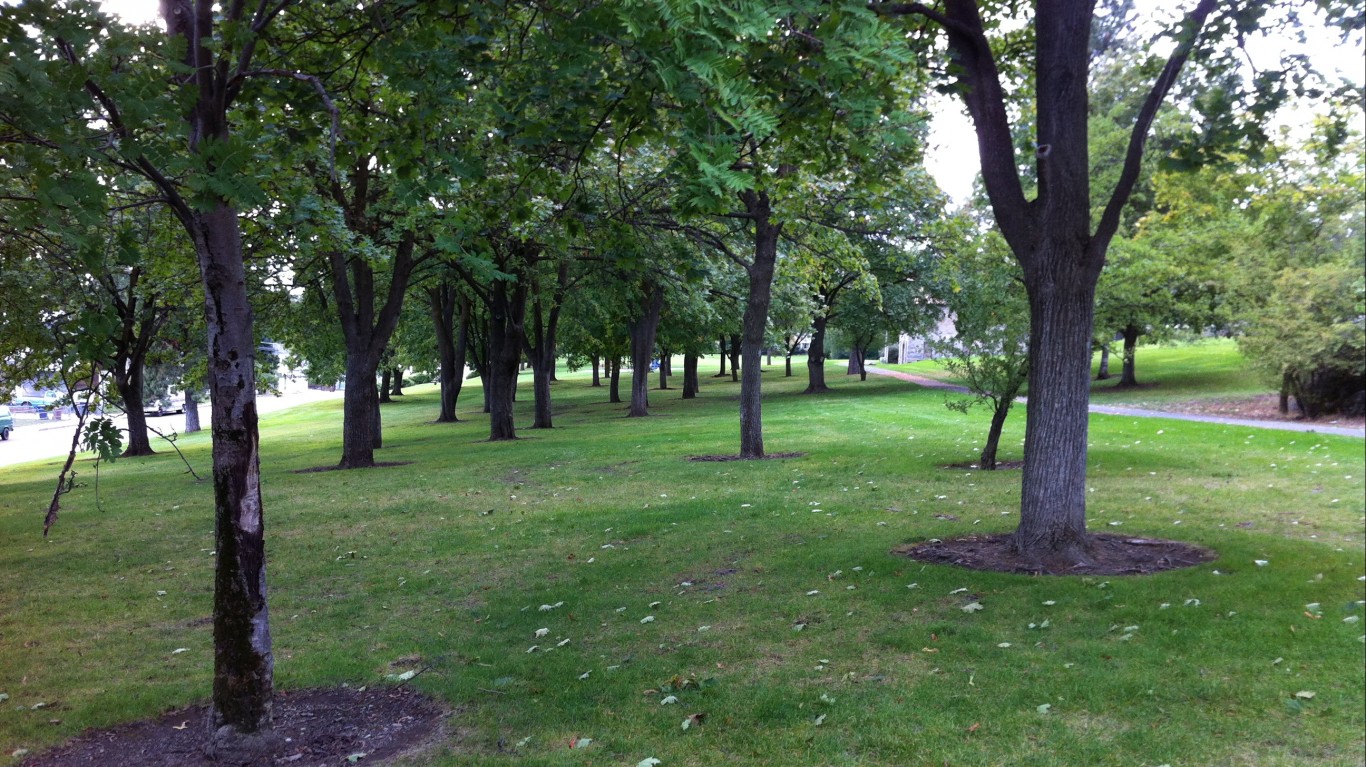
11. Spokane, WA
> Average annual parks and rec investment: $194 per person
> Residents within a 10 min walk of a park : 87% – #26 highest out of 100 largest cities
> Median household income: $52,600 – #76 highest in nation
> Total population: 219,185 – #98 largest in nation
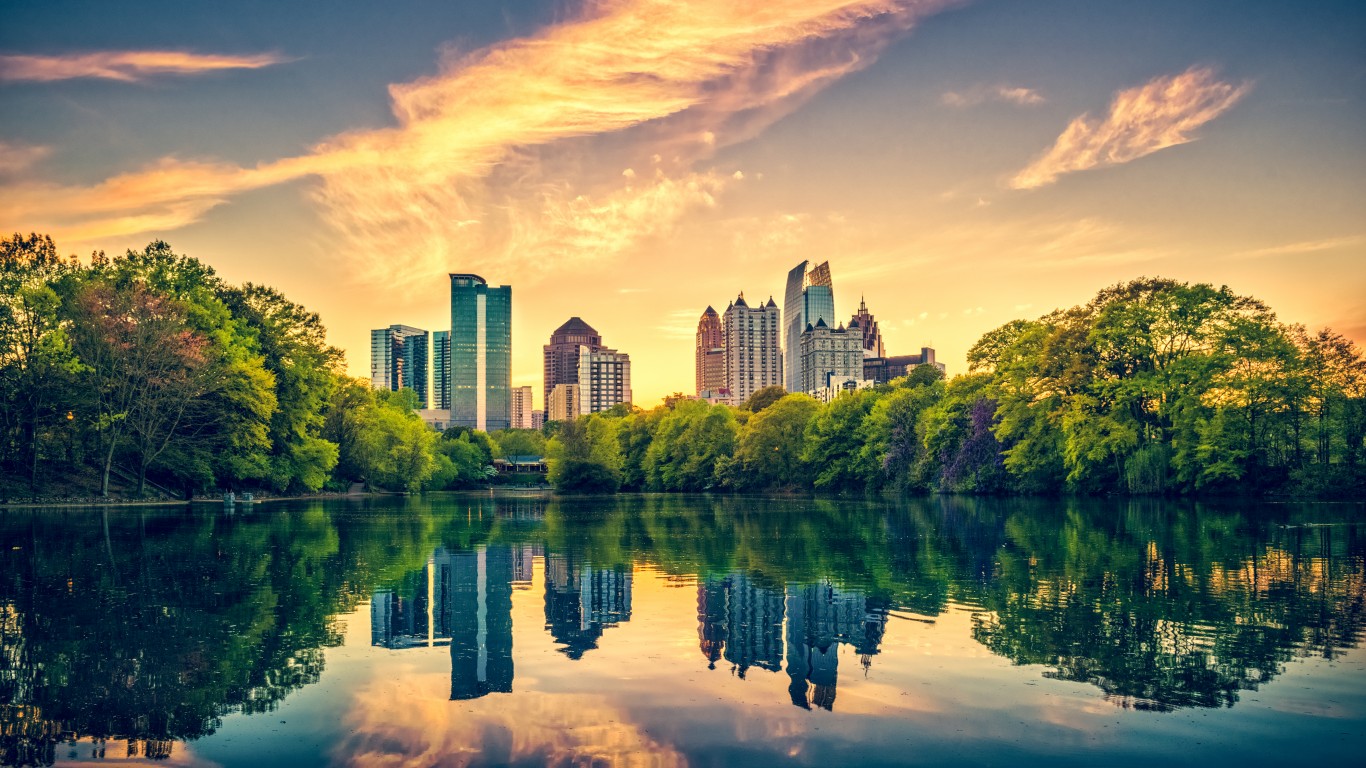
10. Atlanta, GA
> Average annual parks and rec investment: $206 per person
> Residents within a 10 min walk of a park : 77% – #39 highest out of 100 largest cities
> Median household income: $64,179 – #41 highest in nation
> Total population: 497,642 – #35 largest in nation
[in-text-ad]
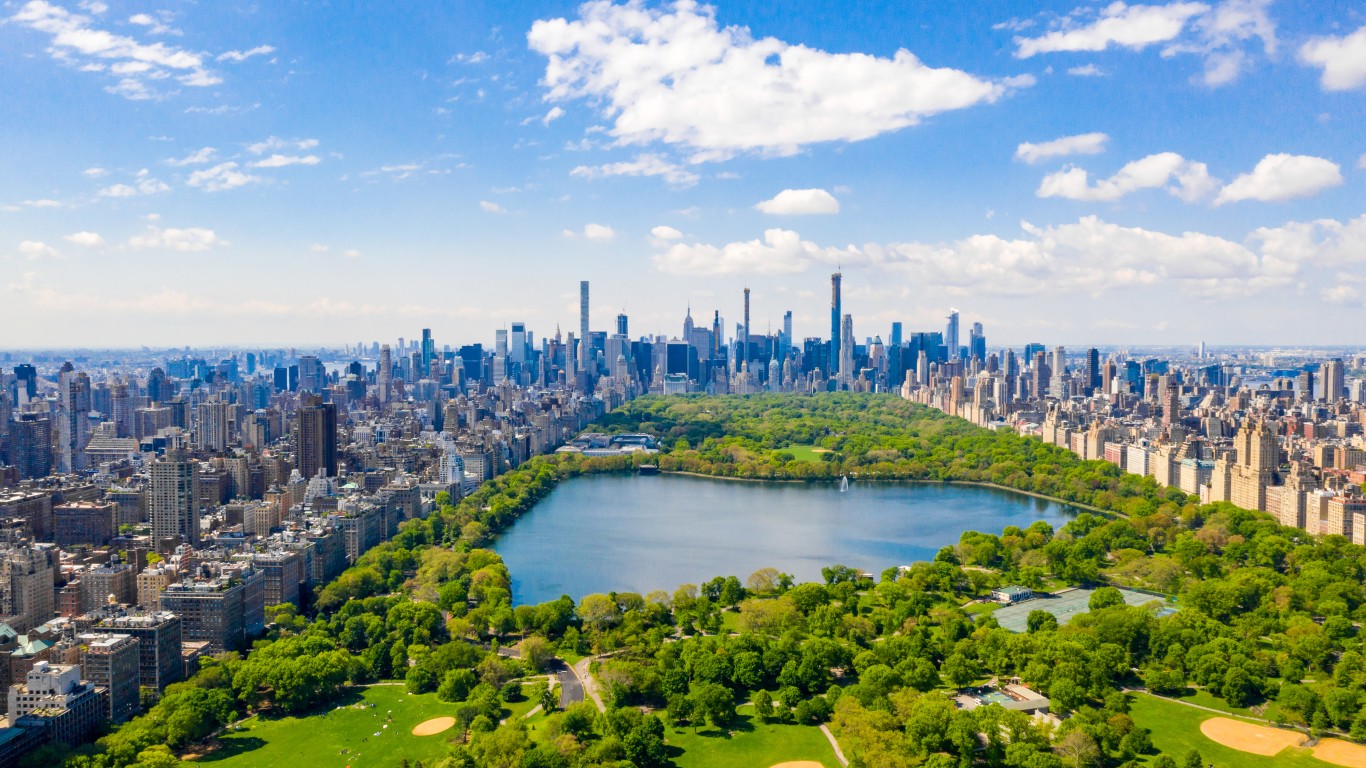
9. New York, NY
> Average annual parks and rec investment: $209 per person
> Residents within a 10 min walk of a park : 99% – #3 highest out of 100 largest cities
> Median household income: $67,046 – #32 highest in nation
> Total population: 8,379,552 – #1 largest in nation
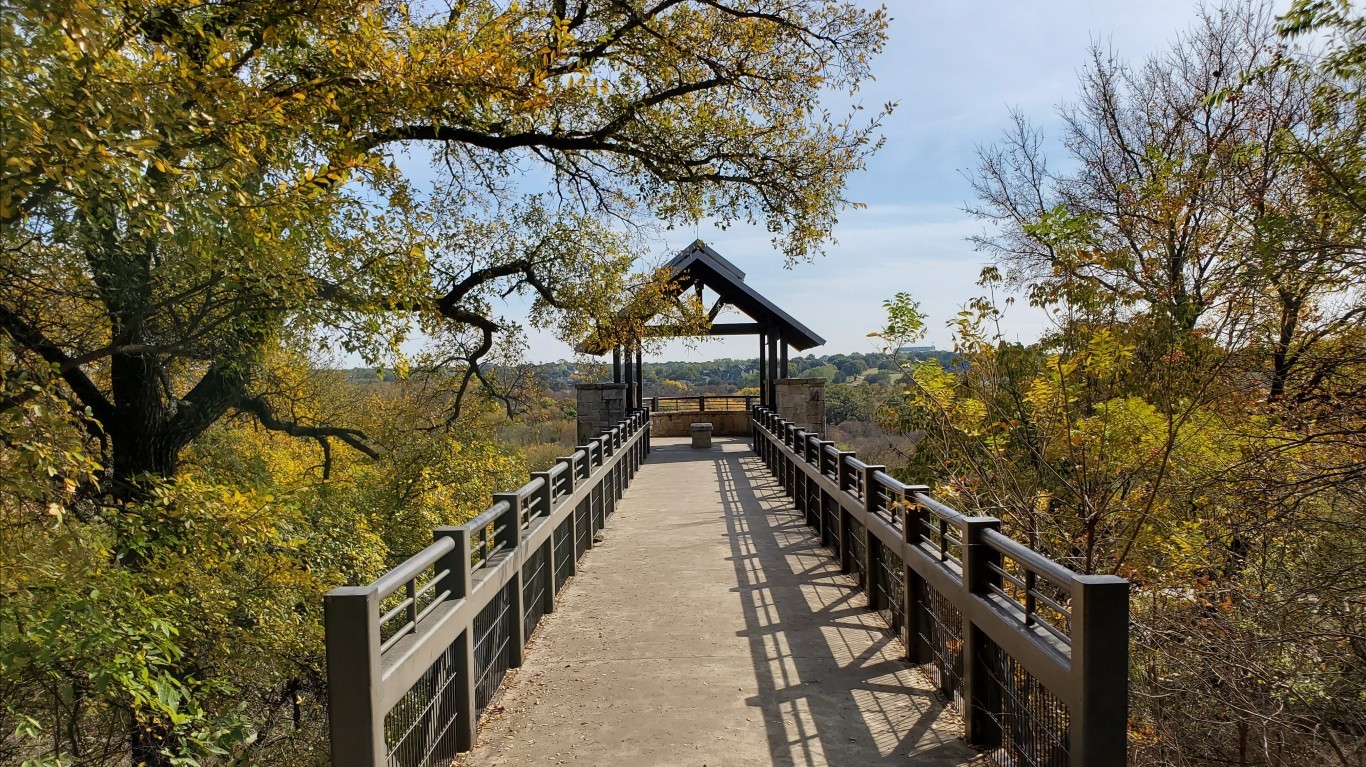
8. Plano, TX
> Average annual parks and rec investment: $219 per person
> Residents within a 10 min walk of a park : 77% – #39 highest out of 100 largest cities
> Median household income: $96,348 – #8 highest in nation
> Total population: 288,870 – #67 largest in nation
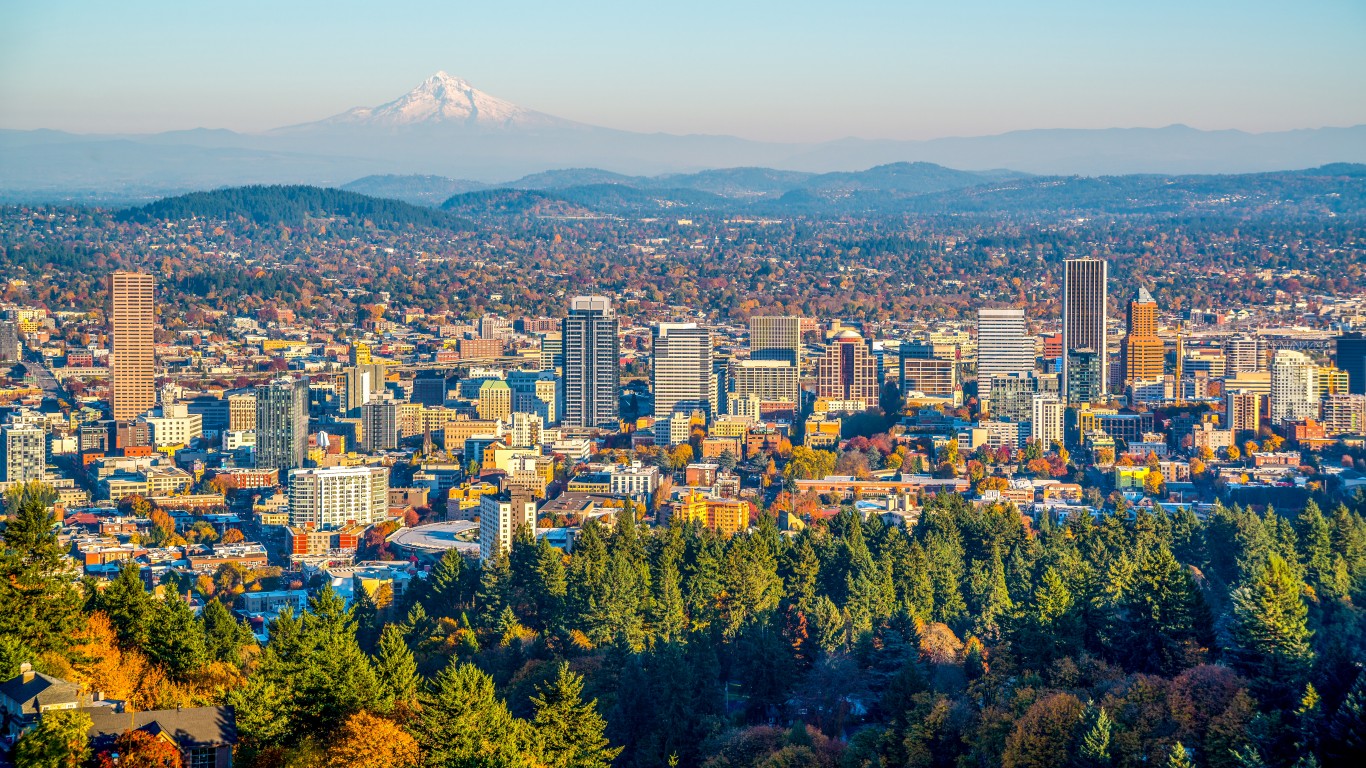
7. Portland, OR
> Average annual parks and rec investment: $229 per person
> Residents within a 10 min walk of a park : 90% – #18 highest out of 100 largest cities
> Median household income: $73,159 – #23 highest in nation
> Total population: 650,380 – #24 largest in nation
[in-text-ad-2]
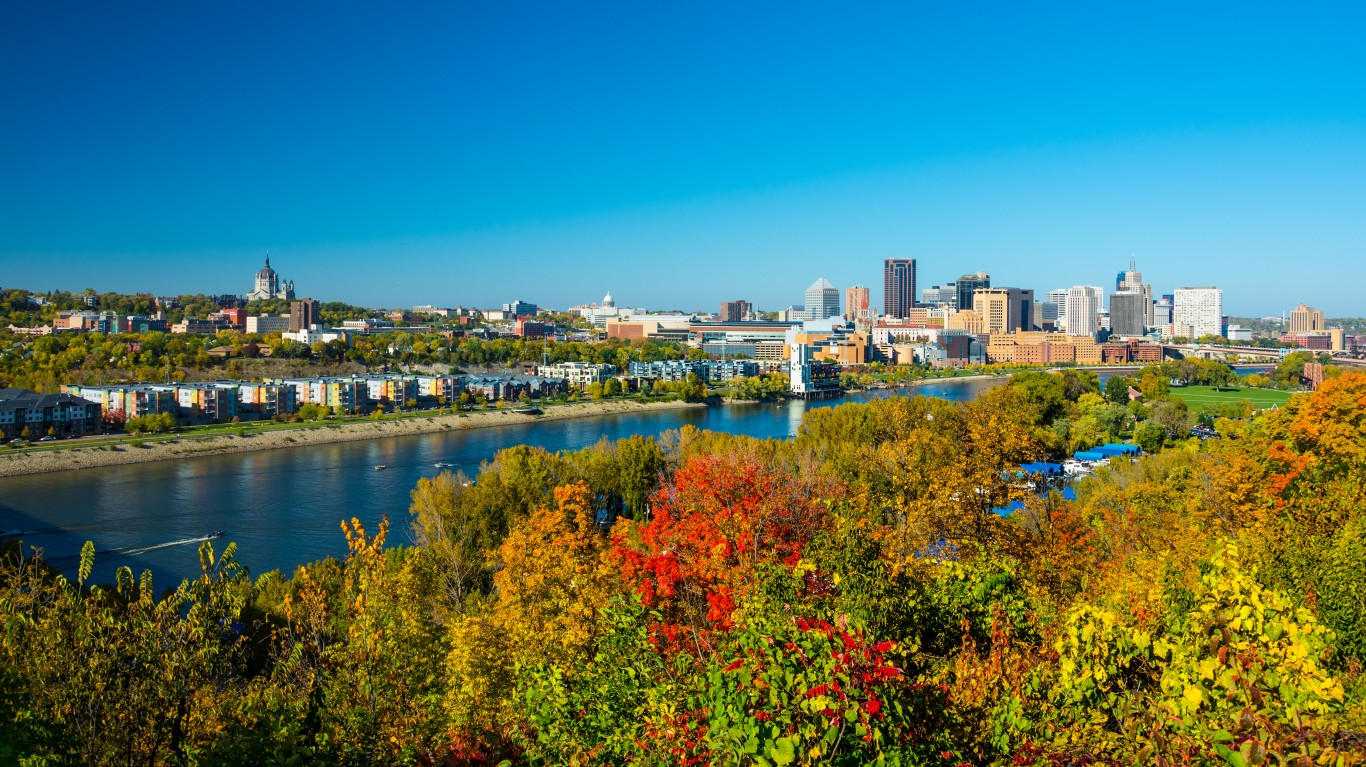
6. St. Paul, MN
> Average annual parks and rec investment: $247 per person
> Residents within a 10 min walk of a park : 99% – #3 highest out of 100 largest cities
> Median household income: $59,717 – #55 highest in nation
> Total population: 305,877 – #61 largest in nation
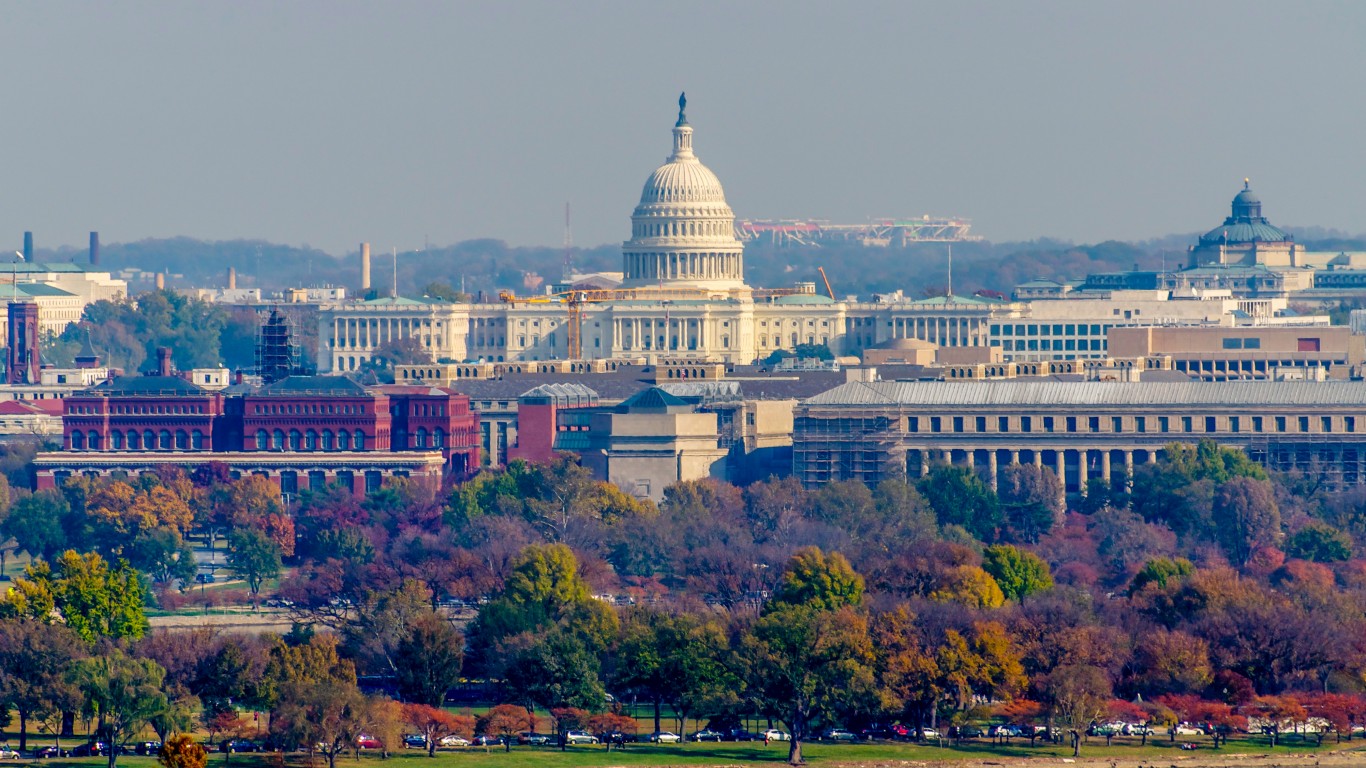
5. Washington, D.C.
> Average annual parks and rec investment: $284 per person
> Residents within a 10 min walk of a park : 98% – #7 highest out of 100 largest cities
> Median household income: $90,842 – #10 highest in nation
> Total population: 701,974 – #19 largest in nation
[in-text-ad]
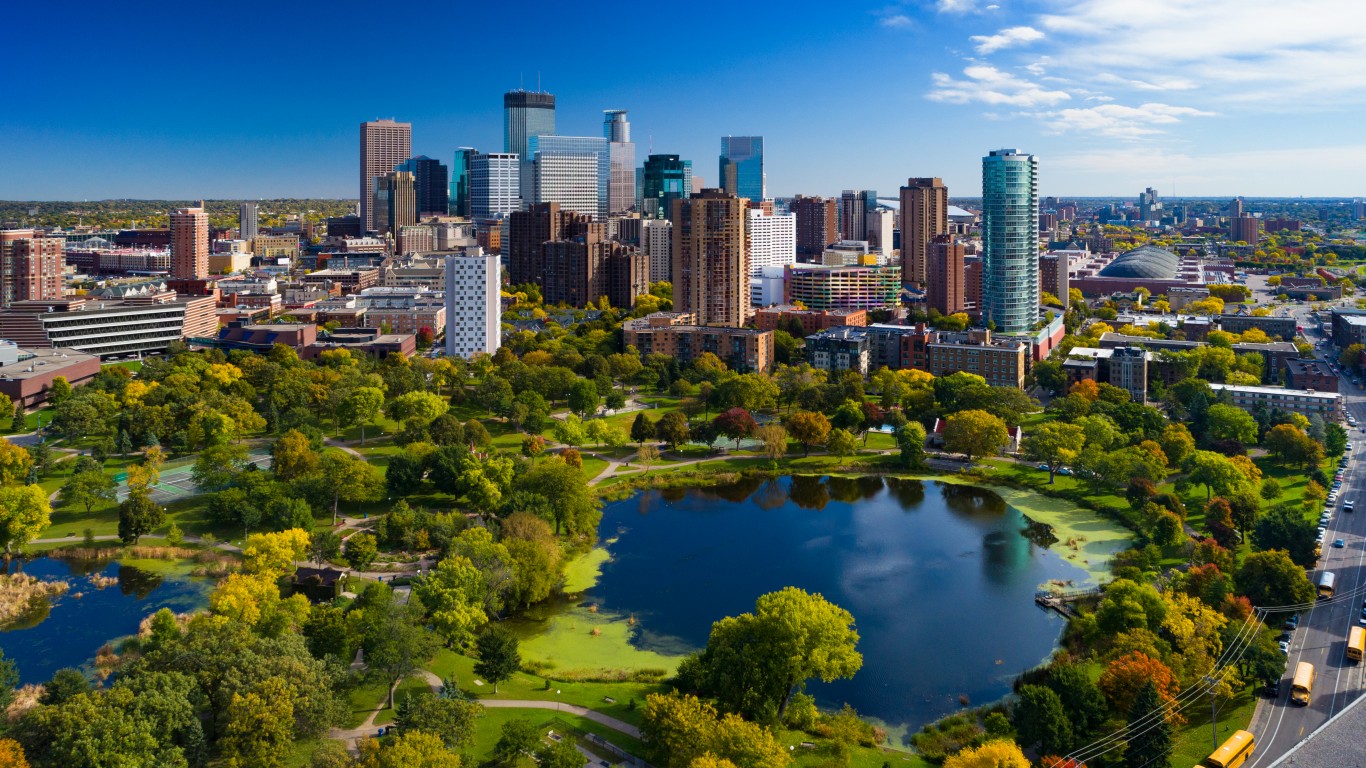
4. Minneapolis, MN
> Average annual parks and rec investment: $317 per person
> Residents within a 10 min walk of a park : 98% – #7 highest out of 100 largest cities
> Median household income: $66,068 – #35 highest in nation
> Total population: 424,536 – #43 largest in nation
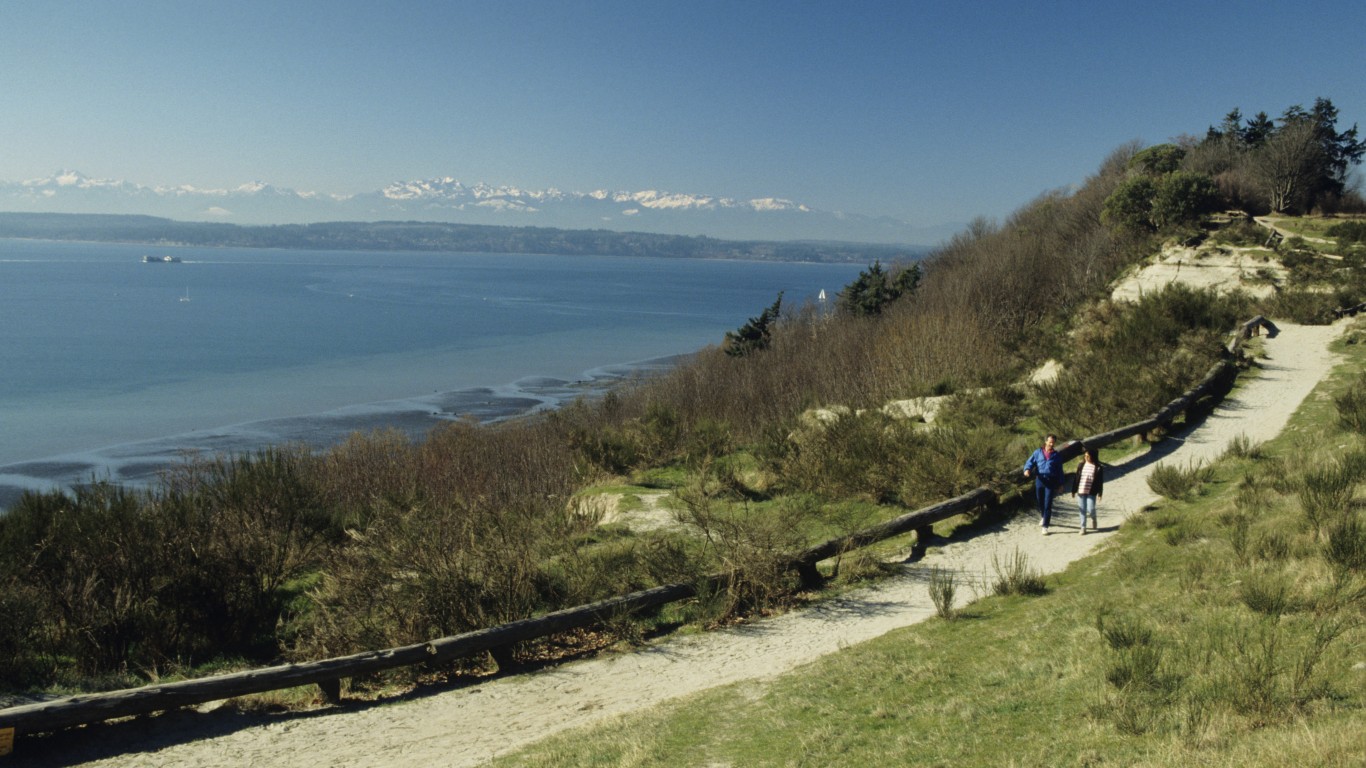
3. Seattle, WA
> Average annual parks and rec investment: $325 per person
> Residents within a 10 min walk of a park : 99% – #3 highest out of 100 largest cities
> Median household income: $97,185 – #7 highest in nation
> Total population: 741,251 – #17 largest in nation
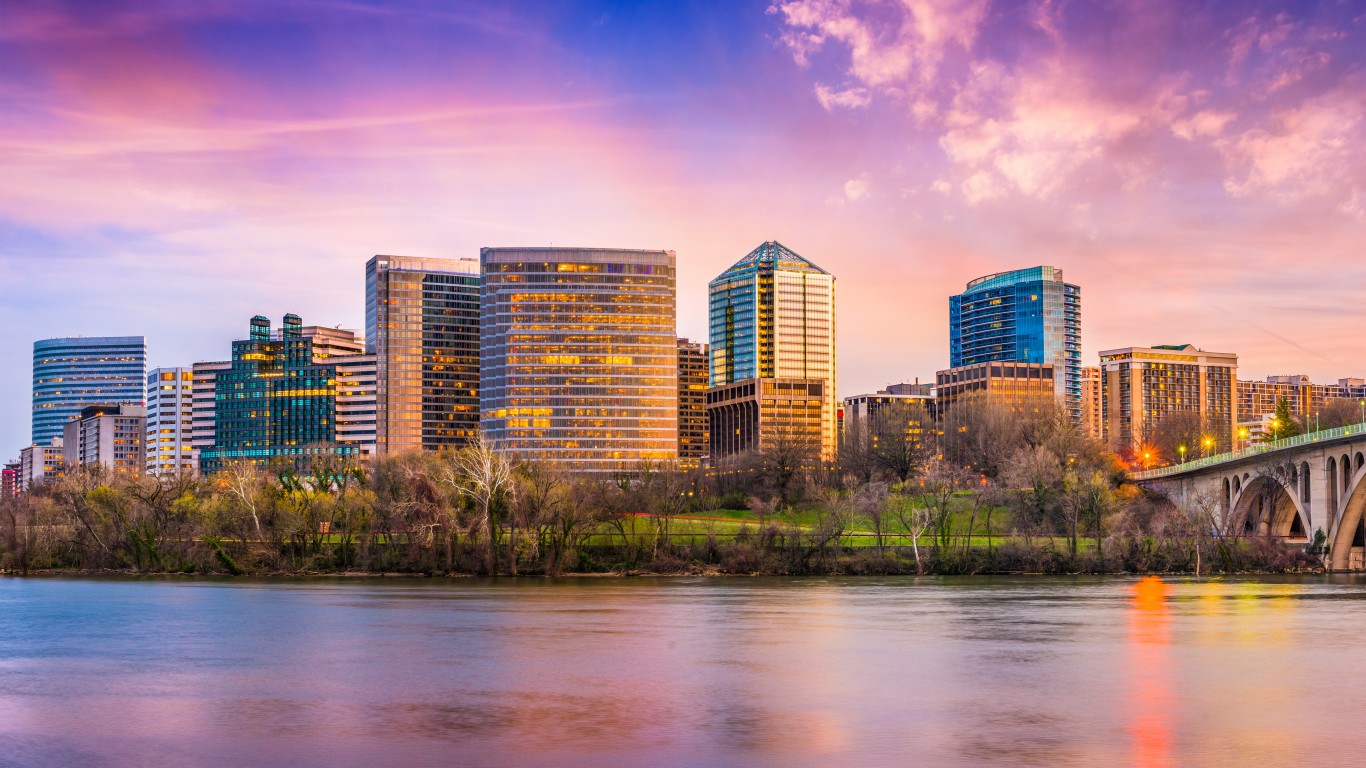
2. Arlington, VA
> Average annual parks and rec investment: $359 per person
> Residents within a 10 min walk of a park : 99% – #3 highest out of 100 largest cities
> Median household income: $122,604 – #2 highest in nation
> Total population: 236,434 – #92 largest in nation
[in-text-ad-2]
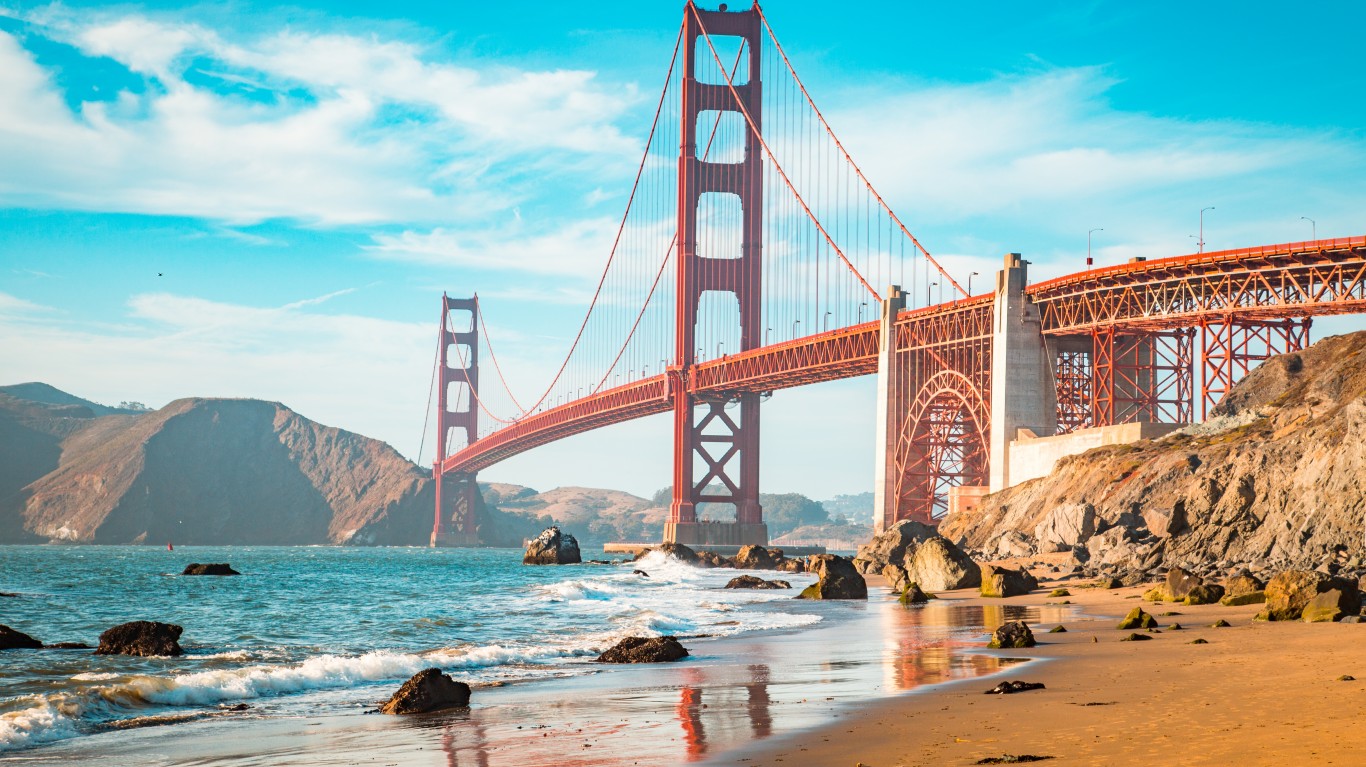
1. San Francisco, CA
> Average annual parks and rec investment: $420 per person
> Residents within a 10 min walk of a park : 100% – #1 highest out of 100 largest cities
> Median household income: $119,136 – #3 highest in nation
> Total population: 874,784 – #15 largest in nation
100 Million Americans Are Missing This Crucial Retirement Tool
The thought of burdening your family with a financial disaster is most Americans’ nightmare. However, recent studies show that over 100 million Americans still don’t have proper life insurance in the event they pass away.
Life insurance can bring peace of mind – ensuring your loved ones are safeguarded against unforeseen expenses and debts. With premiums often lower than expected and a variety of plans tailored to different life stages and health conditions, securing a policy is more accessible than ever.
A quick, no-obligation quote can provide valuable insight into what’s available and what might best suit your family’s needs. Life insurance is a simple step you can take today to help secure peace of mind for your loved ones tomorrow.
Click here to learn how to get a quote in just a few minutes.
Thank you for reading! Have some feedback for us?
Contact the 24/7 Wall St. editorial team.
 24/7 Wall St.