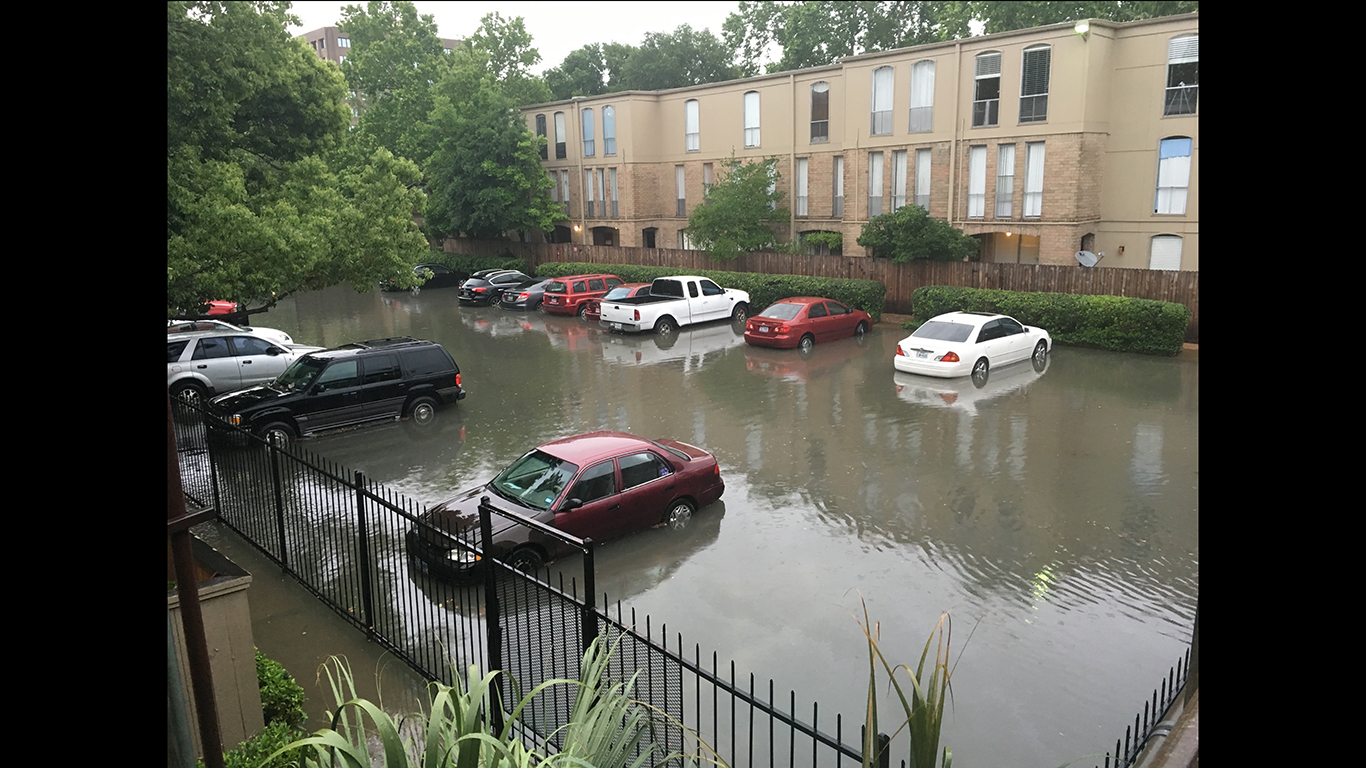
Parts of the United States this week, notably Vermont, have experienced extreme flooding this week, caused by days of torrential rainstorms. Rainfall is of course only one cause of flooding, the other major one being rising sea levels and storm surge, which causes coastal flooding. Sea level rise is one of the most serious problems facing humans as a result of climate change. Rising waters cause and may result in the loss of land if levels continue to rise. All around the world, low-lying areas are at risk. By the end of this century, land currently home to 200 million people will likely be permanently below the high tide line. (These are the 25 worst cities to live as climate change worsens.)
Because of the economic benefits associated with access to water — shipping, arable soil, fisheries, tourism, and recreation — dense urban areas have long been concentrated along coastal regions. Today, about 40% of the world’s population live within 60 miles of the coast.
As the climate crisis intensifies, however, coastal living has become a major liability. Global sea levels are projected to rise between 2 and 7 feet by 2050, and possibly more. By the end of the century, sea levels could rise as much as 20 feet. In this scenario, the United States alone would lose nearly 50,000 square miles, which today are home to 23.4 million people.
Frequent flooding is one of the first problems associated with sea level rise.
24/7 Wall St. used data from Climate Central — an independent organization of scientists and journalists researching and reporting on climate change — to identify 25 major metropolitan areas and urban agglomerations worldwide that are projected to be at risk of substantial flooding by 2050 as a result of sea level rise due to climate change. The data assembled by Climate Central is documented in the report, “New elevation data triple estimates of global vulnerability to sea-level rise and coastal flooding.”
These projections are near the high end of the range of sea level futures anticipated by the scientific community. We elected to concentrate on the high-risk scenario because, while there are still steps the world can take to address the problems of climate change, the world is not on track to meet even the more modest milestones outlined in the Paris Agreement.
While most of the cities on this list are in Asian nations, the United States is still at substantial risk for coastal flooding. Two of the cities selected for our list are in the United States, and many coastal cities and towns are at risk from flooding and coastal erosion. Here are 30 American beaches that may soon disappear.
Click here to see 25 cities around the world that will soon be underwater
Click here to see our full methodology
Click image to enlarge
25. Chittagong, Bangladesh
> 2020 population: 5.0 million
> Bangladesh population at risk of sea-level rise by 2050: 43.0 million
> Bangladesh CO2 emissions from fuel combustion in 2017: 88.1 million metric tons (0.53 metric tons per person)
[in-text-ad]
24. Yangon, Myanmar
> 2020 population: 5.3 million
> Myanmar population of land area at risk of sea-level rise: 3.3 million
> Myanmar CO2 emissions from fuel combustion in 2017: 25.3 million metric tons (0.47 metric tons per person)
23. Kitakyushu-Fukuoka M.M.A., Japan
> 2020 population: 5.5 million
> Japan population of land area at risk of sea-level rise: 5.5 million
> Japan CO2 emissions from fuel combustion in 2017: 1,205.1 million metric tons (9.50 metric tons per person)
22. Philadelphia, United States
> 2020 population: 5.7 million
> United States population of land area at risk of sea-level rise: 2.2 million
> United States CO2 emissions from fuel combustion in 2017: 5,269.5 million metric tons (16.21 metric tons per person)
[in-text-ad-2]
21. Suzhou, Jiangsu, China
> 2020 population: 7.1 million
> China population of land area at risk of sea-level rise: 95.0 million
> China CO2 emissions from fuel combustion in 2017: 9,838.8 million metric tons (7.10 metric tons per person)
20. Surat, India
> 2020 population: 7.2 million
> India population of land area at risk of sea-level rise: 35.0 million
> India CO2 emissions from fuel combustion in 2017: 2,466.8 million metric tons (1.84 metric tons per person)
[in-text-ad]
19. Foshan, China
> 2020 population: 7.3 million
> China population of land area at risk of sea-level rise: 95.0 million
> China CO2 emissions from fuel combustion in 2017: 9,838.8 million metric tons (7.10 metric tons per person)
18. Hong Kong, China
> 2020 population: 7.5 million
> China population of land area at risk of sea-level rise: 95.0 million
> China CO2 emissions from fuel combustion in 2017: 9,838.8 million metric tons (7.10 metric tons per person)
17. Hangzhou, China
> 2020 population: 7.6 million
> China population of land area at risk of sea-level rise: 95.0 million
> China CO2 emissions from fuel combustion in 2017: 9,838.8 million metric tons (7.10 metric tons per person)
[in-text-ad-2]
16. Thành Pho Ho Chí Minh (Ho Chi Minh City), Vietnam
> 2020 population: 8.6 million
> Vietnam population of land area at risk of sea-level rise: 31.0 million
> Vietnam CO2 emissions from fuel combustion in 2017: 198.8 million metric tons (2.08 metric tons per person)
15. Nanjing, Jiangsu, China
> 2020 population: 8.8 million
> China population of land area at risk of sea-level rise: 95.0 million
> China CO2 emissions from fuel combustion in 2017: 9,838.8 million metric tons (7.10 metric tons per person)
[in-text-ad]
14. London, United Kingdom
> 2020 population: 9.3 million
> United Kingdom population of land area at risk of sea-level rise: 3.7 million
> United Kingdom CO2 emissions from fuel combustion in 2017: 384.7 million metric tons (5.83 metric tons per person)
13. Chukyo M.M.A. (Nagoya), Japan
> 2020 population: 9.6 million
> Japan population of land area at risk of sea-level rise: 5.5 million
> Japan CO2 emissions from fuel combustion in 2017: 1,205.1 million metric tons (9.50 metric tons per person)
12. Krung Thep (Bangkok), Thailand
> 2020 population: 10.5 million
> Thailand population of land area at risk of sea-level rise: 11.0 million
> Thailand CO2 emissions from fuel combustion in 2017: 330.8 million metric tons (4.79 metric tons per person)
[in-text-ad-2]
11. Jakarta, Indonesia
> 2020 population: 10.8 million
> Indonesia population of land area at risk of sea-level rise: 24.0 million
> Indonesia CO2 emissions from fuel combustion in 2017: 486.8 million metric tons (1.84 metric tons per person)
10. Chennai (Madras), India
> 2020 population: 11.0 million
> India population of land area at risk of sea-level rise: 35.0 million
> India CO2 emissions from fuel combustion in 2017: 2,466.8 million metric tons (1.84 metric tons per person)
[in-text-ad]
9. Shenzhen, China
> 2020 population: 12.4 million
> China population of land area at risk of sea-level rise: 95.0 million
> China CO2 emissions from fuel combustion in 2017: 9,838.8 million metric tons (7.10 metric tons per person)
8. Guangzhou, Guangdong, China
> 2020 population: 13.3 million
> China population of land area at risk of sea-level rise: 95.0 million
> China CO2 emissions from fuel combustion in 2017: 9,838.8 million metric tons (7.10 metric tons per person)
7. Tianjin, China
> 2020 population: 13.6 million
> China population of land area at risk of sea-level rise: 95.0 million
> China CO2 emissions from fuel combustion in 2017: 9,838.8 million metric tons (7.10 metric tons per person)
[in-text-ad-2]
6. Manila, Philippines
> 2020 population: 13.9 million
> Philippines population of land area at risk of sea-level rise: 7.0 million
> Philippines CO2 emissions from fuel combustion in 2017: 127.6 million metric tons (1.22 metric tons per person)
5. Kolkata (Calcutta), India
> 2020 population: 14.9 million
> India population of land area at risk of sea-level rise: 35.0 million
> India CO2 emissions from fuel combustion in 2017: 2,466.8 million metric tons (1.84 metric tons per person)
[in-text-ad]
4. New York-Newark, United States
> 2020 population: 18.8 million
> United States population of land area at risk of sea-level rise: 2.2 million
> United States CO2 emissions from fuel combustion in 2017: 5,269.5 million metric tons (16.21 metric tons per person)
3. Mumbai (Bombay), India
> 2020 population: 20.4 million
> India population of land area at risk of sea-level rise: 35.0 million
> India CO2 emissions from fuel combustion in 2017: 2,466.8 million metric tons (1.84 metric tons per person)
2. Dhaka, Bangladesh
> 2020 population: 21.0 million
> Bangladesh population at risk of sea-level rise by 2050: 43.0 million
> Bangladesh CO2 emissions from fuel combustion in 2017: 88.1 million metric tons (0.53 metric tons per person)
[in-text-ad-2]
1. Shanghai, China
> 2020 population: 27.1 million
> China population of land area at risk of sea-level rise: 95.0 million
> China CO2 emissions from fuel combustion in 2017: 9,838.8 million metric tons (7.10 metric tons per person)
Methodology
24/7 Wall St. used data from Climate Central — an independent organization of scientists and journalists researching and reporting on climate change — to identify major metropolitan areas and urban agglomerations that are projected to be at risk of substantial flooding by 2050 as a result of sea level rise due to climate change.
To look for cities at risk, we first identified the countries with the largest populations in areas that will lie below projected high tide lines by 2050, using the more pessimistic rcp 8.5 projection of ongoing global carbon dioxide emissions and employing an assessment of anticipated sea level rise by Kopp et al., published in 2017. Based on this same model, we used Climate Central’s Coastal Risk Screening tool to review the urban agglomerations and metropolitan areas that fall within high-risk countries that have populations of at least 5 million residents and are at risk of substantial inundation by 2050.
Carbon emissions figures are for 2017 and are from the Global Carbon Project 2018, accessed through the Integrated Carbon Observation System of the Department of Physical Geography and Ecosystem Science at Lund University. These figures are expressed in millions of metric tons of CO2 emitted from fossil fuels and cement production within a country’s borders.
City population estimates are projections for 2020, and are from the 2018 Revision of World Urbanization Prospects, which was produced by the Population Dynamics Division of the United Nations’ Department of Economic and Social Affairs.
In 20 Years, I Haven’t Seen A Cash Back Card This Good
After two decades of reviewing financial products I haven’t seen anything like this. Credit card companies are at war, handing out free rewards and benefits to win the best customers.
A good cash back card can be worth thousands of dollars a year in free money, not to mention other perks like travel, insurance, and access to fancy lounges.
Our top pick today pays up to 5% cash back, a $200 bonus on top, and $0 annual fee. Click here to apply before they stop offering rewards this generous.
Flywheel Publishing has partnered with CardRatings for our coverage of credit card products. Flywheel Publishing and CardRatings may receive a commission from card issuers.
Thank you for reading! Have some feedback for us?
Contact the 24/7 Wall St. editorial team.


 24/7 Wall St.


 24/7 Wall St.


