Special Report
This Is How Many People Have Died From COVID-19 in Each State

Published:

There have been over 1 million deaths attributed to COVID-19 in the United States — and that number continues to grow every day.
Adjusting for population, no state has reported more coronavirus deaths than Arizona. Since the pandemic began, Arizona has reported a total of 30,572 deaths — or 426 for every 100,000 people. Per capita deaths attributable to the virus are also high in Mississippi, Alabama, Tennessee, and West Virginia. In each of these places, the death rate stands at at least 393 per 100,000 people.
For context, the national COVID-19 death rate stands at 309 deaths for every 100,000 people.
To date, Vermont has reported the fewest coronavirus deaths on a per capita basis. There have been an estimated 104 COVID-19 deaths across the state for every 100,000 people since the pandemic began.
Though it is not always the case, states with higher than average COVID-19 deaths per capita are often also home to larger high-risk populations. One such group is retirement-age Americans, who are far more likely to die from the virus than younger Americans, if infected. Nationwide, 16.5% of the population fall into that age group.
All COVID-19 data used in the story is current as of July 13, 2022.

51. Vermont
> Total COVID-19 deaths in Vermont: 104 per 100,000 people (total: 654)
> Total COVID-19 infections in Vermont: 20,252 per 100,000 people (total: 126,839)
> 65 and older population: 20.1%
> Total population: 626,299

50. Hawaii
> Total COVID-19 deaths in Hawaii: 106 per 100,000 people (total: 1,512)
> Total COVID-19 infections in Hawaii: 21,496 per 100,000 people (total: 305,348)
> 65 and older population: 19.0%
> Total population: 1,420,491
These are all the counties in Hawaii where COVID-19 is slowing (and where it’s still getting worse).

49. Utah
> Total COVID-19 deaths in Utah: 153 per 100,000 people (total: 4,847)
> Total COVID-19 infections in Utah: 31,311 per 100,000 people (total: 989,767)
> 65 and older population: 11.4%
> Total population: 3,161,105
These are all the counties in Utah where COVID-19 is slowing (and where it’s still getting worse).

48. Alaska
> Total COVID-19 deaths in Alaska: 170 per 100,000 people (total: 1,252)
> Total COVID-19 infections in Alaska: 35,832 per 100,000 people (total: 264,237)
> 65 and older population: 12.4%
> Total population: 737,438
These are all the counties in Alaska where COVID-19 is slowing (and where it’s still getting worse).

47. Washington
> Total COVID-19 deaths in Washington: 177 per 100,000 people (total: 13,362)
> Total COVID-19 infections in Washington: 22,454 per 100,000 people (total: 1,692,004)
> 65 and older population: 15.9%
> Total population: 7,535,591

46. Maine
> Total COVID-19 deaths in Maine: 184 per 100,000 people (total: 2,462)
> Total COVID-19 infections in Maine: 20,330 per 100,000 people (total: 272,102)
> 65 and older population: 21.3%
> Total population: 1,338,404
These are all the counties in Maine where COVID-19 is slowing (and where it’s still getting worse).

45. Oregon
> Total COVID-19 deaths in Oregon: 188 per 100,000 people (total: 7,862)
> Total COVID-19 infections in Oregon: 19,725 per 100,000 people (total: 826,600)
> 65 and older population: 18.2%
> Total population: 4,190,713
These are all the counties in Oregon where COVID-19 is slowing (and where it’s still getting worse).

44. New Hampshire
> Total COVID-19 deaths in New Hampshire: 192 per 100,000 people (total: 2,604)
> Total COVID-19 infections in New Hampshire: 24,650 per 100,000 people (total: 334,373)
> 65 and older population: 18.6%
> Total population: 1,356,458

43. Washington D.C.
> Total COVID-19 deaths in Washington D.C.: 198 per 100,000 people (total: 1,355)
> Total COVID-19 infections in Washington D.C.: 23,237 per 100,000 people (total: 159,055)
> 65 and older population: 12.4%
> Total population: 702,455
Click here to see all current COVID-19 data for Washington D.C.

42. Nebraska
> Total COVID-19 deaths in Nebraska: 225 per 100,000 people (total: 4,347)
> Total COVID-19 infections in Nebraska: 26,239 per 100,000 people (total: 506,223)
> 65 and older population: 16.1%
> Total population: 1,929,268

41. Colorado
> Total COVID-19 deaths in Colorado: 225 per 100,000 people (total: 12,842)
> Total COVID-19 infections in Colorado: 27,383 per 100,000 people (total: 1,559,633)
> 65 and older population: 14.7%
> Total population: 5,695,564

40. California
> Total COVID-19 deaths in California: 232 per 100,000 people (total: 91,930)
> Total COVID-19 infections in California: 25,953 per 100,000 people (total: 10,266,226)
> 65 and older population: 14.8%
> Total population: 39,557,045

39. Minnesota
> Total COVID-19 deaths in Minnesota: 235 per 100,000 people (total: 13,161)
> Total COVID-19 infections in Minnesota: 27,828 per 100,000 people (total: 1,561,487)
> 65 and older population: 16.3%
> Total population: 5,611,179

38. North Carolina
> Total COVID-19 deaths in North Carolina: 243 per 100,000 people (total: 25,259)
> Total COVID-19 infections in North Carolina: 27,886 per 100,000 people (total: 2,895,544)
> 65 and older population: 16.7%
> Total population: 10,383,620

37. Virginia
> Total COVID-19 deaths in Virginia: 244 per 100,000 people (total: 20,757)
> Total COVID-19 infections in Virginia: 22,332 per 100,000 people (total: 1,902,139)
> 65 and older population: 15.9%
> Total population: 8,517,685

36. Maryland
> Total COVID-19 deaths in Maryland: 246 per 100,000 people (total: 14,852)
> Total COVID-19 infections in Maryland: 19,055 per 100,000 people (total: 1,151,423)
> 65 and older population: 15.9%
> Total population: 6,042,718

35. Wisconsin
> Total COVID-19 deaths in Wisconsin: 255 per 100,000 people (total: 14,840)
> Total COVID-19 infections in Wisconsin: 29,968 per 100,000 people (total: 1,742,214)
> 65 and older population: 17.5%
> Total population: 5,813,568

34. Idaho
> Total COVID-19 deaths in Idaho: 285 per 100,000 people (total: 4,993)
> Total COVID-19 infections in Idaho: 26,734 per 100,000 people (total: 468,973)
> 65 and older population: 16.2%
> Total population: 1,754,208
These are all the counties in Idaho where COVID-19 is slowing (and where it’s still getting worse).

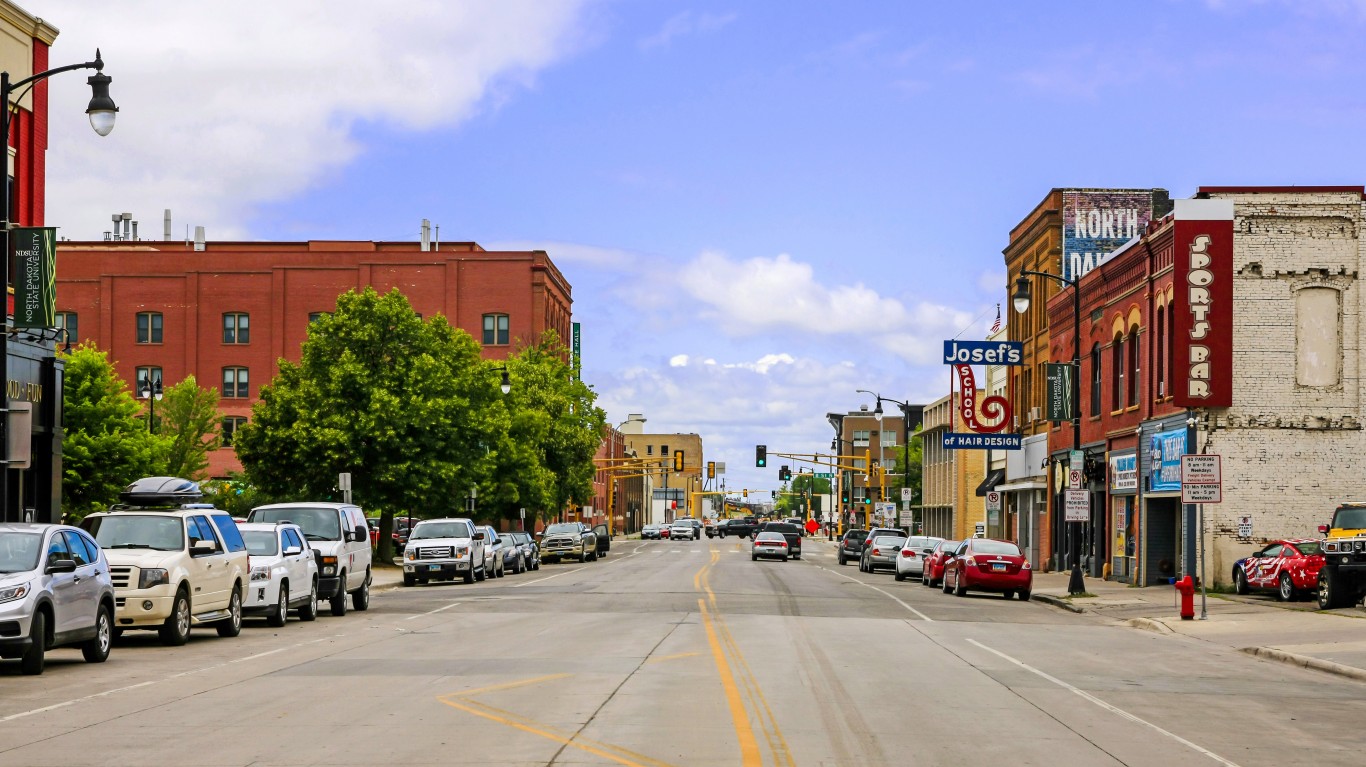
33. North Dakota
> Total COVID-19 deaths in North Dakota: 302 per 100,000 people (total: 2,296)
> Total COVID-19 infections in North Dakota: 33,193 per 100,000 people (total: 252,296)
> 65 and older population: 15.8%
> Total population: 760,077

32. Illinois
> Total COVID-19 deaths in Illinois: 304 per 100,000 people (total: 38,671)
> Total COVID-19 infections in Illinois: 27,273 per 100,000 people (total: 3,474,890)
> 65 and older population: 16.1%
> Total population: 12,741,080

31. Texas
> Total COVID-19 deaths in Texas: 304 per 100,000 people (total: 87,276)
> Total COVID-19 infections in Texas: 25,148 per 100,000 people (total: 7,217,955)
> 65 and older population: 12.9%
> Total population: 28,701,845
These are all the counties in Texas where COVID-19 is slowing (and where it’s still getting worse).

30. Massachusetts
> Total COVID-19 deaths in Massachusetts: 305 per 100,000 people (total: 21,035)
> Total COVID-19 infections in Massachusetts: 28,056 per 100,000 people (total: 1,936,447)
> 65 and older population: 17.0%
> Total population: 6,902,149

29. Iowa
> Total COVID-19 deaths in Iowa: 307 per 100,000 people (total: 9,703)
> Total COVID-19 infections in Iowa: 25,473 per 100,000 people (total: 803,961)
> 65 and older population: 17.5%
> Total population: 3,156,145
These are all the counties in Iowa where COVID-19 is slowing (and where it’s still getting worse).

28. Kansas
> Total COVID-19 deaths in Kansas: 308 per 100,000 people (total: 8,961)
> Total COVID-19 infections in Kansas: 27,901 per 100,000 people (total: 812,329)
> 65 and older population: 16.4%
> Total population: 2,911,510
These are all the counties in Kansas where COVID-19 is slowing (and where it’s still getting worse).

27. Connecticut
> Total COVID-19 deaths in Connecticut: 309 per 100,000 people (total: 11,055)
> Total COVID-19 infections in Connecticut: 23,460 per 100,000 people (total: 838,159)
> 65 and older population: 17.6%
> Total population: 3,572,665

26. Delaware
> Total COVID-19 deaths in Delaware: 310 per 100,000 people (total: 2,998)
> Total COVID-19 infections in Delaware: 29,787 per 100,000 people (total: 288,092)
> 65 and older population: 19.5%
> Total population: 967,171

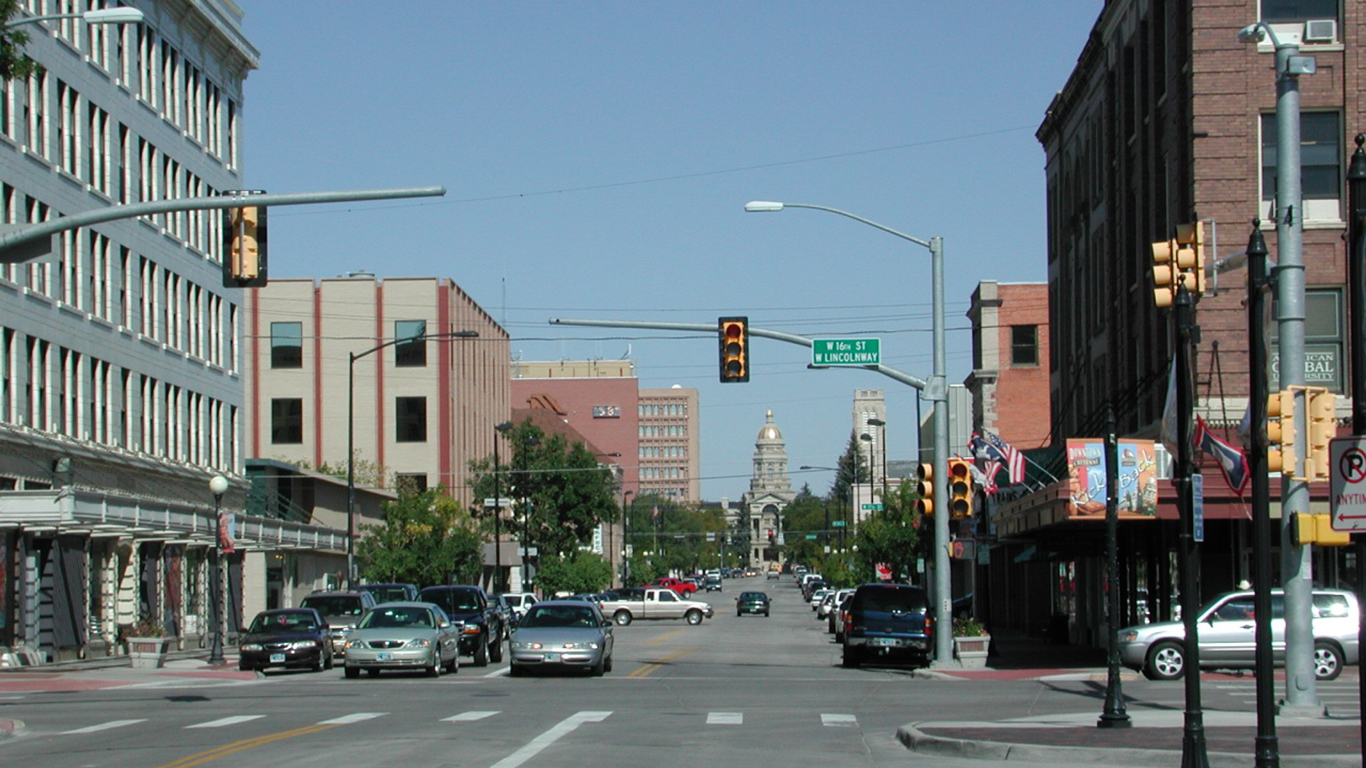
25. Wyoming
> Total COVID-19 deaths in Wyoming: 317 per 100,000 people (total: 1,834)
> Total COVID-19 infections in Wyoming: 28,667 per 100,000 people (total: 165,619)
> 65 and older population: 17.1%
> Total population: 577,737

24. Montana
> Total COVID-19 deaths in Montana: 325 per 100,000 people (total: 3,450)
> Total COVID-19 infections in Montana: 27,237 per 100,000 people (total: 289,345)
> 65 and older population: 19.5%
> Total population: 1,062,305

23. Ohio
> Total COVID-19 deaths in Ohio: 333 per 100,000 people (total: 38,920)
> Total COVID-19 infections in Ohio: 24,529 per 100,000 people (total: 2,867,291)
> 65 and older population: 17.5%
> Total population: 11,689,442
These are all the counties in Ohio where COVID-19 is slowing (and where it’s still getting worse).

22. South Dakota
> Total COVID-19 deaths in South Dakota: 333 per 100,000 people (total: 2,940)
> Total COVID-19 infections in South Dakota: 27,850 per 100,000 people (total: 245,705)
> 65 and older population: 17.4%
> Total population: 882,235

21. Missouri
> Total COVID-19 deaths in Missouri: 340 per 100,000 people (total: 20,814)
> Total COVID-19 infections in Missouri: 24,852 per 100,000 people (total: 1,522,570)
> 65 and older population: 17.2%
> Total population: 6,126,452

20. Rhode Island
> Total COVID-19 deaths in Rhode Island: 342 per 100,000 people (total: 3,615)
> Total COVID-19 infections in Rhode Island: 36,398 per 100,000 people (total: 384,845)
> 65 and older population: 17.7%
> Total population: 1,057,315

19. New York
> Total COVID-19 deaths in New York: 354 per 100,000 people (total: 69,157)
> Total COVID-19 infections in New York: 29,042 per 100,000 people (total: 5,675,542)
> 65 and older population: 16.9%
> Total population: 19,542,209

18. South Carolina
> Total COVID-19 deaths in South Carolina: 355 per 100,000 people (total: 18,055)
> Total COVID-19 infections in South Carolina: 30,951 per 100,000 people (total: 1,573,585)
> 65 and older population: 18.2%
> Total population: 5,084,127

17. Indiana
> Total COVID-19 deaths in Indiana: 358 per 100,000 people (total: 23,962)
> Total COVID-19 infections in Indiana: 26,757 per 100,000 people (total: 1,790,544)
> 65 and older population: 16.1%
> Total population: 6,691,878

16. Pennsylvania
> Total COVID-19 deaths in Pennsylvania: 358 per 100,000 people (total: 45,888)
> Total COVID-19 infections in Pennsylvania: 23,671 per 100,000 people (total: 3,031,550)
> 65 and older population: 18.7%
> Total population: 12,807,060

15. Florida
> Total COVID-19 deaths in Florida: 359 per 100,000 people (total: 76,404)
> Total COVID-19 infections in Florida: 30,998 per 100,000 people (total: 6,602,374)
> 65 and older population: 20.9%
> Total population: 21,299,325

14. Kentucky
> Total COVID-19 deaths in Kentucky: 364 per 100,000 people (total: 16,249)
> Total COVID-19 infections in Kentucky: 31,802 per 100,000 people (total: 1,421,037)
> 65 and older population: 16.9%
> Total population: 4,468,402

13. Nevada
> Total COVID-19 deaths in Nevada: 367 per 100,000 people (total: 11,127)
> Total COVID-19 infections in Nevada: 25,890 per 100,000 people (total: 785,595)
> 65 and older population: 16.2%
> Total population: 3,034,392
These are all the counties in Nevada where COVID-19 is slowing (and where it’s still getting worse).

12. Oklahoma
> Total COVID-19 deaths in Oklahoma: 367 per 100,000 people (total: 14,473)
> Total COVID-19 infections in Oklahoma: 27,713 per 100,000 people (total: 1,092,763)
> 65 and older population: 16.1%
> Total population: 3,943,079

11. Georgia
> Total COVID-19 deaths in Georgia: 368 per 100,000 people (total: 38,685)
> Total COVID-19 infections in Georgia: 25,358 per 100,000 people (total: 2,667,557)
> 65 and older population: 14.3%
> Total population: 10,519,475

10. Michigan
> Total COVID-19 deaths in Michigan: 370 per 100,000 people (total: 36,982)
> Total COVID-19 infections in Michigan: 26,206 per 100,000 people (total: 2,619,533)
> 65 and older population: 17.7%
> Total population: 9,995,915

9. Louisiana
> Total COVID-19 deaths in Louisiana: 374 per 100,000 people (total: 17,437)
> Total COVID-19 infections in Louisiana: 26,813 per 100,000 people (total: 1,249,458)
> 65 and older population: 16.0%
> Total population: 4,659,978

8. New Mexico
> Total COVID-19 deaths in New Mexico: 380 per 100,000 people (total: 7,972)
> Total COVID-19 infections in New Mexico: 27,361 per 100,000 people (total: 573,339)
> 65 and older population: 18.0%
> Total population: 2,095,428

7. New Jersey
> Total COVID-19 deaths in New Jersey: 383 per 100,000 people (total: 34,112)
> Total COVID-19 infections in New Jersey: 28,317 per 100,000 people (total: 2,522,649)
> 65 and older population: 16.6%
> Total population: 8,908,520

6. Arkansas
> Total COVID-19 deaths in Arkansas: 385 per 100,000 people (total: 11,608)
> Total COVID-19 infections in Arkansas: 29,134 per 100,000 people (total: 878,058)
> 65 and older population: 17.4%
> Total population: 3,013,825

5. West Virginia
> Total COVID-19 deaths in West Virginia: 393 per 100,000 people (total: 7,091)
> Total COVID-19 infections in West Virginia: 29,872 per 100,000 people (total: 539,431)
> 65 and older population: 20.5%
> Total population: 1,805,832

4. Tennessee
> Total COVID-19 deaths in Tennessee: 396 per 100,000 people (total: 26,780)
> Total COVID-19 infections in Tennessee: 31,751 per 100,000 people (total: 2,149,540)
> 65 and older population: 16.7%
> Total population: 6,770,010

3. Alabama
> Total COVID-19 deaths in Alabama: 405 per 100,000 people (total: 19,804)
> Total COVID-19 infections in Alabama: 28,277 per 100,000 people (total: 1,382,137)
> 65 and older population: 17.4%
> Total population: 4,887,871

2. Mississippi
> Total COVID-19 deaths in Mississippi: 420 per 100,000 people (total: 12,546)
> Total COVID-19 infections in Mississippi: 28,424 per 100,000 people (total: 848,886)
> 65 and older population: 16.4%
> Total population: 2,986,530

1. Arizona
> Total COVID-19 deaths in Arizona: 426 per 100,000 people (total: 30,572)
> Total COVID-19 infections in Arizona: 29,920 per 100,000 people (total: 2,145,765)
> 65 and older population: 18.0%
> Total population: 7,171,646
Choosing the right (or wrong) time to claim Social Security can dramatically change your retirement. So, before making one of the biggest decisions of your financial life, it’s a smart idea to get an extra set of eyes on your complete financial situation.
A financial advisor can help you decide the right Social Security option for you and your family. Finding a qualified financial advisor doesn’t have to be hard. SmartAsset’s free tool matches you with up to three financial advisors who serve your area, and you can interview your advisor matches at no cost to decide which one is right for you.
Click here to match with up to 3 financial pros who would be excited to help you optimize your Social Security outcomes.
Have questions about retirement or personal finance? Email us at [email protected]!
By emailing your questions to 24/7 Wall St., you agree to have them published anonymously on a673b.bigscoots-temp.com.
By submitting your story, you understand and agree that we may use your story, or versions of it, in all media and platforms, including via third parties.
Thank you for reading! Have some feedback for us?
Contact the 24/7 Wall St. editorial team.