Many of the leading causes of premature death in the U.S. are related to lifestyle, among them poor diet and lack of adequate physical activity, both of which contribute to obesity and other morbidities. (The Centers for Disease Control and Prevention estimates the U.S. adult obesity rate to be nearly 42%, up from about 31% in 1999.)
Poor diet and lack of adequate exercise are leading causes of heart disease, stroke, type 2 diabetes, and some cancers. A balanced diet heavy with vegetables and light on sugars and foods containing fats that solidify at room temperature – like red meat, baked shelf-stable confections, and fried food – is crucial to preventing or mitigating these health conditions. So is regular physical activity.
To determine the least physically active cities in America, 24/7 Tempo created an index consisting of the share of adults who are physically active and the percentage of the population with access to places for physical activity in all 384 U.S. metro areas. Both measures came from the 2021 County Health Rankings & Roadmaps, a collaboration between the Robert Wood Johnson Foundation and the University of Wisconsin Population Health Institute. (In contrast, these are the 50 most physically active cities in America.)
Of the 50 cities on our list, there are six each in Texas, Georgia, and West Virginia. The two least physically active cities – Pine Bluff, Arkansas, and Texarkana, a metropolitan area on the border with Texas and Arkansas – are also those with the highest rates of obesity. More than 42% of adults in these cities are obese. Four other cities have an obesity rate of at least 40%. Of all the cities on this list, only Jacksonville, North Carolina, has an adult obesity rate that’s below 30%. (Here’s a list of the most obese metro area in every state.)
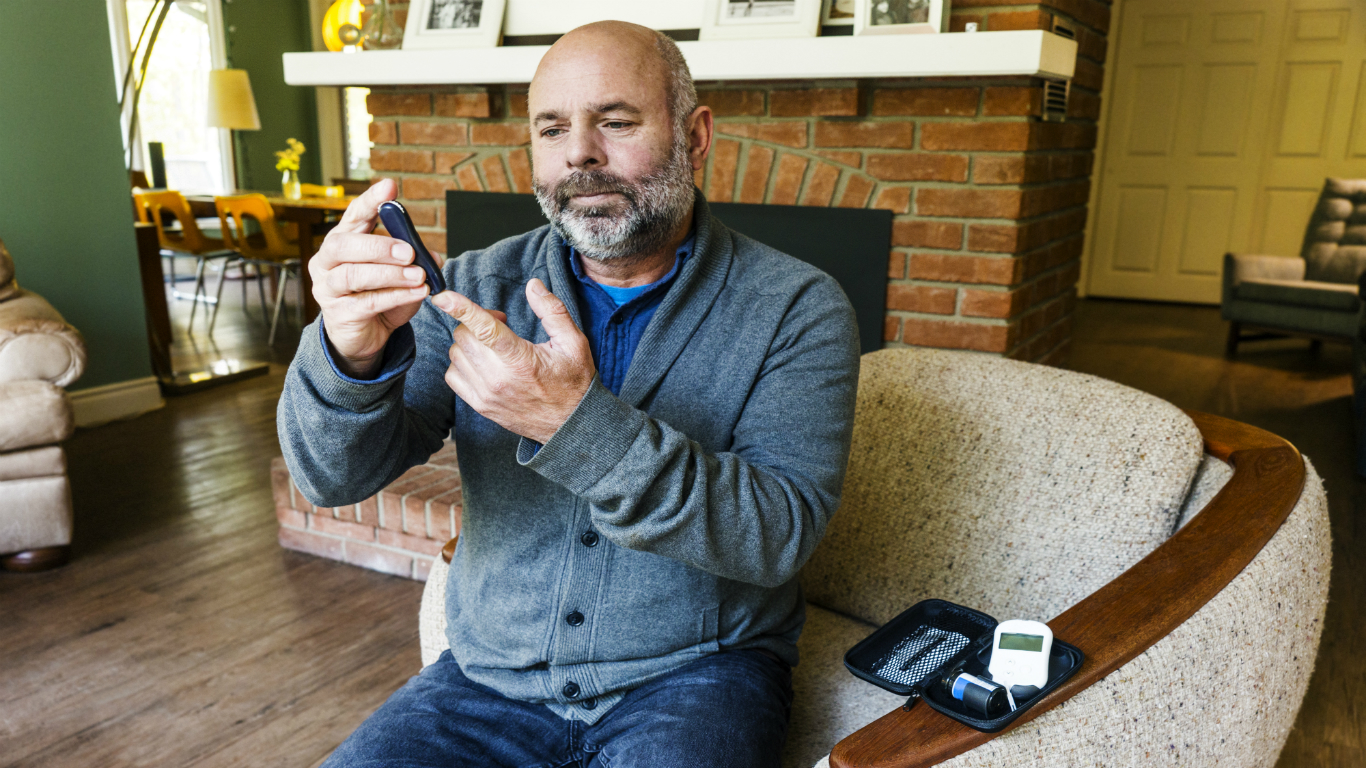
In most of these cities, more than one in ten adults has diabetes, led by 19% in Macon-Bibb, Georgia. Among all 50 cities, only Bowling Green, Kentucky, and Jacksonville, North Carolina, have adult diabetes rates below 10%. (Here are 10 warning signs you might have diabetes.)
The percentage of the population in these cities that has access to places for physical activity like nearby parks and gyms ranges from 44% in the metropolitan statistical area of Hanford-Corcoran, California, to 69% in Albany, Georgia.
Click here to see the least physically active cities in America
At least 20% of local adults in these 50 MSAs don’t exercise at all; in Sherman-Denison, Texas, the rate is 35% – the highest.
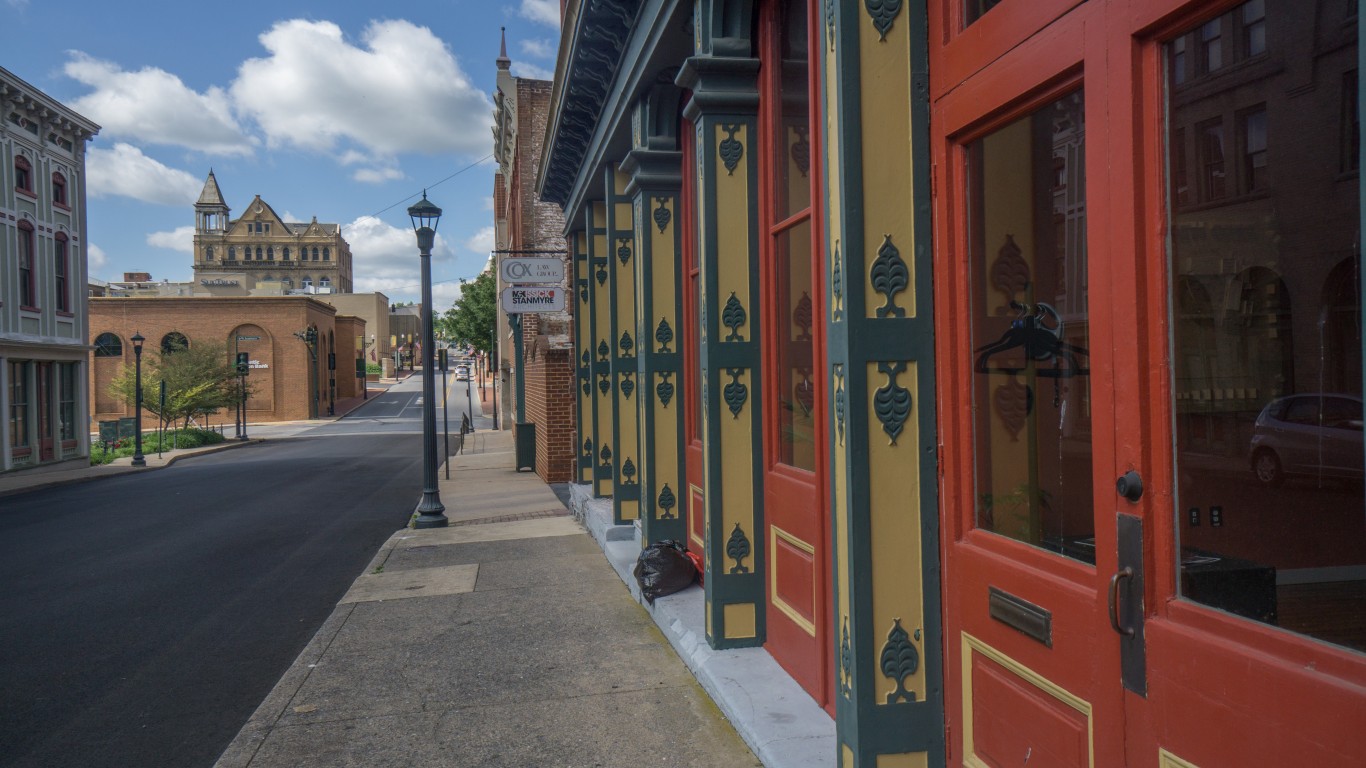
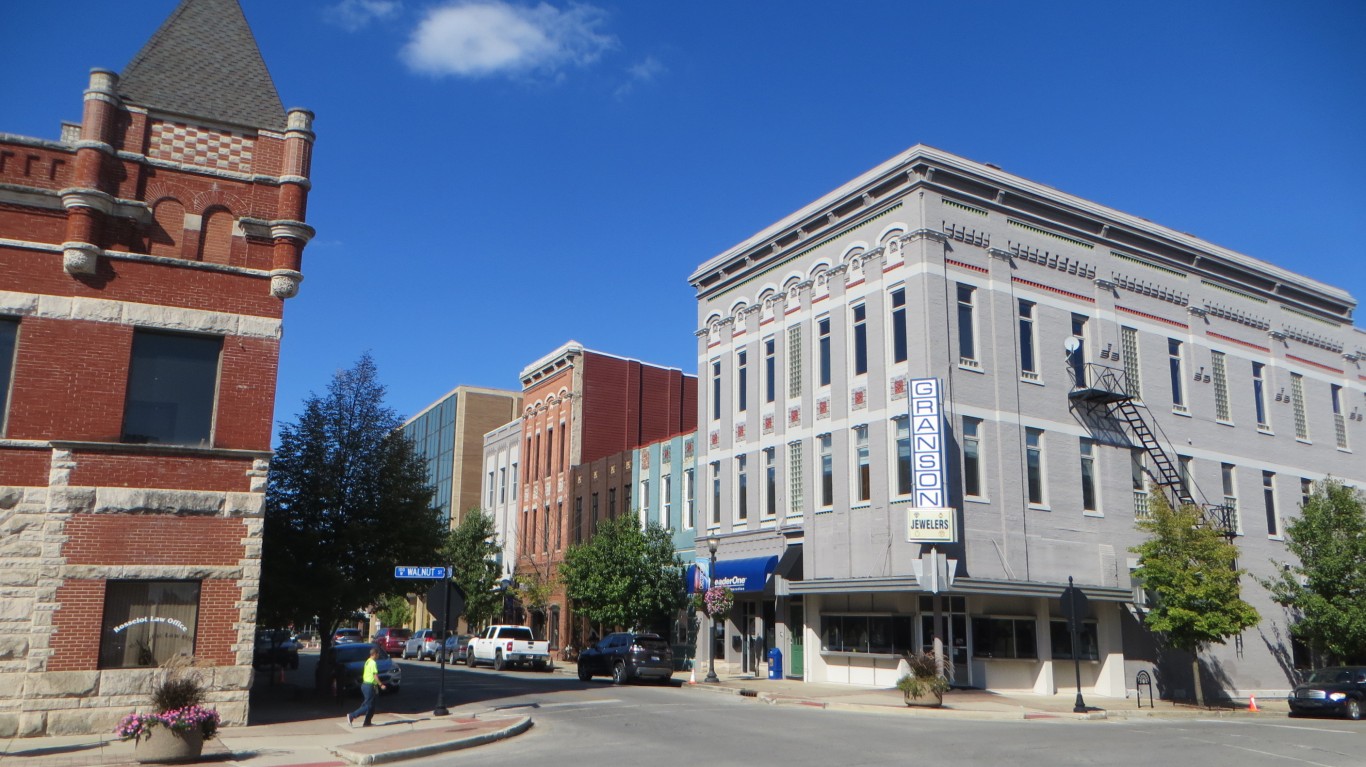
50. Staunton, VA
> Adults who don’t exercise: 26.47% (#116 highest of 384 MSAs)
> Pop. with access to places for physical activity: 63.57% (#346 highest of 384 MSAs)
> Adult obesity rate: 32.58% (#170)
> Pop. over 20 with diabetes: 15.59% (#44,420)
> Adults in poor or fair health: 17.44% (#122)
> Median household income: $73,822 (#188)
[in-text-ad]

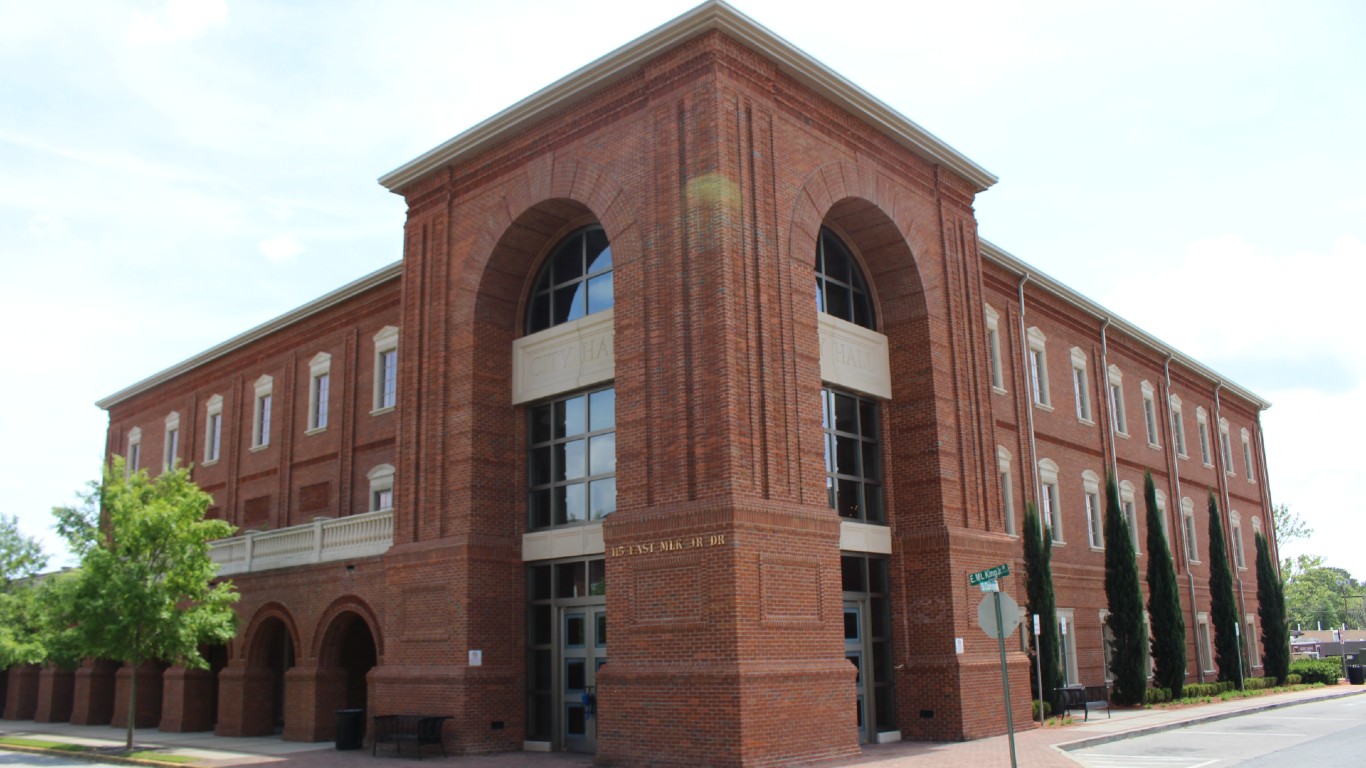
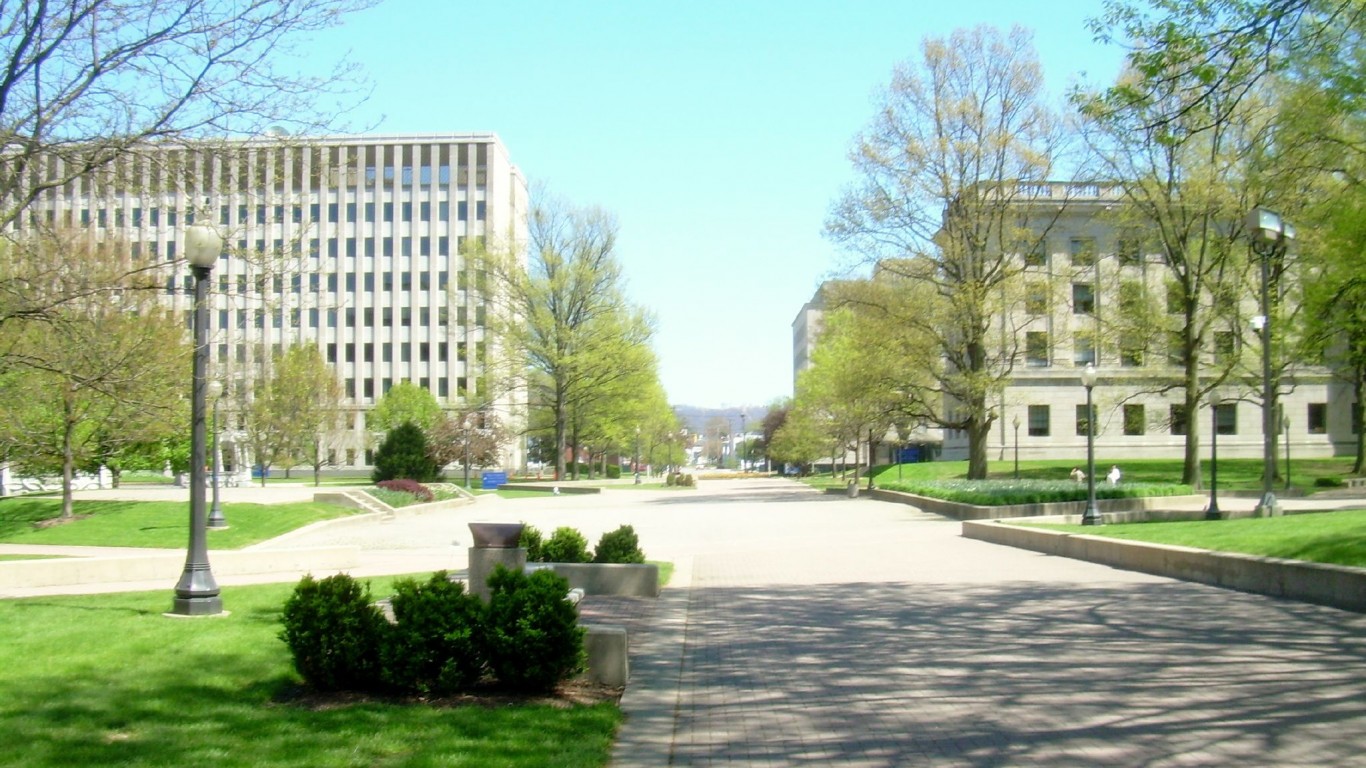
49. Albany, GA
> Adults who don’t exercise: 32.09% (#20 highest of 384 MSAs)
> Pop. with access to places for physical activity: 68.96% (#312 highest of 384 MSAs)
> Adult obesity rate: 39.71% (#11)
> Pop. over 20 with diabetes: 17.16% (#10,500)
> Adults in poor or fair health: 24.21% (#17)
> Median household income: $56,166 (#372)
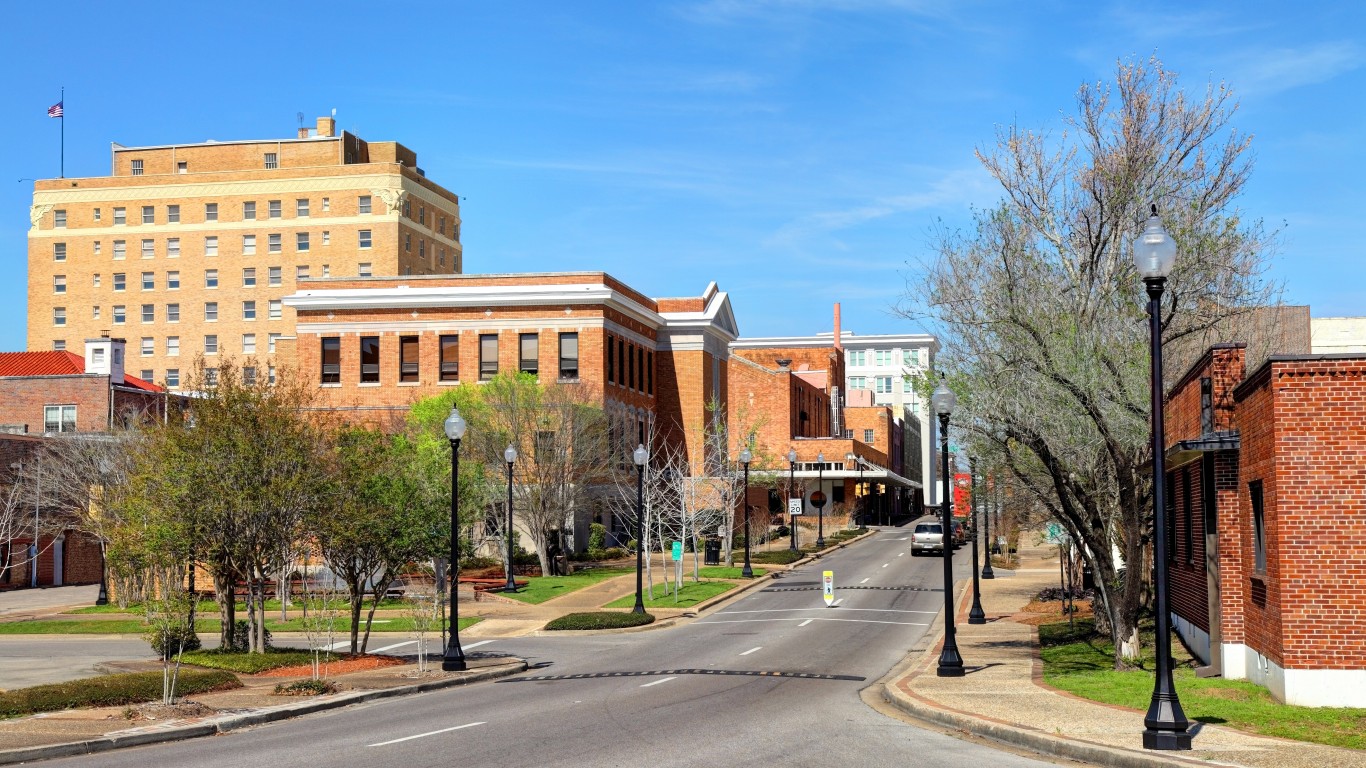
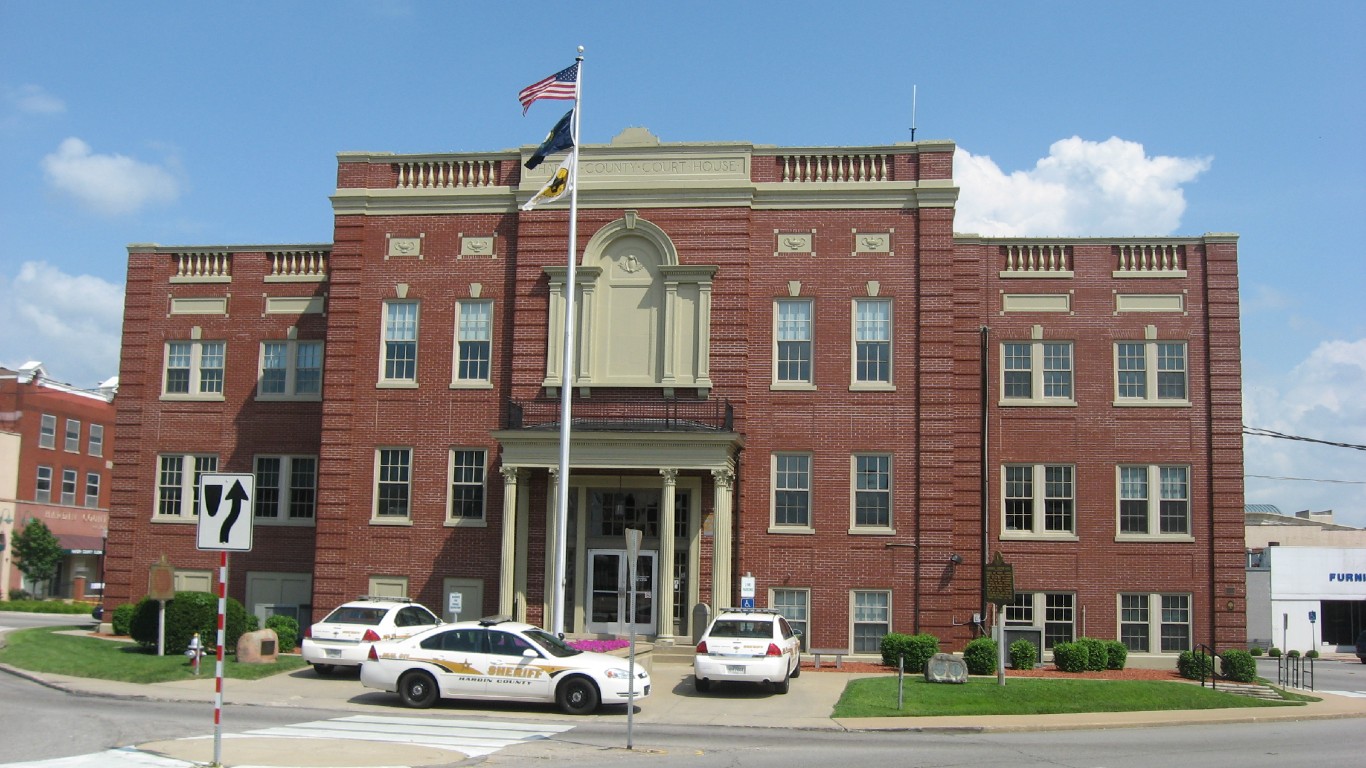
48. Hattiesburg, MS
> Adults who don’t exercise: 27.40% (#99 highest of 384 MSAs)
> Pop. with access to places for physical activity: 64.11% (#343 highest of 384 MSAs)
> Adult obesity rate: 35.48% (#88)
> Pop. over 20 with diabetes: 12.07% (#25,620)
> Adults in poor or fair health: 20.94% (#32)
> Median household income: $58,430 (#359)

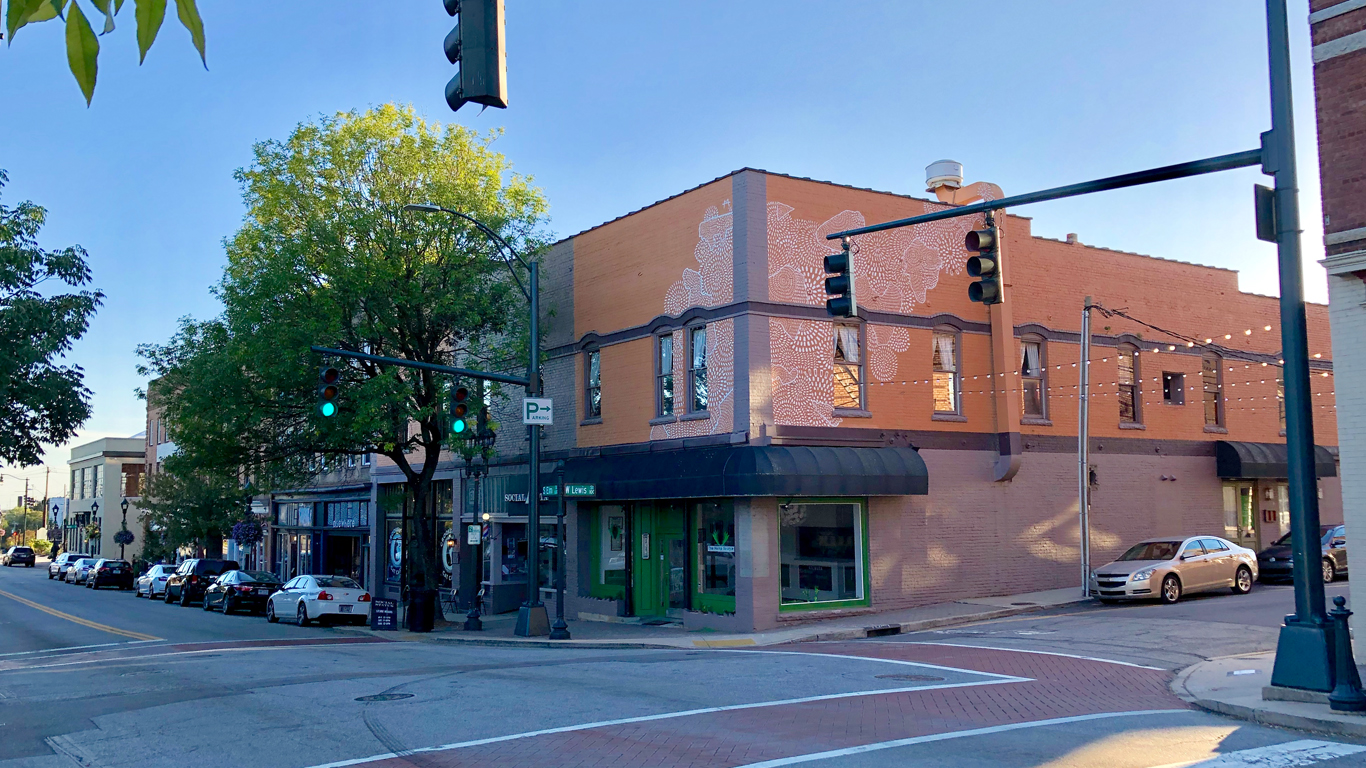
47. Parkersburg-Vienna, WV
> Adults who don’t exercise: 30.32% (#43 highest of 384 MSAs)
> Pop. with access to places for physical activity: 66.89% (#324 highest of 384 MSAs)
> Adult obesity rate: 39.38% (#19)
> Pop. over 20 with diabetes: 17.78% (#37,620)
> Adults in poor or fair health: 23.09% (#21)
> Median household income: $61,708 (#334)
[in-text-ad-2]

46. Hickory-Lenoir-Morganton, NC
> Adults who don’t exercise: 27.07% (#103 highest of 384 MSAs)
> Pop. with access to places for physical activity: 63.21% (#349 highest of 384 MSAs)
> Adult obesity rate: 35.01% (#100)
> Pop. over 20 with diabetes: 13.03% (#25,860)
> Adults in poor or fair health: 20.54% (#36)
> Median household income: $60,878 (#347)

45. Jackson, MS
> Adults who don’t exercise: 29.18% (#59 highest of 384 MSAs)
> Pop. with access to places for physical activity: 65.14% (#339 highest of 384 MSAs)
> Adult obesity rate: 40.08% (#10)
> Pop. over 20 with diabetes: 12.48% (#27,140)
> Adults in poor or fair health: 21.38% (#44)
> Median household income: $67,202 (#276)
[in-text-ad]

44. Dover, DE
> Adults who don’t exercise: 30.90% (#38 highest of 384 MSAs)
> Pop. with access to places for physical activity: 66.84% (#326 highest of 384 MSAs)
> Adult obesity rate: 38.40% (#29)
> Pop. over 20 with diabetes: 13.90% (#20,100)
> Adults in poor or fair health: 21.02% (#63)
> Median household income: $70,383 (#239)
43. Panama City, FL
> Adults who don’t exercise: 31.08% (#36 highest of 384 MSAs)
> Pop. with access to places for physical activity: 66.88% (#325 highest of 384 MSAs)
> Adult obesity rate: 30.23% (#251)
> Pop. over 20 with diabetes: 12.10% (#37,460)
> Adults in poor or fair health: 21.29% (#58)
> Median household income: $68,575 (#258)
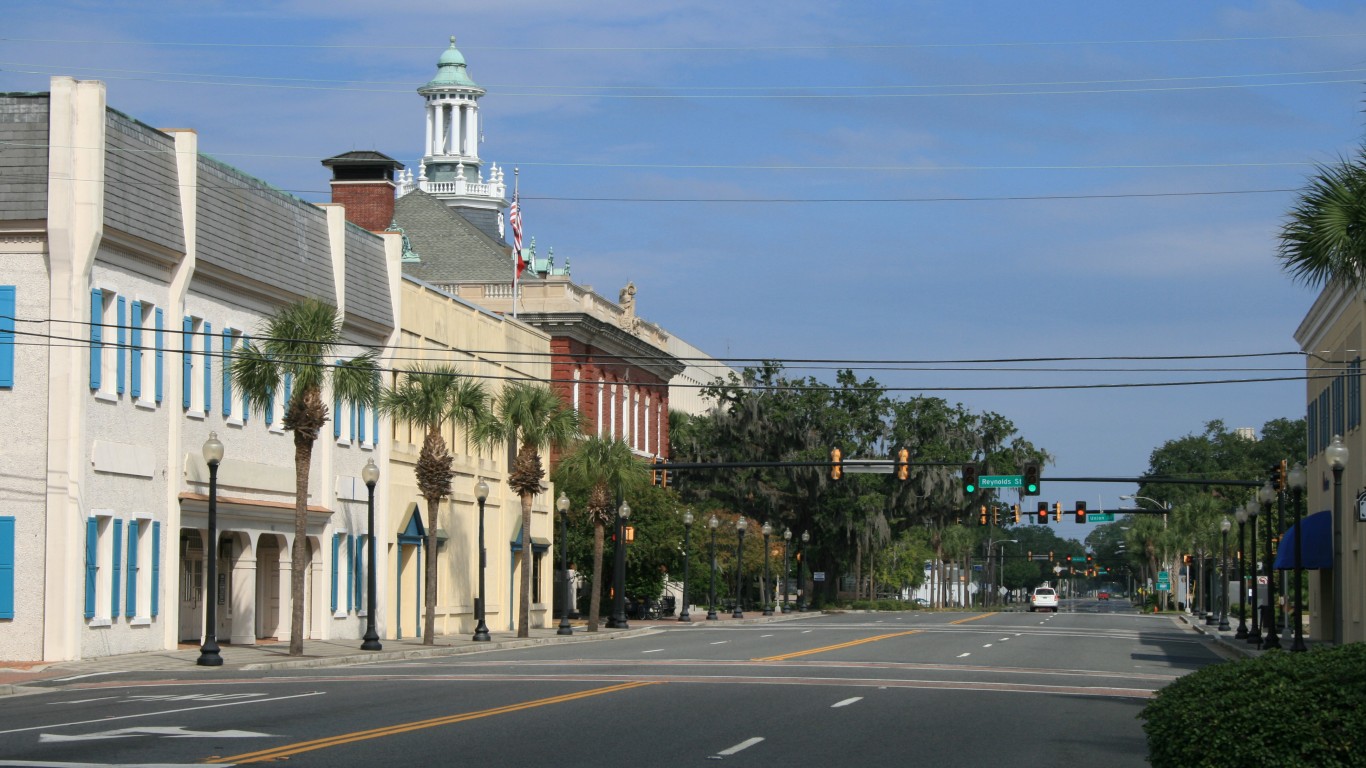
42. Brunswick, GA
> Adults who don’t exercise: 30.19% (#45 highest of 384 MSAs)
> Pop. with access to places for physical activity: 65.70% (#336 highest of 384 MSAs)
> Adult obesity rate: 32.09% (#185)
> Pop. over 20 with diabetes: 11.11% (#15,260)
> Adults in poor or fair health: 19.49% (#110)
> Median household income: $68,432 (#261)
[in-text-ad-2]
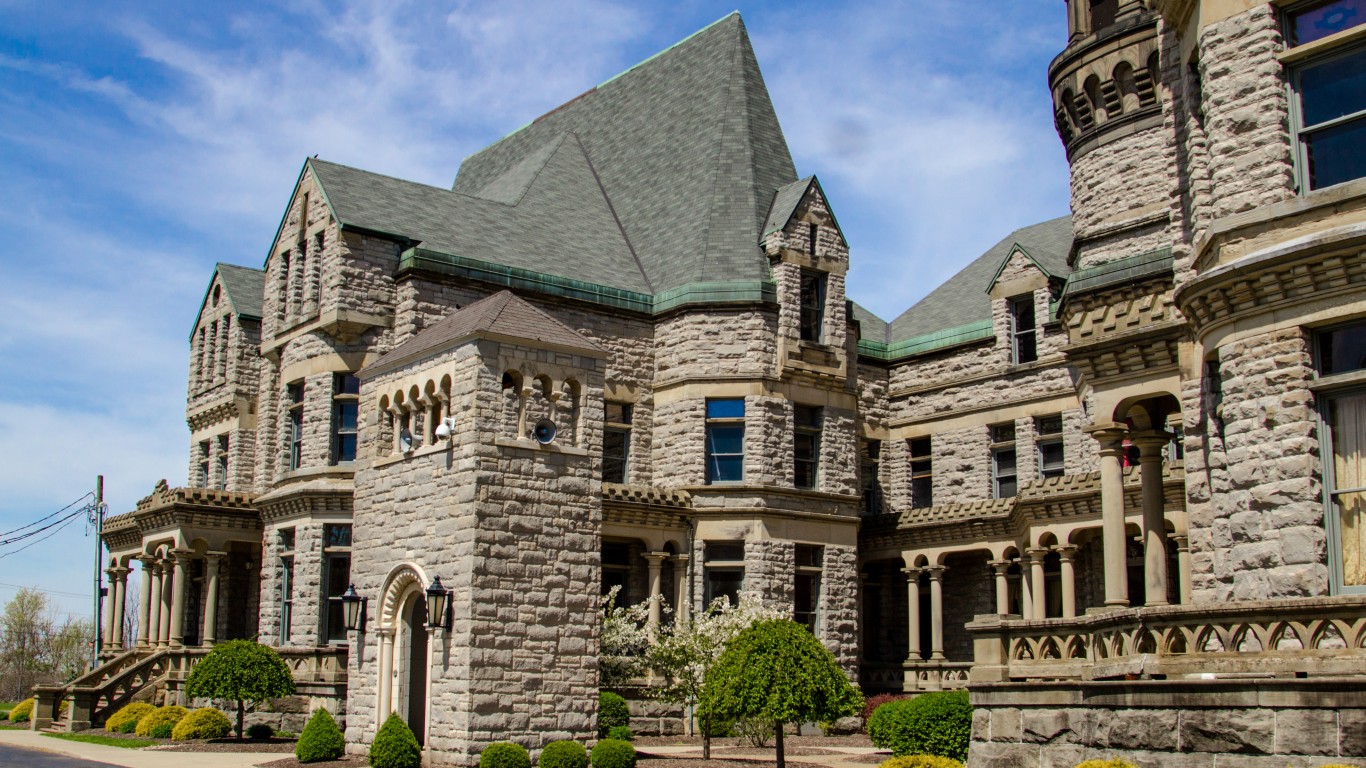
41. Mansfield, OH
> Adults who don’t exercise: 32.00% (#25 highest of 384 MSAs)
> Pop. with access to places for physical activity: 67.31% (#323 highest of 384 MSAs)
> Adult obesity rate: 35.60% (#85)
> Pop. over 20 with diabetes: 14.20% (#31,900)
> Adults in poor or fair health: 20.60% (#87)
> Median household income: $63,284 (#317)
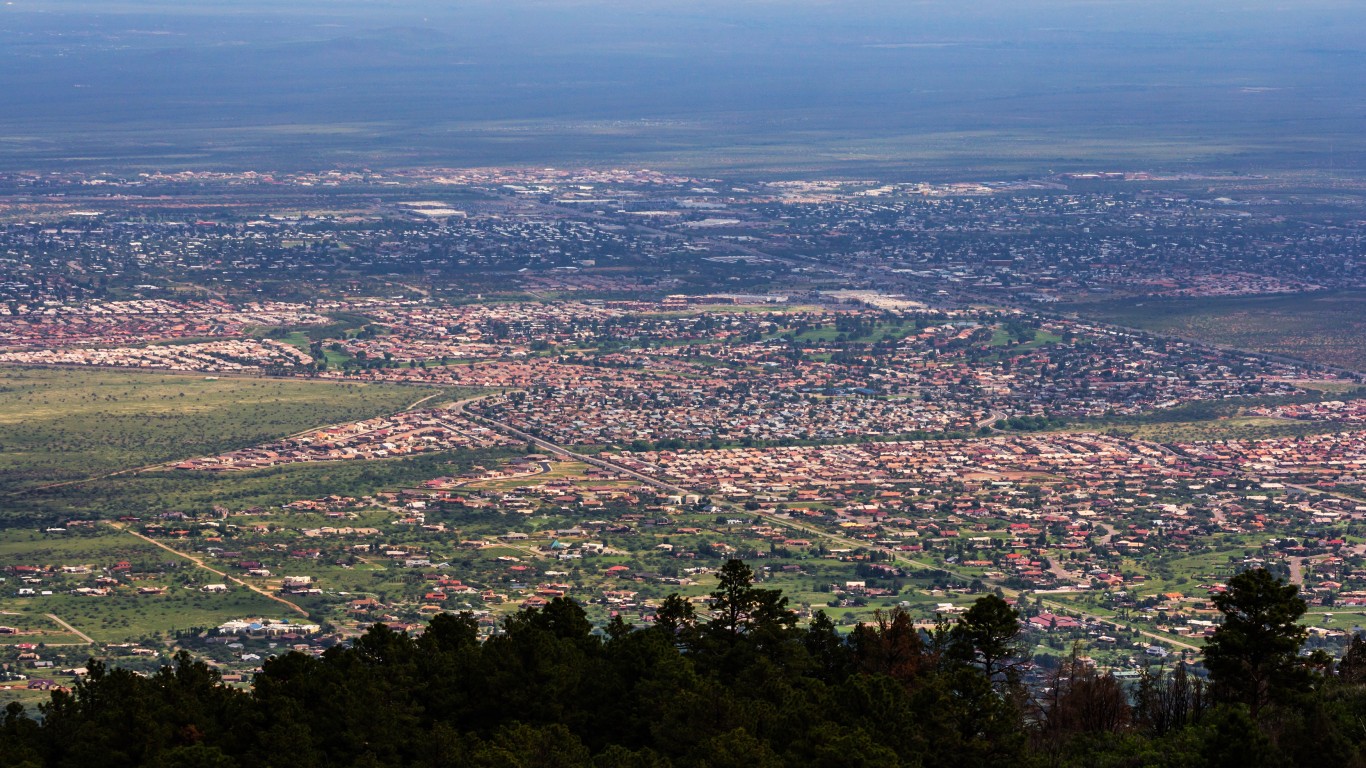
40. Sierra Vista-Douglas, AZ
> Adults who don’t exercise: 24.40% (#173 highest of 384 MSAs)
> Pop. with access to places for physical activity: 59.67% (#362 highest of 384 MSAs)
> Adult obesity rate: 30.90% (#234)
> Pop. over 20 with diabetes: 10.30% (#43,420)
> Adults in poor or fair health: 19.98% (#27)
> Median household income: $64,128 (#310)
[in-text-ad]
39. Longview, TX
> Adults who don’t exercise: 26.18% (#122 highest of 384 MSAs)
> Pop. with access to places for physical activity: 61.37% (#358 highest of 384 MSAs)
> Adult obesity rate: 35.17% (#94)
> Pop. over 20 with diabetes: 11.84% (#30,980)
> Adults in poor or fair health: 22.16% (#15)
> Median household income: $64,818 (#305)
38. Charleston, WV
> Adults who don’t exercise: 26.71% (#110 highest of 384 MSAs)
> Pop. with access to places for physical activity: 61.83% (#356 highest of 384 MSAs)
> Adult obesity rate: 38.28% (#32)
> Pop. over 20 with diabetes: 16.29% (#16,620)
> Adults in poor or fair health: 22.92% (#15)
> Median household income: $60,682 (#349)
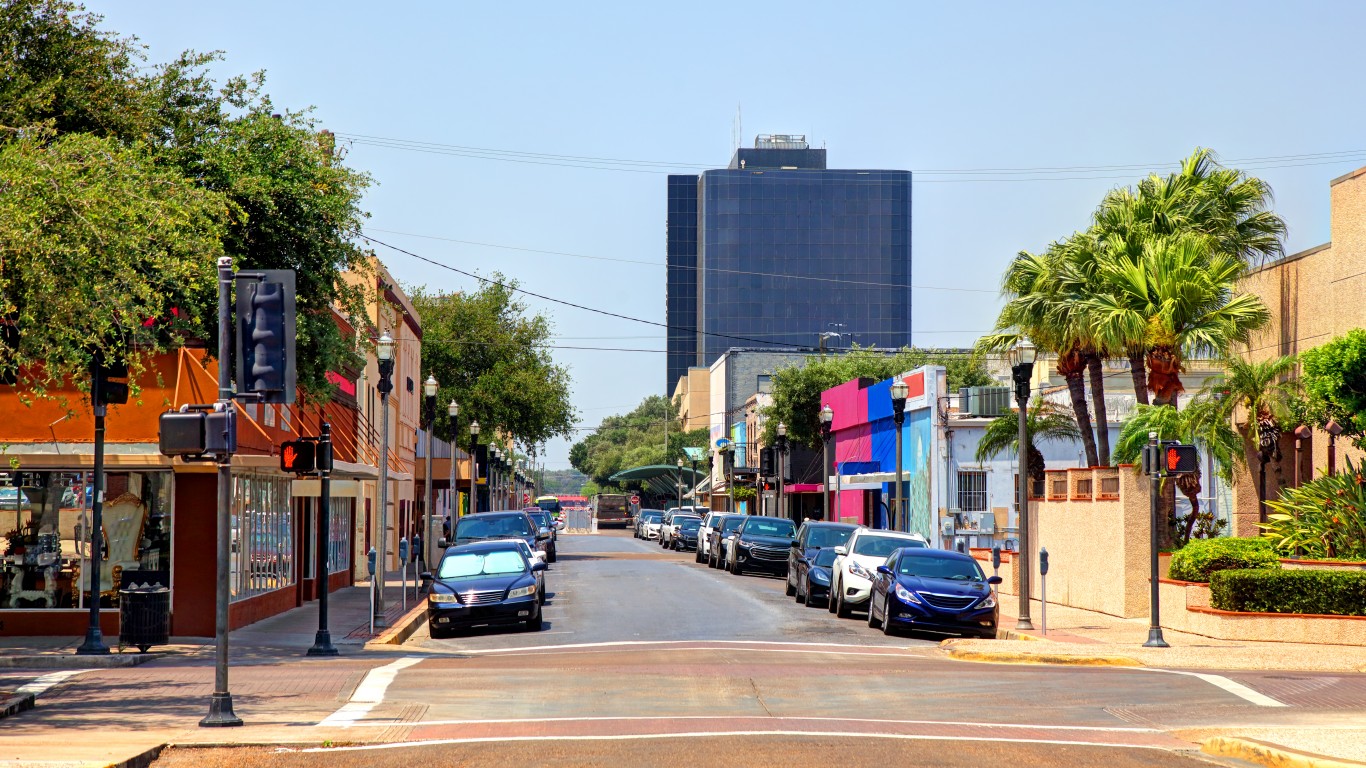
37. McAllen-Edinburg-Mission, TX
> Adults who don’t exercise: 24.40% (#172 highest of 384 MSAs)
> Pop. with access to places for physical activity: 59.30% (#364 highest of 384 MSAs)
> Adult obesity rate: 38.20% (#33)
> Pop. over 20 with diabetes: 11.10% (#32,580)
> Adults in poor or fair health: 33.12% (#1)
> Median household income: $46,609 (#384 MSAs)
[in-text-ad-2]
36. Hammond, LA
> Adults who don’t exercise: 33.10% (#11 highest of 384 MSAs)
> Pop. with access to places for physical activity: 67.89% (#317 highest of 384 MSAs)
> Adult obesity rate: 40.30% (#8)
> Pop. over 20 with diabetes: 11.70% (#25,220)
> Adults in poor or fair health: 23.11% (#34)
> Median household income: $62,373 (#328)
35. Huntington-Ashland, WV-KY-OH
> Adults who don’t exercise: 31.27% (#33 highest of 384 MSAs)
> Pop. with access to places for physical activity: 66.02% (#335 highest of 384 MSAs)
> Adult obesity rate: 39.59% (#17)
> Pop. over 20 with diabetes: 15.53% (#26,580)
> Adults in poor or fair health: 23.23% (#25)
> Median household income: $61,976 (#332)
[in-text-ad]
34. Watertown-FortDrum, NY
> Adults who don’t exercise: 25.10% (#146 highest of 384 MSAs)
> Pop. with access to places for physical activity: 59.83% (#361 highest of 384 MSAs)
> Adult obesity rate: 36.00% (#77)
> Pop. over 20 with diabetes: 10.90% (#48,060)
> Adults in poor or fair health: 17.27% (#103)
> Median household income: $66,711 (#283)

33. Macon-Bibb County, GA
> Adults who don’t exercise: 32.06% (#21 highest of 384 MSAs)
> Pop. with access to places for physical activity: 66.73% (#328 highest of 384 MSAs)
> Adult obesity rate: 38.47% (#28)
> Pop. over 20 with diabetes: 18.61% (#31,420)
> Adults in poor or fair health: 22.16% (#48)
> Median household income: $62,540 (#326)
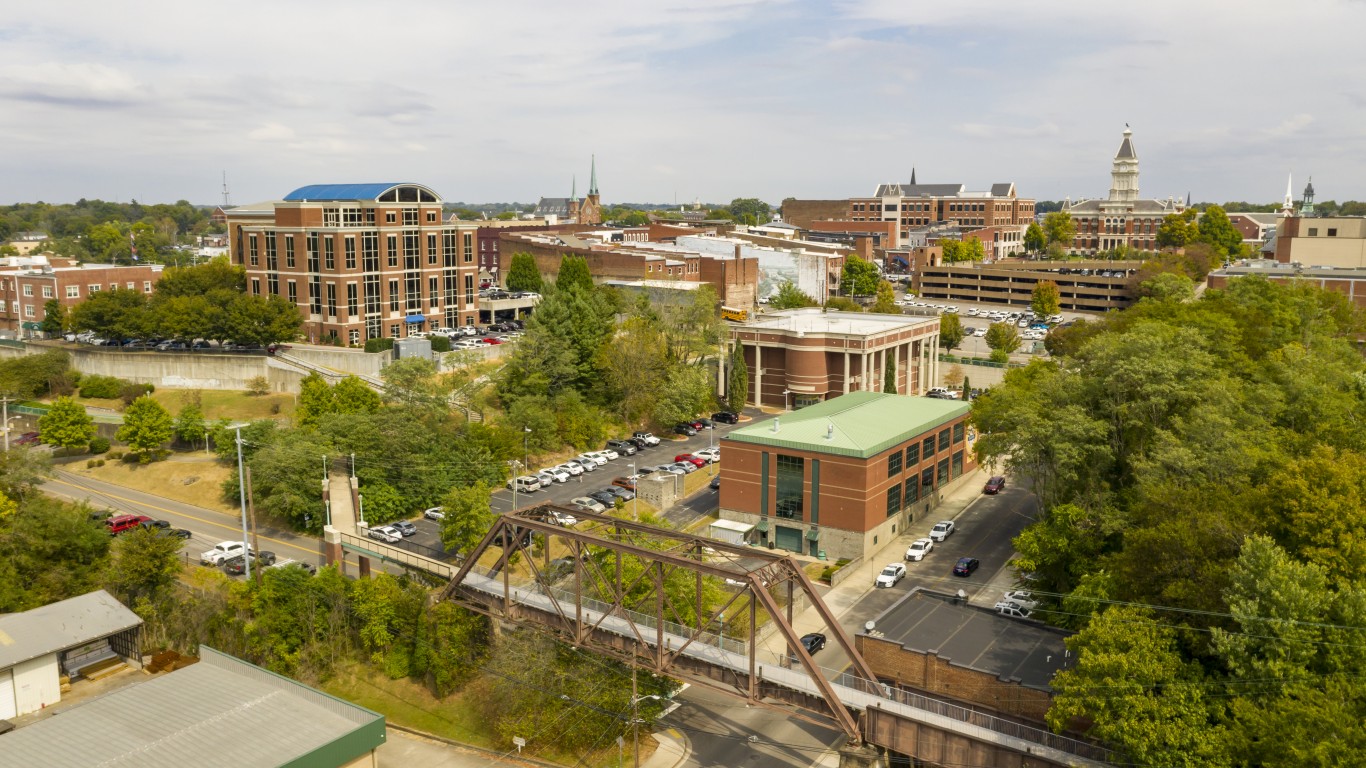
32. Clarksville, TN-KY
> Adults who don’t exercise: 27.46% (#97 highest of 384 MSAs)
> Pop. with access to places for physical activity: 62.11% (#353 highest of 384 MSAs)
> Adult obesity rate: 36.28% (#71)
> Pop. over 20 with diabetes: 12.39% (#17,300)
> Adults in poor or fair health: 22.32% (#19)
> Median household income: $65,849 (#290)
[in-text-ad-2]
31. Kokomo, IN
> Adults who don’t exercise: 34.10% (#6 highest of 384 MSAs)
> Pop. with access to places for physical activity: 68.59% (#314 highest of 384 MSAs)
> Adult obesity rate: 35.20% (#93)
> Pop. over 20 with diabetes: 14.80% (#29,020)
> Adults in poor or fair health: 20.20% (#117)
> Median household income: $69,896 (#244)
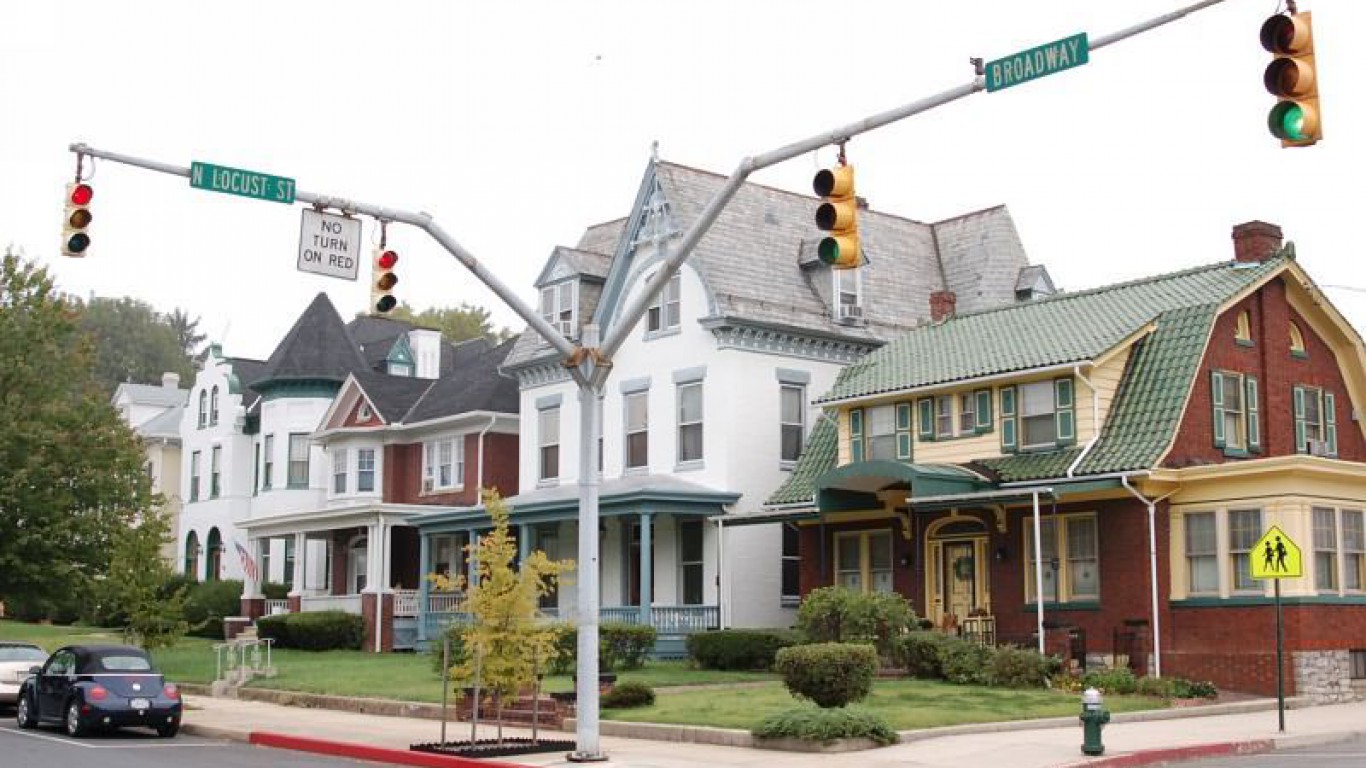
30. Hagerstown-Martinsburg, MD-WV
> Adults who don’t exercise: 27.60% (#93 highest of 384 MSAs)
> Pop. with access to places for physical activity: 61.90% (#354 highest of 384 MSAs)
> Adult obesity rate: 37.63% (#43)
> Pop. over 20 with diabetes: 13.64% (#25,180)
> Adults in poor or fair health: 19.31% (#81)
> Median household income: $77,963 (#140)
[in-text-ad]
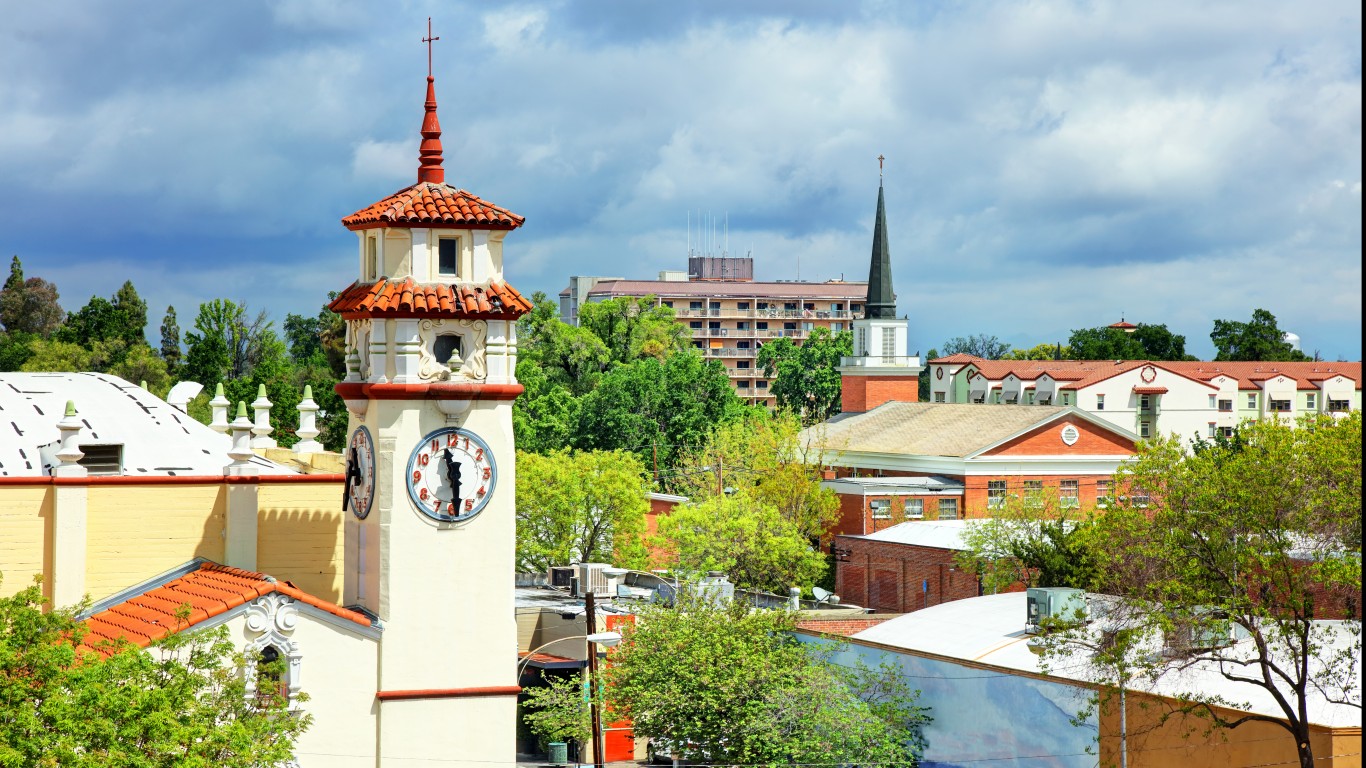
29. Visalia, CA
> Adults who don’t exercise: 26.30% (#119 highest of 384 MSAs)
> Pop. with access to places for physical activity: 60.32% (#360 highest of 384 MSAs)
> Adult obesity rate: 37.20% (#52)
> Pop. over 20 with diabetes: 10.90% (#47,300)
> Adults in poor or fair health: 28.03% (#3)
> Median household income: $55,395 (#373)
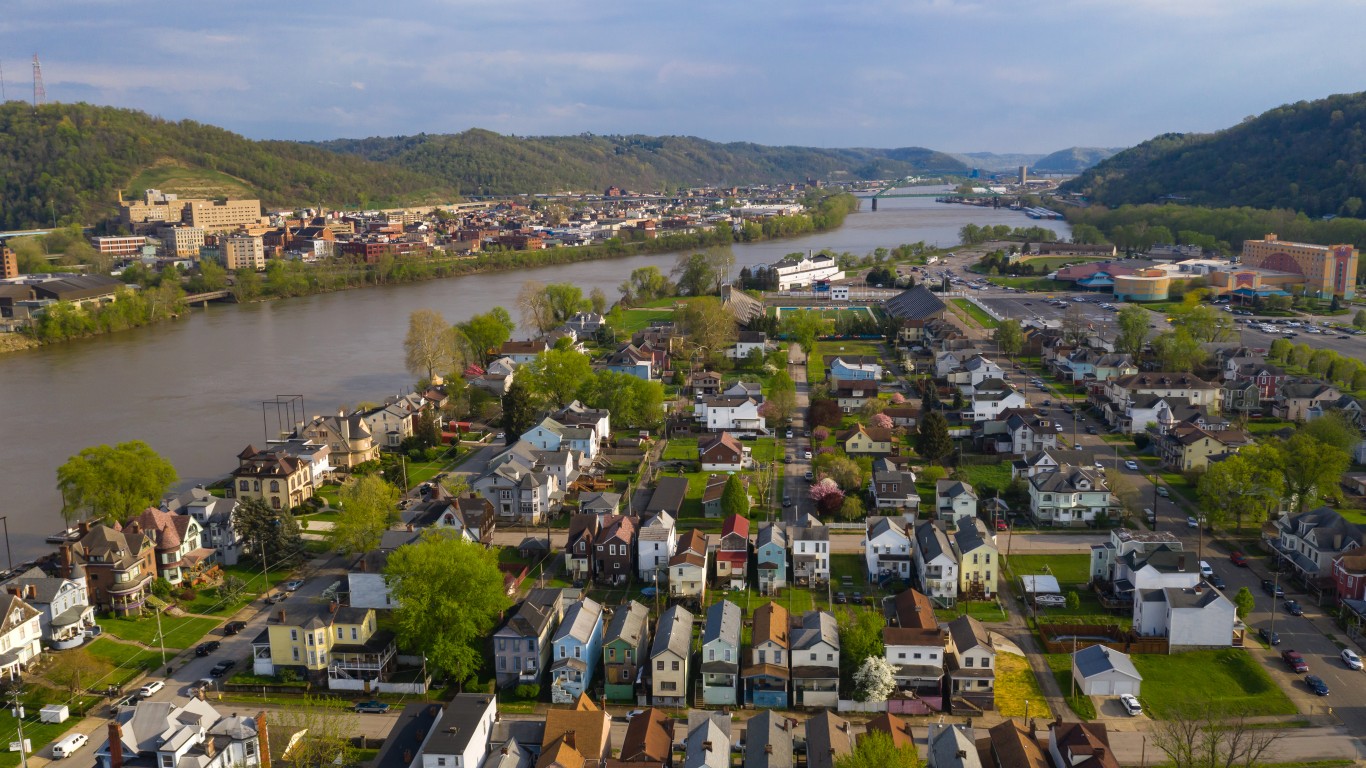
28. Wheeling, WV-OH
> Adults who don’t exercise: 28.34% (#77 highest of 384 MSAs)
> Pop. with access to places for physical activity: 62.23% (#352 highest of 384 MSAs)
> Adult obesity rate: 35.61% (#84)
> Pop. over 20 with diabetes: 14.62% (#48,540)
> Adults in poor or fair health: 19.90% (#70)
> Median household income: $65,607 (#295)
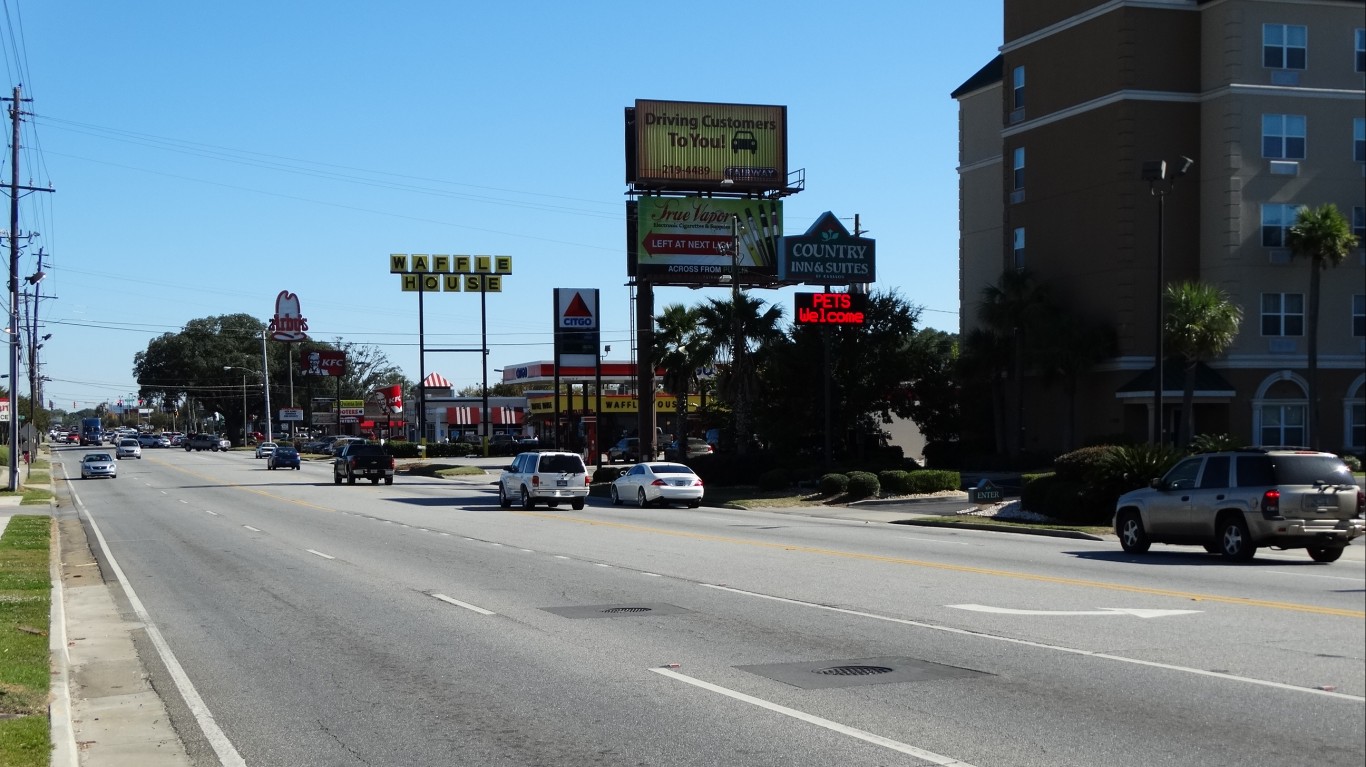
27. Valdosta, GA
> Adults who don’t exercise: 30.37% (#42 highest of 384 MSAs)
> Pop. with access to places for physical activity: 63.58% (#345 highest of 384 MSAs)
> Adult obesity rate: 34.74% (#110)
> Pop. over 20 with diabetes: 16.76% (#46,660)
> Adults in poor or fair health: 22.42% (#28)
> Median household income: $59,281 (#356)
[in-text-ad-2]
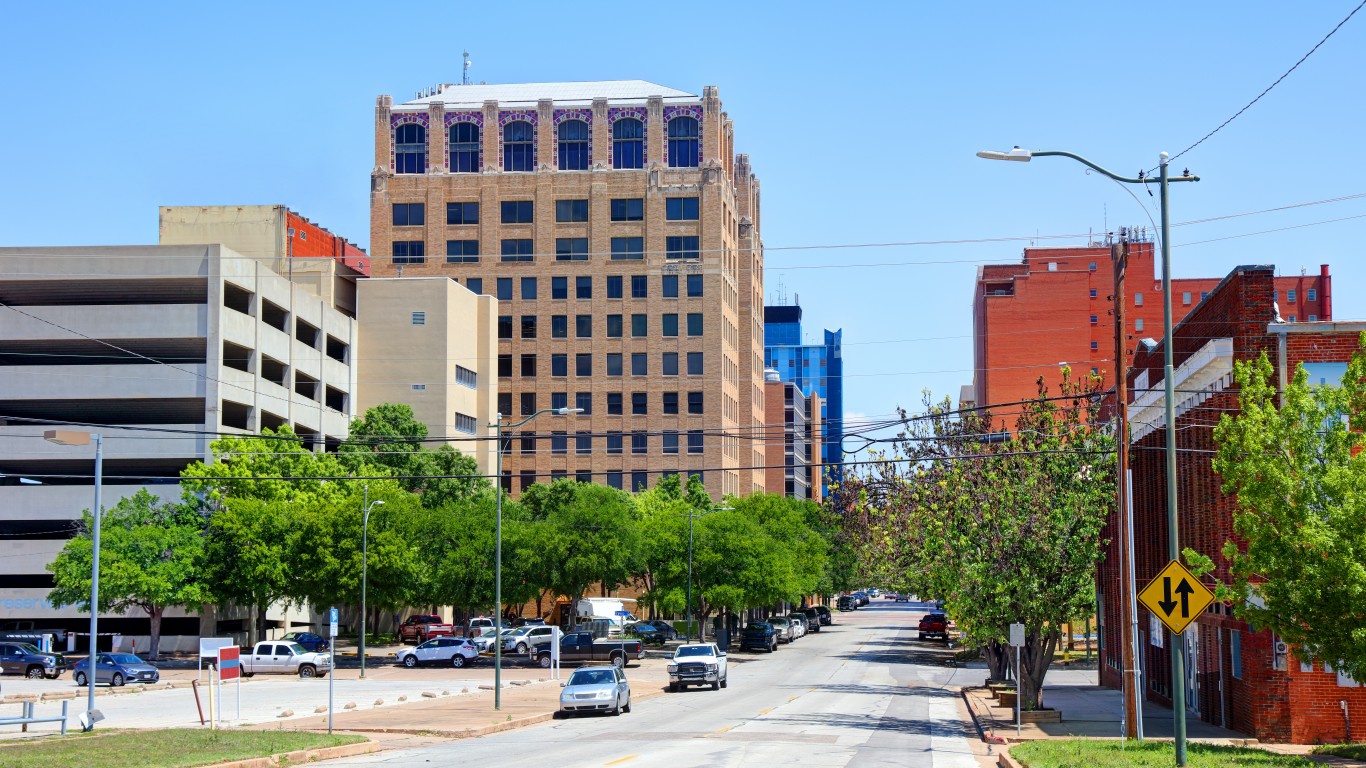
26. Wichita Falls, TX
> Adults who don’t exercise: 29.49% (#54 highest of 384 MSAs)
> Pop. with access to places for physical activity: 62.69% (#351 highest of 384 MSAs)
> Adult obesity rate: 35.20% (#92)
> Pop. over 20 with diabetes: 16.65% (#48,660)
> Adults in poor or fair health: 21.78% (#40)
> Median household income: $66,634 (#284)

25. Farmington, NM
> Adults who don’t exercise: 22.60% (#231 highest of 384 MSAs)
> Pop. with access to places for physical activity: 55.58% (#372 highest of 384 MSAs)
> Adult obesity rate: 34.60% (#113)
> Pop. over 20 with diabetes: 13.50% (#22,140)
> Adults in poor or fair health: 23.51% (#4)
> Median household income: $55,199 (#374)
[in-text-ad]

24. Jackson, TN
> Adults who don’t exercise: 31.03% (#37 highest of 384 MSAs)
> Pop. with access to places for physical activity: 63.21% (#348 highest of 384 MSAs)
> Adult obesity rate: 40.12% (#9)
> Pop. over 20 with diabetes: 15.61% (#27,180)
> Adults in poor or fair health: 23.75% (#15)
> Median household income: $58,697 (#357)

23. Florence-Muscle Shoals, AL
> Adults who don’t exercise: 29.96% (#47 highest of 384 MSAs)
> Pop. with access to places for physical activity: 61.88% (#355 highest of 384 MSAs)
> Adult obesity rate: 34.04% (#128)
> Pop. over 20 with diabetes: 15.38% (#22,520)
> Adults in poor or fair health: 20.91% (#60)
> Median household income: $65,316 (#299)
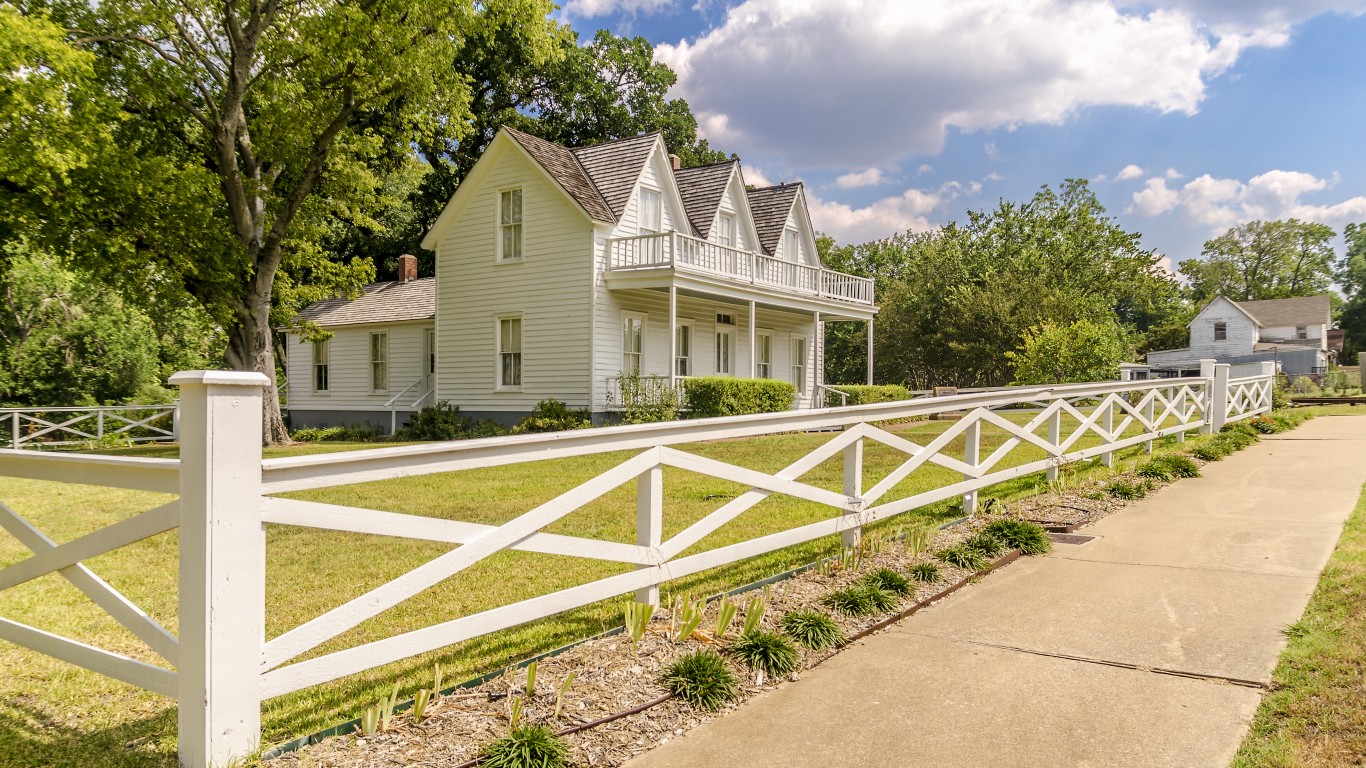
22. Sherman-Denison, TX
> Adults who don’t exercise: 34.90% (#2 highest of 384 MSAs)
> Pop. with access to places for physical activity: 66.64% (#329 highest of 384 MSAs)
> Adult obesity rate: 38.10% (#36)
> Pop. over 20 with diabetes: 11.00% (#43,300)
> Adults in poor or fair health: 19.31% (#157)
> Median household income: $71,649 (#217)
[in-text-ad-2]
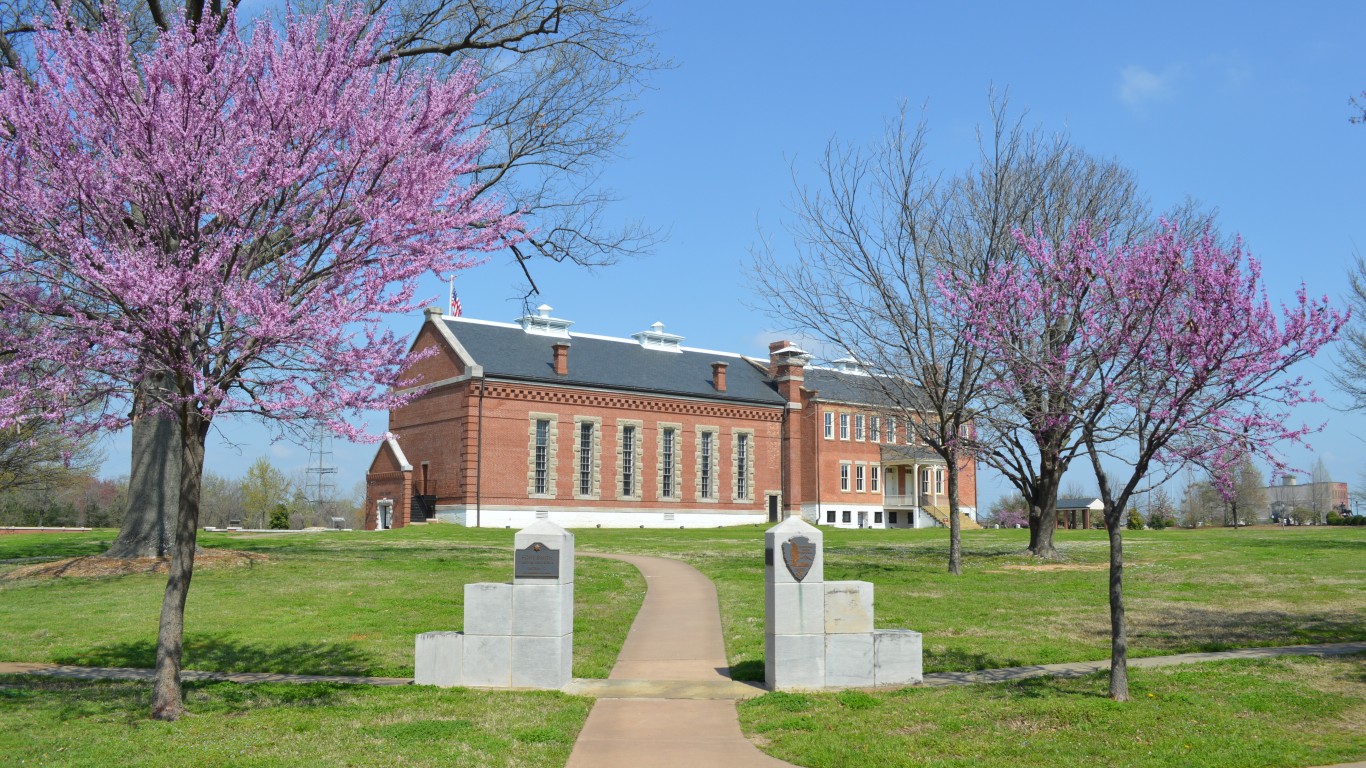
21. Fort Smith, AR-OK
> Adults who don’t exercise: 31.84% (#28 highest of 384 MSAs)
> Pop. with access to places for physical activity: 62.83% (#350 highest of 384 MSAs)
> Adult obesity rate: 36.39% (#69)
> Pop. over 20 with diabetes: 14.28% (#22,900)
> Adults in poor or fair health: 26.15% (#8)
> Median household income: $56,536 (#369)

20. Beaumont-Port Arthur, TX
> Adults who don’t exercise: 32.05% (#23 highest of 384 MSAs)
> Pop. with access to places for physical activity: 61.55% (#357 highest of 384 MSAs)
> Adult obesity rate: 41.49% (#5)
> Pop. over 20 with diabetes: 13.57% (#13,140)
> Adults in poor or fair health: 22.22% (#43)
> Median household income: $68,971 (#254)
[in-text-ad]
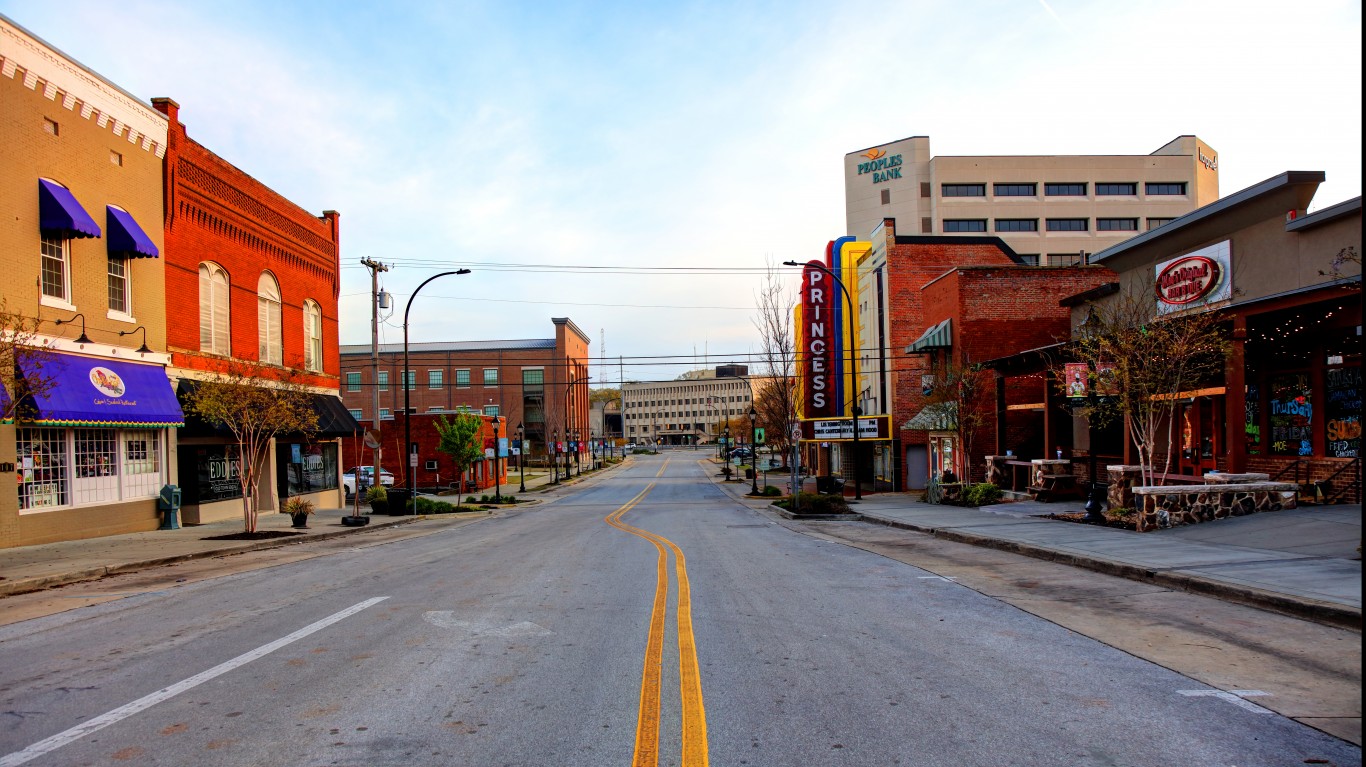
19. Decatur, AL
> Adults who don’t exercise: 27.61% (#91 highest of 384 MSAs)
> Pop. with access to places for physical activity: 56.94% (#371 highest of 384 MSAs)
> Adult obesity rate: 34.96% (#102)
> Pop. over 20 with diabetes: 14.29% (#19,460)
> Adults in poor or fair health: 21.12% (#34)
> Median household income: $65,097 (#303)

18. Jacksonville, NC
> Adults who don’t exercise: 20.20% (#293 highest of 384 MSAs)
> Pop. with access to places for physical activity: 48.55% (#380 highest of 384 MSAs)
> Adult obesity rate: 28.60% (#296)
> Pop. over 20 with diabetes: 8.60% (#27,340)
> Adults in poor or fair health: 20.29% (#5)
> Median household income: $57,756 (#362)
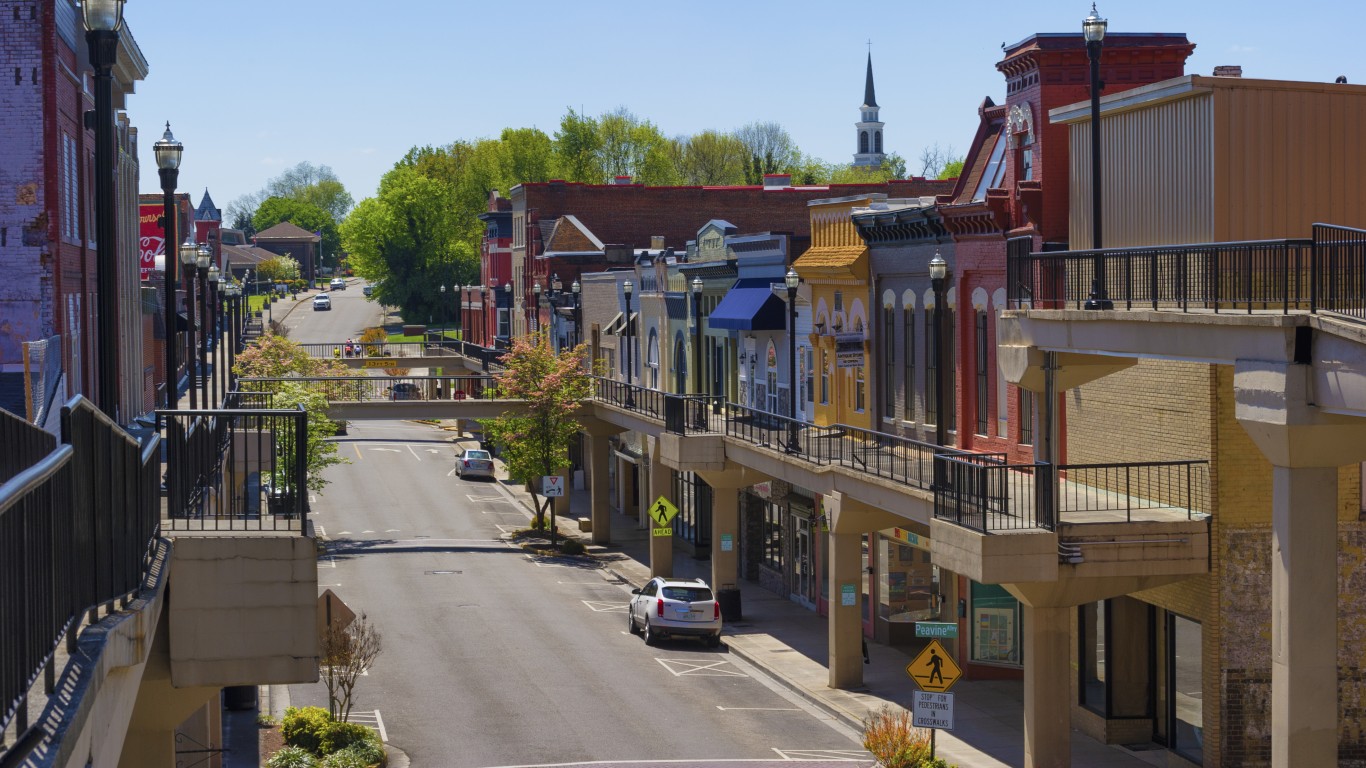
17. Morristown, TN
> Adults who don’t exercise: 32.31% (#18 highest of 384 MSAs)
> Pop. with access to places for physical activity: 59.49% (#363 highest of 384 MSAs)
> Adult obesity rate: 38.09% (#37)
> Pop. over 20 with diabetes: 14.92% (#34,100)
> Adults in poor or fair health: 24.11% (#18)
> Median household income: $58,448 (#358)
[in-text-ad-2]

16. Beckley, WV
> Adults who don’t exercise: 30.68% (#39 highest of 384 MSAs)
> Pop. with access to places for physical activity: 57.26% (#370 highest of 384 MSAs)
> Adult obesity rate: 38.88% (#23)
> Pop. over 20 with diabetes: 17.86% (#13,220)
> Adults in poor or fair health: 25.61% (#11)
> Median household income: $56,860 (#368)

15. Lake Havasu City-Kingman, AZ
> Adults who don’t exercise: 32.20% (#19 highest of 384 MSAs)
> Pop. with access to places for physical activity: 58.57% (#367 highest of 384 MSAs)
> Adult obesity rate: 30.70% (#238)
> Pop. over 20 with diabetes: 14.00% (#29,420)
> Adults in poor or fair health: 22.52% (#39)
> Median household income: $57,058 (#365)
[in-text-ad]
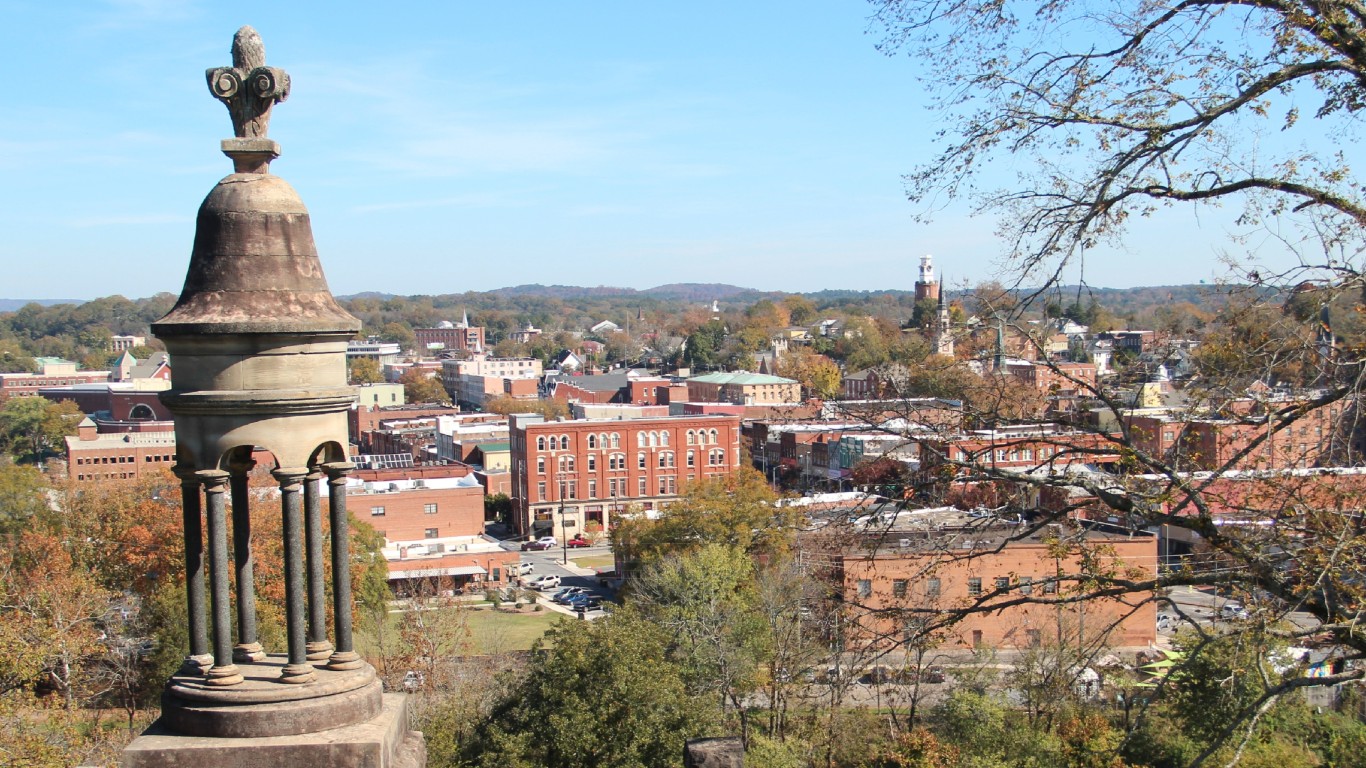
14. Rome, GA
> Adults who don’t exercise: 32.80% (#16 highest of 384 MSAs)
> Pop. with access to places for physical activity: 58.39% (#368 highest of 384 MSAs)
> Adult obesity rate: 34.30% (#122)
> Pop. over 20 with diabetes: 14.40% (#40,660)
> Adults in poor or fair health: 21.97% (#55)
> Median household income: $61,841 (#333)

13. Jonesboro, AR
> Adults who don’t exercise: 33.31% (#10 highest of 384 MSAs)
> Pop. with access to places for physical activity: 58.32% (#369 highest of 384 MSAs)
> Adult obesity rate: 39.68% (#15)
> Pop. over 20 with diabetes: 15.15% (#27,860)
> Adults in poor or fair health: 24.11% (#20)
> Median household income: $60,922 (#344)
12. Hinesville, GA
> Adults who don’t exercise: 34.29% (#4 highest of 384 MSAs)
> Pop. with access to places for physical activity: 58.61% (#366 highest of 384 MSAs)
> Adult obesity rate: 36.45% (#66)
> Pop. over 20 with diabetes: 12.36% (#25,980)
> Adults in poor or fair health: 22.25% (#54)
> Median household income: $54,993 (#375)
[in-text-ad-2]
11. Elizabethtown-Fort Knox, KY
> Adults who don’t exercise: 30.18% (#46 highest of 384 MSAs)
> Pop. with access to places for physical activity: 53.28% (#373 highest of 384 MSAs)
> Adult obesity rate: 38.85% (#24)
> Pop. over 20 with diabetes: 12.11% (#21,060)
> Adults in poor or fair health: 21.69% (#43)
> Median household income: $71,446 (#219)
10. Rocky Mount, NC
> Adults who don’t exercise: 27.85% (#85 highest of 384 MSAs)
> Pop. with access to places for physical activity: 50.92% (#376 highest of 384 MSAs)
> Adult obesity rate: 38.93% (#21)
> Pop. over 20 with diabetes: 17.26% (#40,580)
> Adults in poor or fair health: 23.45% (#16)
> Median household income: $57,013 (#366)
[in-text-ad]
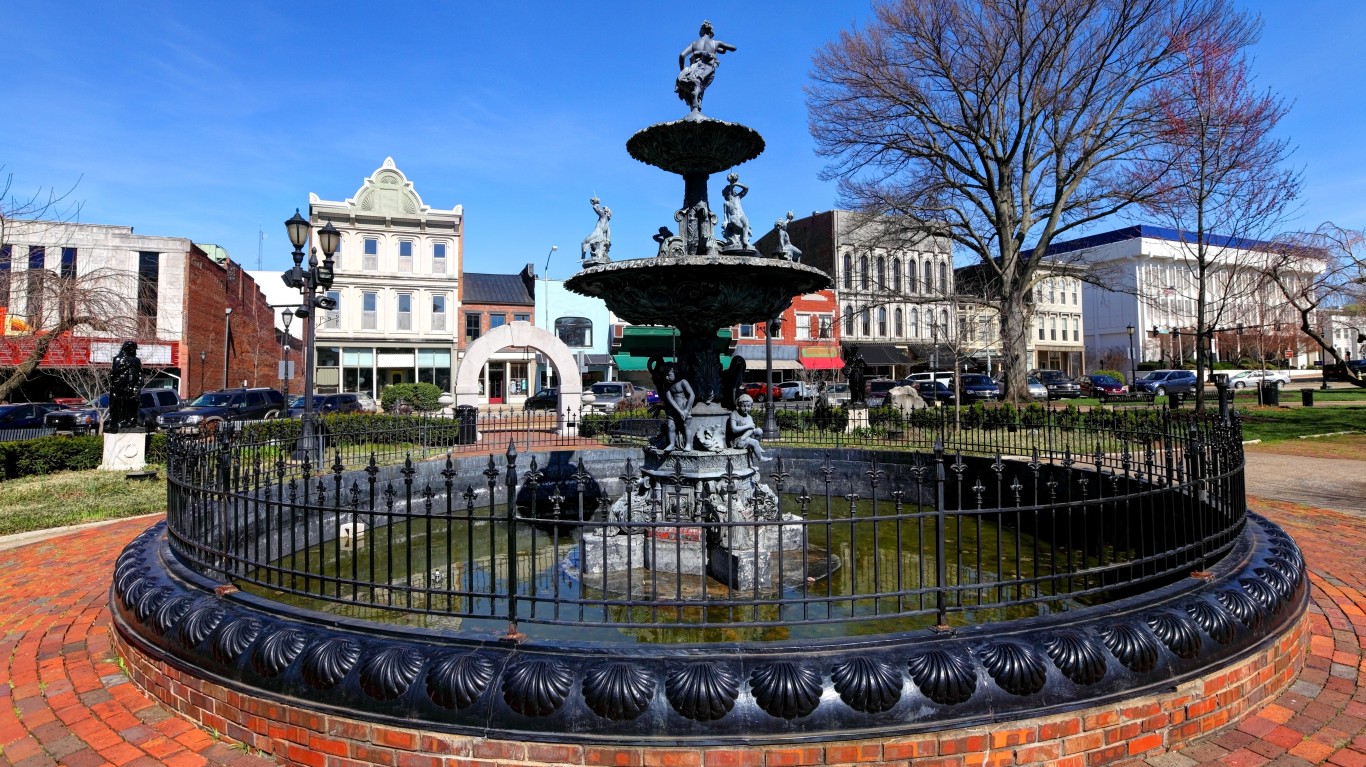
9. Bowling Green, KY
> Adults who don’t exercise: 26.67% (#111 highest of 384 MSAs)
> Pop. with access to places for physical activity: 48.78% (#379 highest of 384 MSAs)
> Adult obesity rate: 30.15% (#258)
> Pop. over 20 with diabetes: 9.28% (#14,540)
> Adults in poor or fair health: 22.92% (#14)
> Median household income: $62,888 (#324)
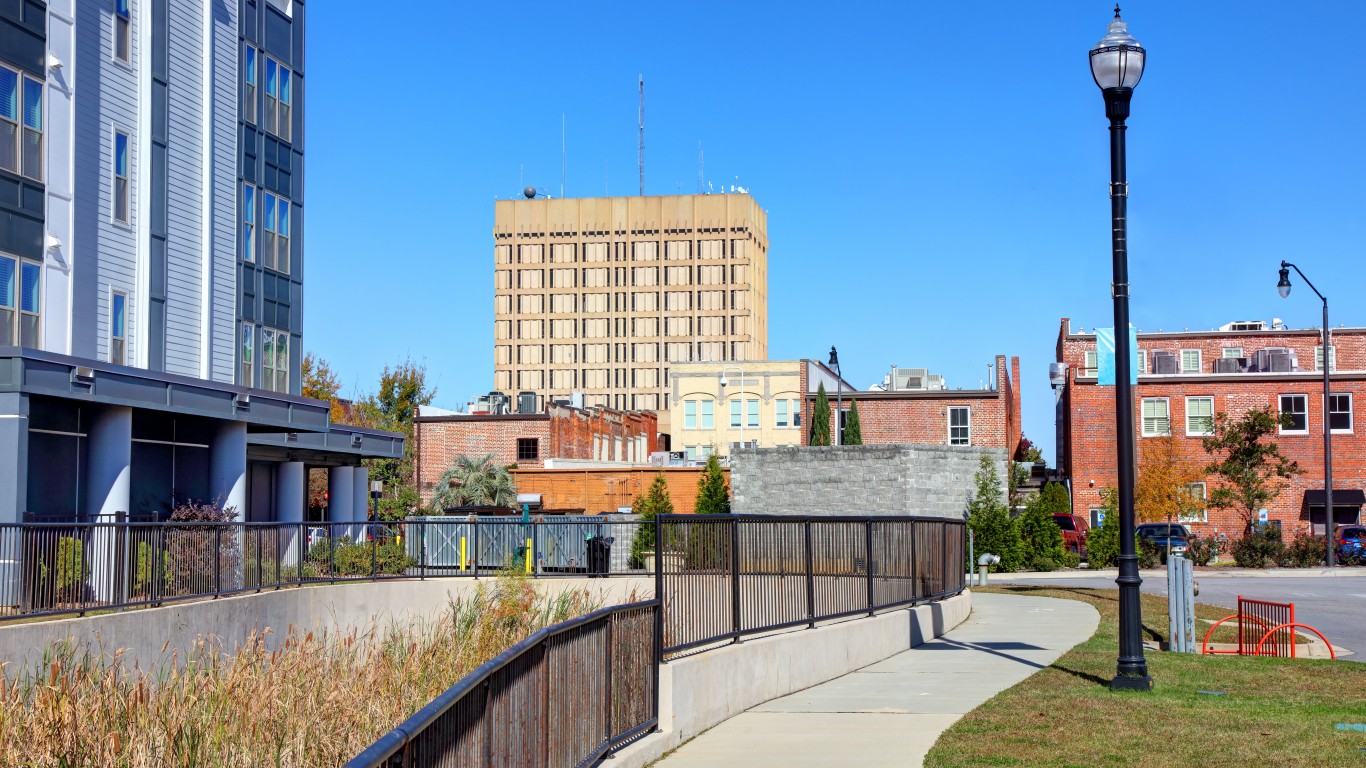
8. Florence, SC
> Adults who don’t exercise: 31.80% (#29 highest of 384 MSAs)
> Pop. with access to places for physical activity: 52.34% (#375 highest of 384 MSAs)
> Adult obesity rate: 38.38% (#31)
> Pop. over 20 with diabetes: 16.80% (#22,500)
> Adults in poor or fair health: 21.51% (#58)
> Median household income: $58,215 (#360)

7. Dothan, AL
> Adults who don’t exercise: 33.51% (#9 highest of 384 MSAs)
> Pop. with access to places for physical activity: 53.12% (#374 highest of 384 MSAs)
> Adult obesity rate: 38.59% (#27)
> Pop. over 20 with diabetes: 16.91% (#20,020)
> Adults in poor or fair health: 23.90% (#23)
> Median household income: $61,627 (#335)
[in-text-ad-2]

6. Hanford-Corcoran, CA
> Adults who don’t exercise: 24.30% (#175 highest of 384 MSAs)
> Pop. with access to places for physical activity: 43.75% (#384 highest of 384 MSAs)
> Adult obesity rate: 34.00% (#129)
> Pop. over 20 with diabetes: 12.90% (#25,260)
> Adults in poor or fair health: 25.39% (#3)
> Median household income: $64,353 (#309)
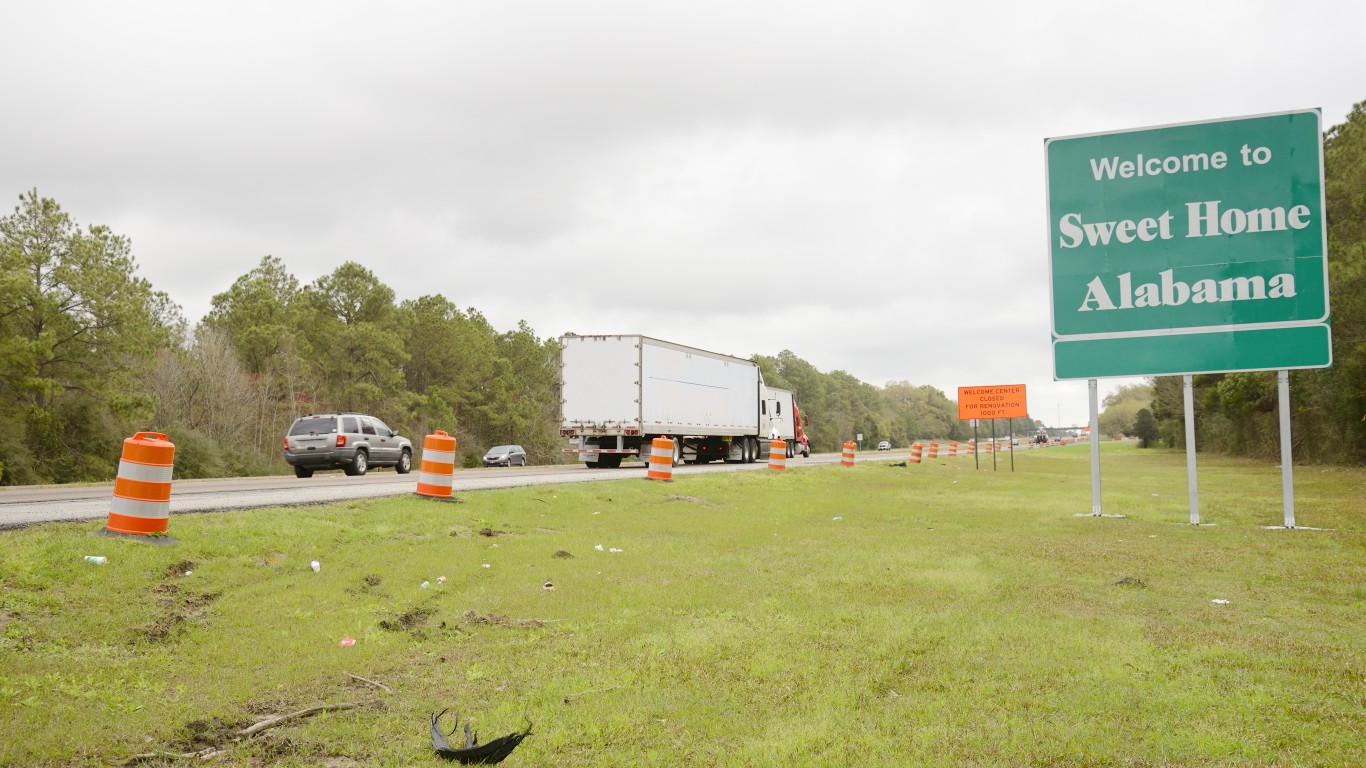
5. Anniston-Oxford, AL
> Adults who don’t exercise: 31.10% (#35 highest of 384 MSAs)
> Pop. with access to places for physical activity: 47.72% (#381 highest of 384 MSAs)
> Adult obesity rate: 39.70% (#12)
> Pop. over 20 with diabetes: 17.00% (#11,500)
> Adults in poor or fair health: 23.66% (#18)
> Median household income: $59,609 (#353)
[in-text-ad]
4. Goldsboro, NC
> Adults who don’t exercise: 28.60% (#72 highest of 384 MSAs)
> Pop. with access to places for physical activity: 45.16% (#383 highest of 384 MSAs)
> Adult obesity rate: 39.70% (#13)
> Pop. over 20 with diabetes: 16.00% (#24,140)
> Adults in poor or fair health: 23.61% (#13)
> Median household income: $59,689 (#351)
3. Gadsden, AL
> Adults who don’t exercise: 33.60% (#8 highest of 384 MSAs)
> Pop. with access to places for physical activity: 49.49% (#378 highest of 384 MSAs)
> Adult obesity rate: 36.20% (#73)
> Pop. over 20 with diabetes: 17.30% (#23,460)
> Adults in poor or fair health: 21.98% (#60)
> Median household income: $59,713 (#350)
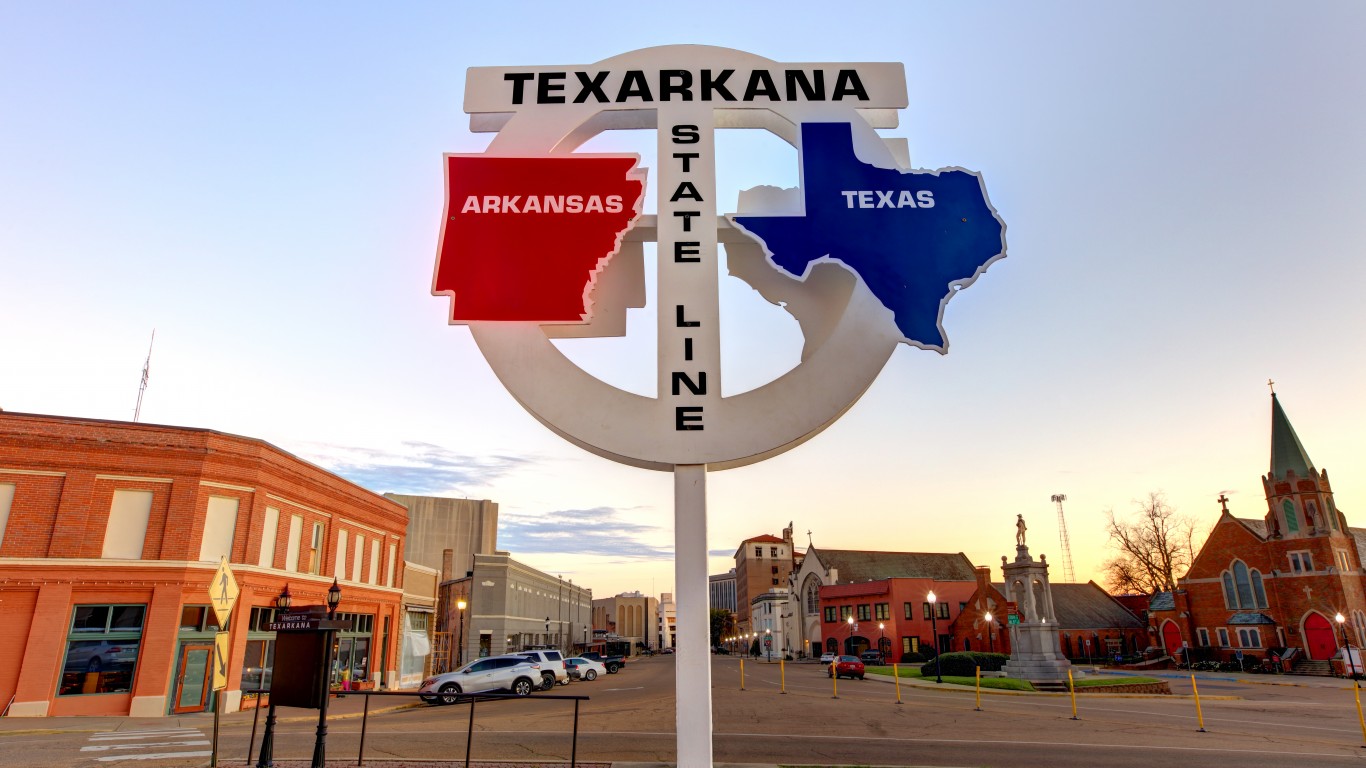
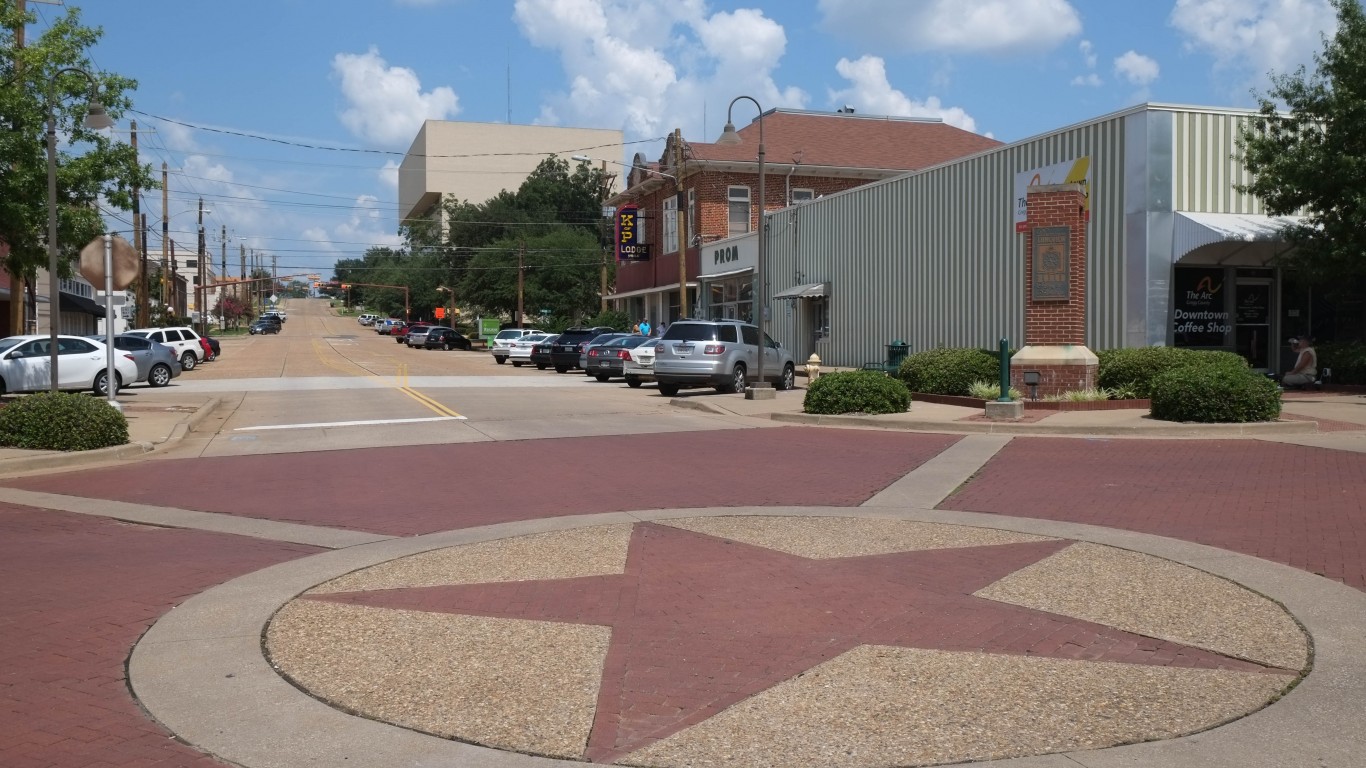
2. Texarkana, TX-AR
> Adults who don’t exercise: 34.48% (#3 highest of 384 MSAs)
> Pop. with access to places for physical activity: 49.73% (#377 highest of 384 MSAs)
> Adult obesity rate: 42.74% (#2)
> Pop. over 20 with diabetes: 15.32% (#45,500)
> Adults in poor or fair health: 22.98% (#41)
> Median household income: $63,851 (#315)
[in-text-ad-2]
1. Pine Bluff, AR
> Adults who don’t exercise: 33.96% (#7 highest of 384 MSAs)
> Pop. with access to places for physical activity: 46.67% (#382 highest of 384 MSAs)
> Adult obesity rate: 42.46% (#3)
> Pop. over 20 with diabetes: 14.71% (#38,220)
> Adults in poor or fair health: 28.01% (#7)
> Median household income: $53,908 (#379)
The #1 Thing to Do Before You Claim Social Security (Sponsor)
Choosing the right (or wrong) time to claim Social Security can dramatically change your retirement. So, before making one of the biggest decisions of your financial life, it’s a smart idea to get an extra set of eyes on your complete financial situation.
A financial advisor can help you decide the right Social Security option for you and your family. Finding a qualified financial advisor doesn’t have to be hard. SmartAsset’s free tool matches you with up to three financial advisors who serve your area, and you can interview your advisor matches at no cost to decide which one is right for you.
Click here to match with up to 3 financial pros who would be excited to help you optimize your Social Security outcomes.
Have questions about retirement or personal finance? Email us at [email protected]!
By emailing your questions to 24/7 Wall St., you agree to have them published anonymously on a673b.bigscoots-temp.com.
By submitting your story, you understand and agree that we may use your story, or versions of it, in all media and platforms, including via third parties.
Thank you for reading! Have some feedback for us?
Contact the 24/7 Wall St. editorial team.
 24/7 Wall St.
 24/7 Wall St.

 24/7 Wall St.