This week, hundreds died in a heat wave “apocalypse,” as meteorologists put it, in Europe. In June, Arctic wildfires raged and record-breaking floods hit Yellowstone National Park, Bangladesh, and India.
There have been dozens of extreme climate events in 2022 alone. Such trends will continue, scientists warn, becoming the norm for many cities, particularly those that are most vulnerable to climate change. (These are the worst cities to live in as climate change gets worse.)
Human-caused climate change is associated with the increase of extreme climate events, and as atmospheric temperatures rise, stronger storms and climate extremes would be triggered. Humans now face a number of climate tipping points, requiring significant mitigation. These are the 10 climate tipping points the world needs to avoid.
To determine the worst climate-related events since 2010, 24/7 Wall St., reviewed data from the National Oceanic and Atmospheric Administration, Climate.gov, Weather.com, Disasterphilanthropy.org, EcoWatch.com, and referenced media sources, including the Washington Post, BBC.com, CNN.com, ABCnews.com, TheAtlantic.com, and QZ.com. The list focuses on extraordinary weather-related events that seem to be caused by or connected with climate change. Events are ordered chronologically.
Many regions are affected by these climate events, with every continent home to one or more disasters on our list. North America and Asia have been hit particularly hard by flooding, with Bangladesh, India, and Pakistan seeing some of the worst. While rich, developed nations may have infrastructure to dampen the impact of such events, poorer, developing nations like Somalia, which have been afflicted by drought and famine, face increasing challenges to meet basic living needs, such as food.
Climate change has been implicated in all of the worst climate-related events since 2010. Of the 43 climate events, 17 are instances of flooding. While some countries experience flooding regularly, these events are more extreme and deadly than ever before, triggered by global warming. The list includes 12 storms (Including hurricanes, typhoons, and cyclones), 11 heat wave events, four wildfires, and three tornado outbreaks.
While the death count and economic loss of each event is significant on its own, their total cost is staggering. Added up, the worst climate-related events since 2010 have contributed to over 328,000 deaths and an estimated more than $870 billion in damages and economic loss. The deadliest climate event on our list is the 2011-2012 drought in East Africa, which led to at least 250,000 deaths.
Click here to see the worst climate-related events since 2010.
To determine the worst climate-related events, 24/7 Wall St., reviewed data from sources such as the National Oceanic and Atmospheric Administration, Climate.gov, Weather.com, Disasterphilanthropy.org, EcoWatch.com, and media sources such as the Washington Post, BBC.com, CNN.com, ABCnews.com, TheAtlantic.com, and QZ.com. We compiled our list by focusing on extraordinary weather-related events that seemed to be caused or connected with climate change.
2010: Heat wave
> Location: Western Russia
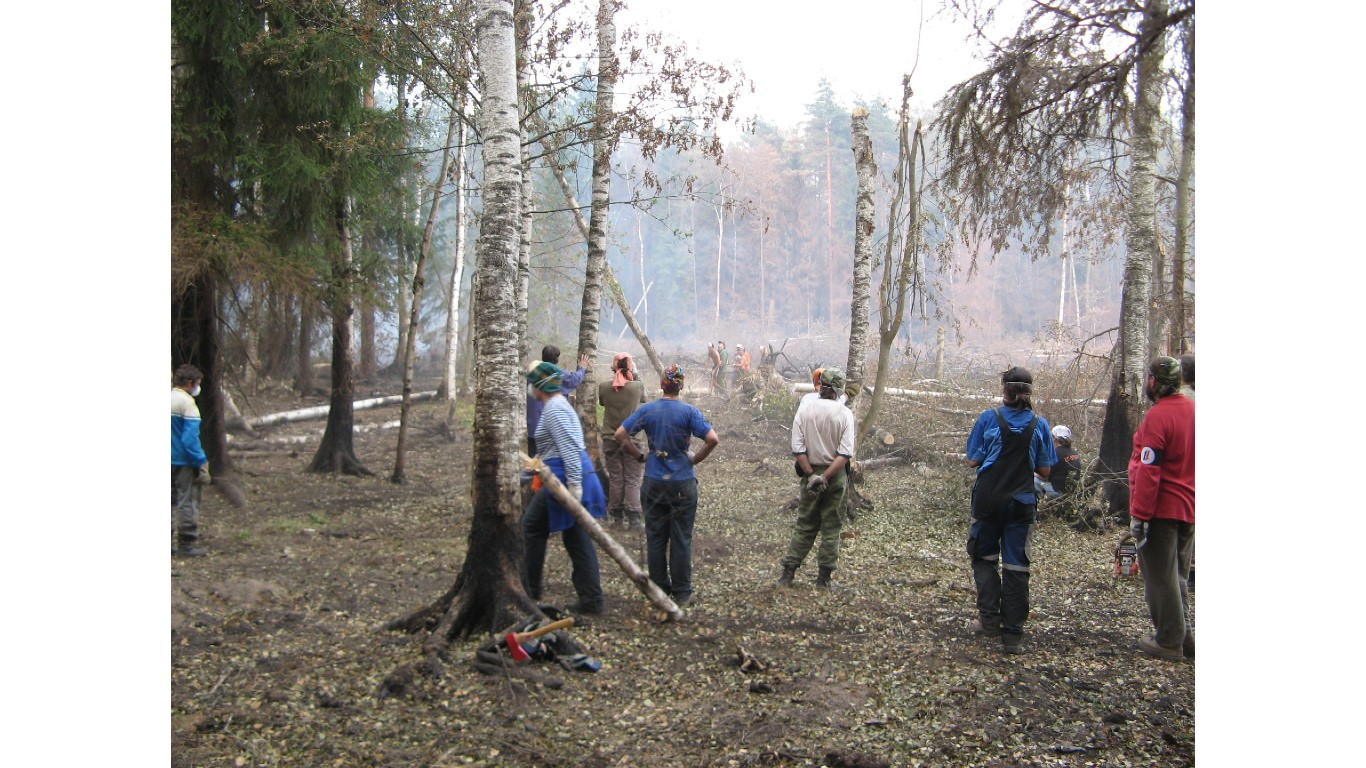
Summer temperatures in Moscow typically remain in the 70s, and large variations in these temperatures can have devastating effects on agriculture. In 2010, when temperatures in the Russian capital soared above a record-breaking 100°F, wheat crops were destroyed, 55,000 people died, and wildfires broke out. The event resulted in economic loss of an estimated $15 billion.
[in-text-ad]
2010: Flooding from monsoon
> Location: Pakistan
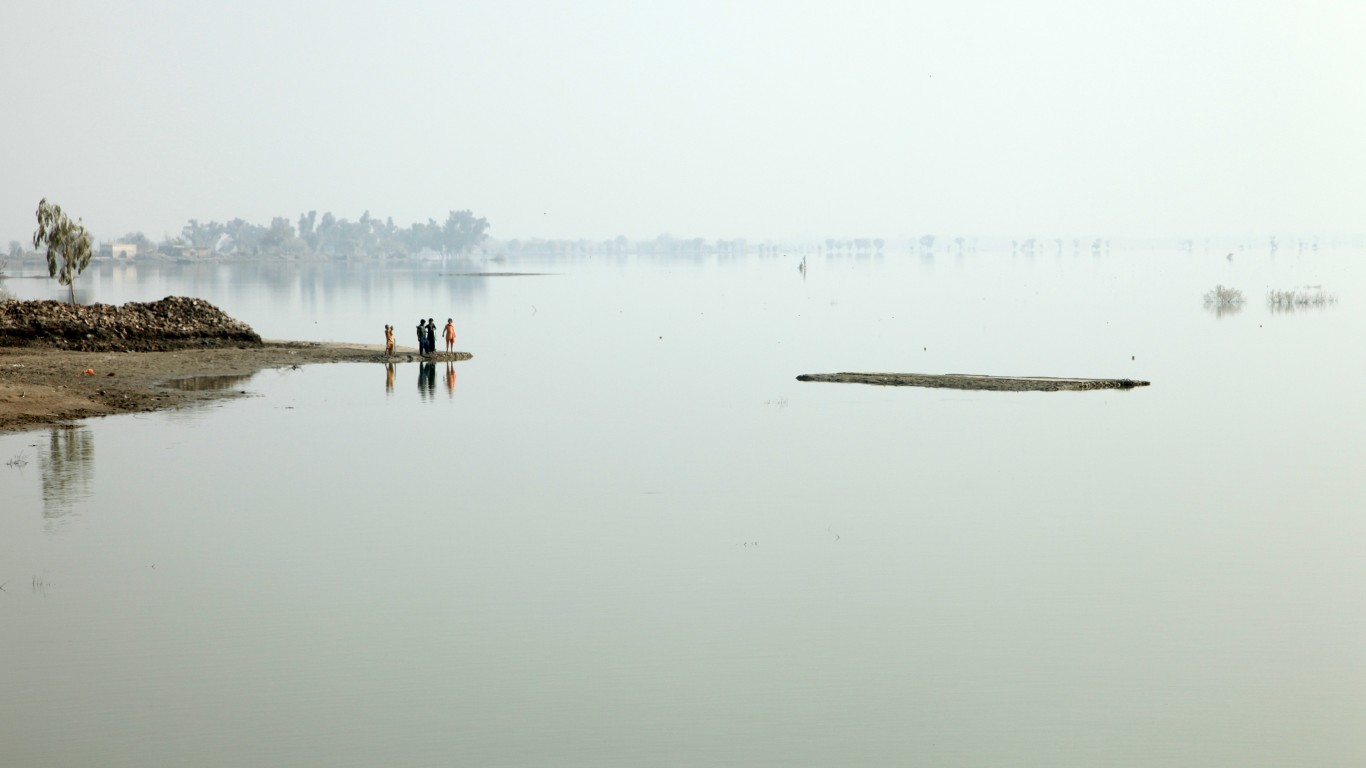
2010 was also the year that a monsoon brought deadly flooding to Pakistan. An estimated 18 million people were affected, and 1,800 were killed. The monsoon was caused by an unusual jet stream, which resulted from the same weather pattern that hit Moscow with a heat wave. Between farmland devastation and destruction of public services like schools, the event caused an estimated economic loss of $43 billion.
2011: Tornadic spring
> Location: Mississippi, Alabama, northwest Georgia, Missouri, and Tennessee
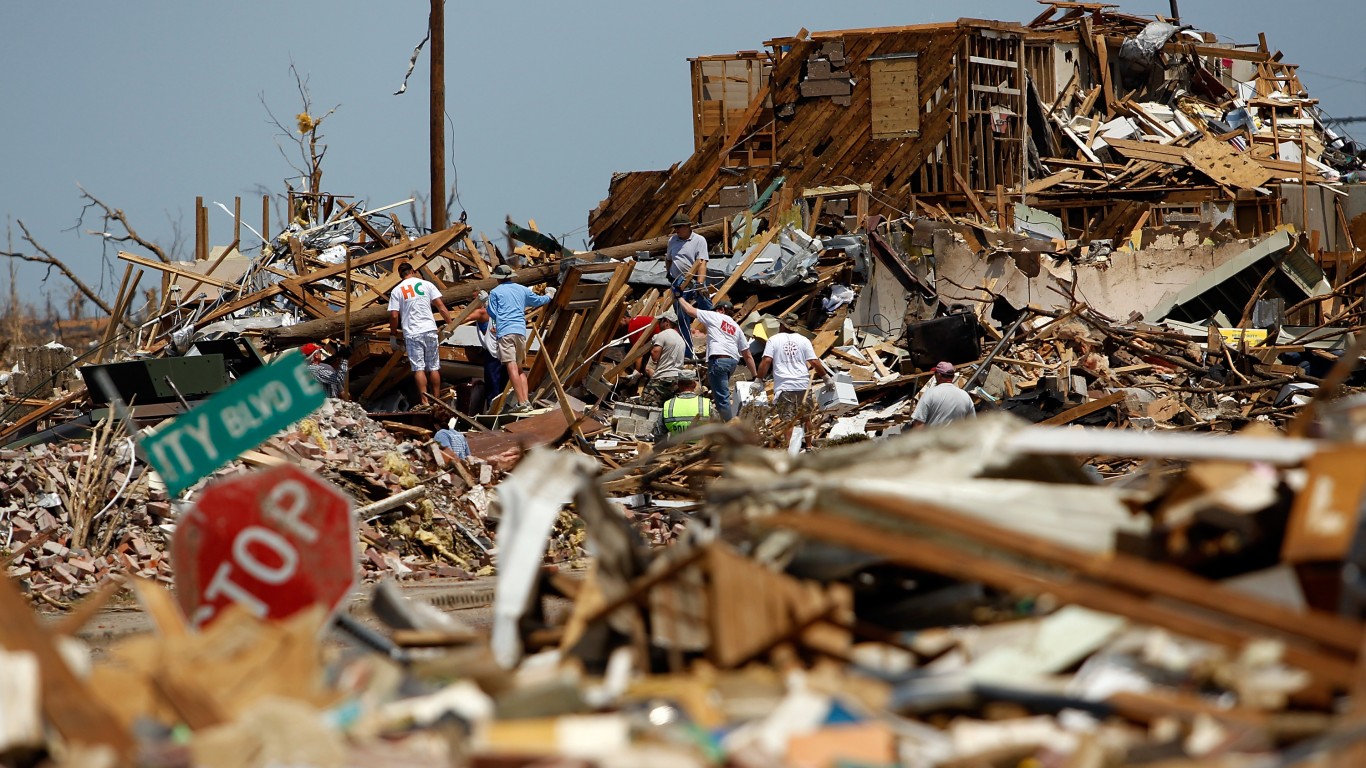
In 2011, a slew of tornadoes touched down throughout Mississippi, Alabama, Northwest Georgia, Tennessee, and Missouri. There were 349 tornadoes in total, killing 321 people and causing damage estimated at over $11.9 billion. Joplin, Missouri, was devastated by a mile-wide EF5 tornado, which ravaged the city, killing 161 people. The tornadic spring was the costliest tornado outbreak in U.S. history.
2011-12: Flooding from monsoon
> Location: Thailand, Vietnam, Cambodia
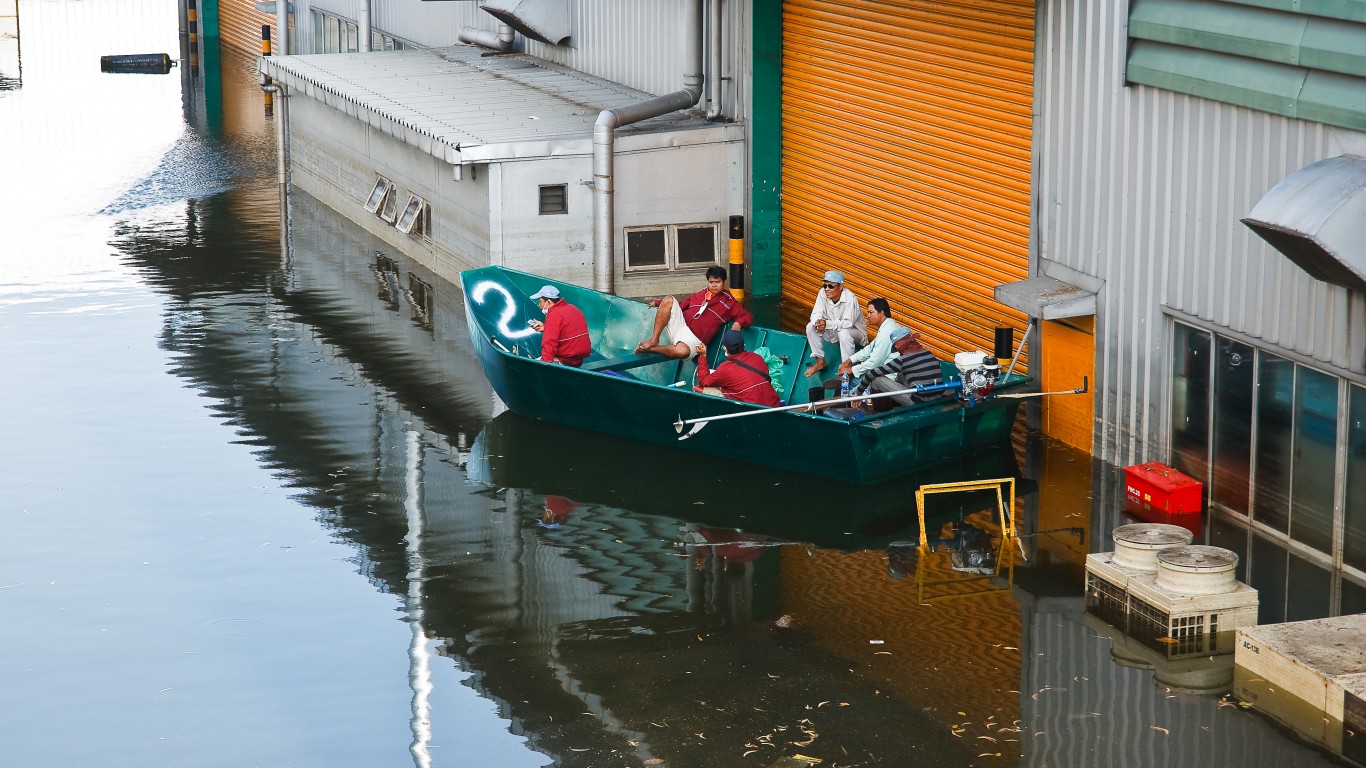
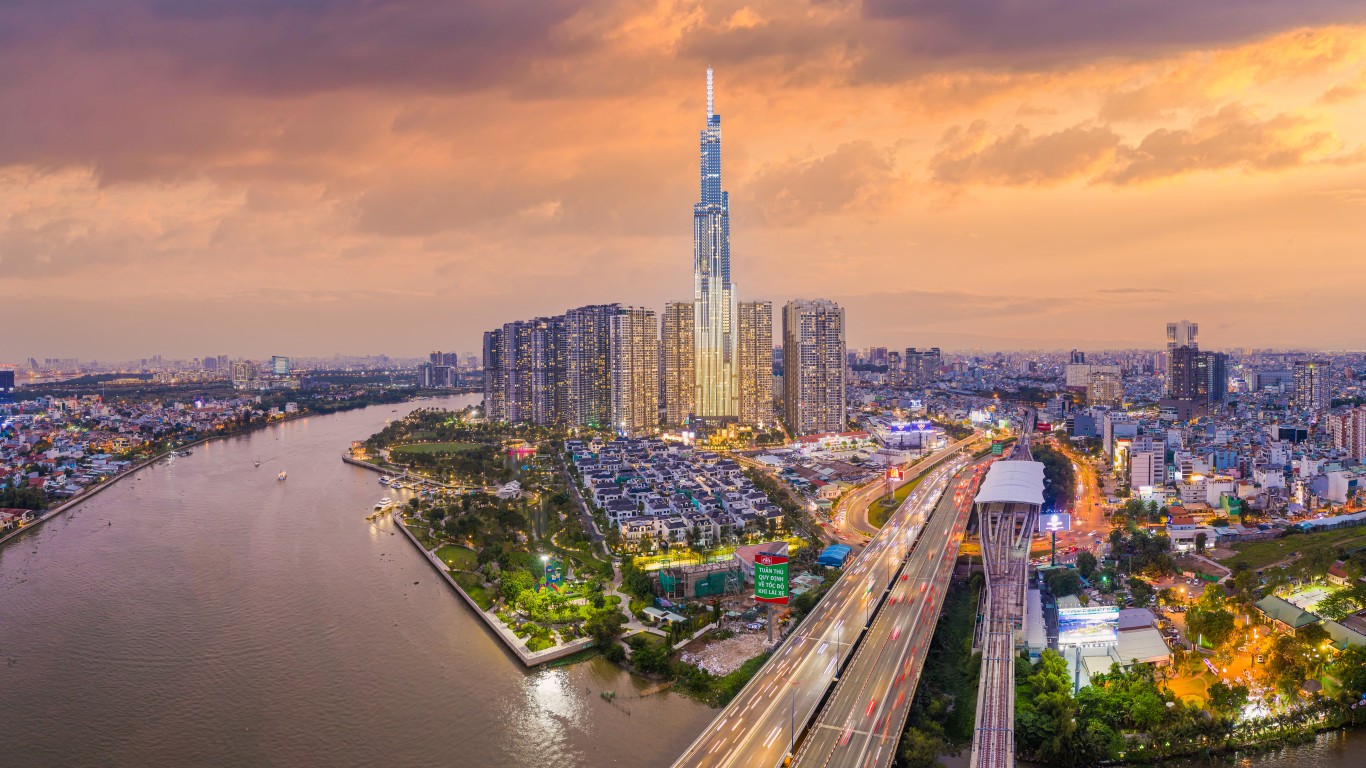
Flooded cars, wading cattle herds, and giant, submerged Buddha statues were but a few striking sights during the extreme flooding event that hit Thailand, Vietnam, and Cambodia between 2011 and 2012. The catastrophic monsoon and subsequent flooding resulted in the deaths of 800 people, causing $2 billion worth of damage.
[in-text-ad-2]
2011-12: Drought
> Location: East Africa
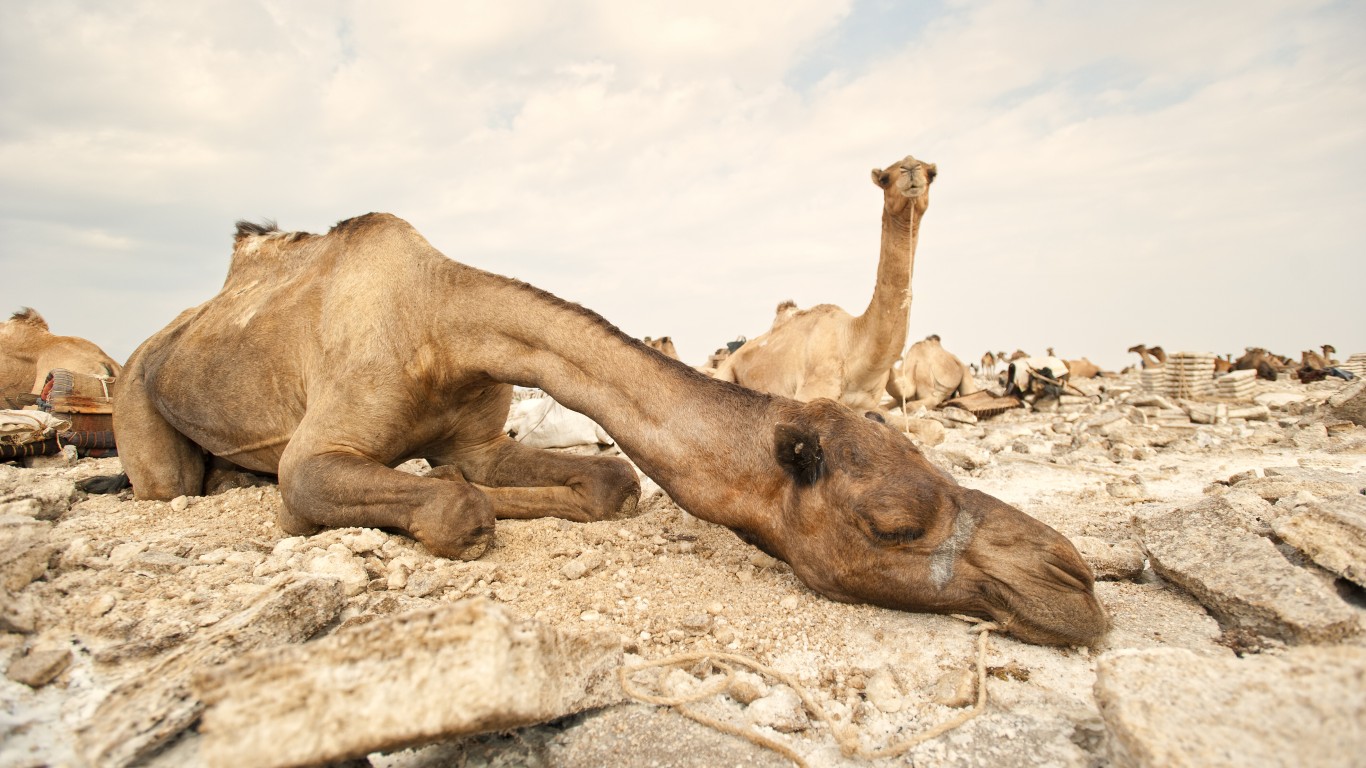
Between 2011 and 2012, severe drought struck East Africa, resulting in deadly famine across a number of countries. Somalia was one of the hardest hit. The United Nations estimated 250,000 people died as a result between 2010 and 2012. According to the U.K. Met Office, climate change played a major role in the drought event, with climate and precipitation extremes increasing as global temperatures rise.
2012: Extreme melt seasons
> Location: Greenland
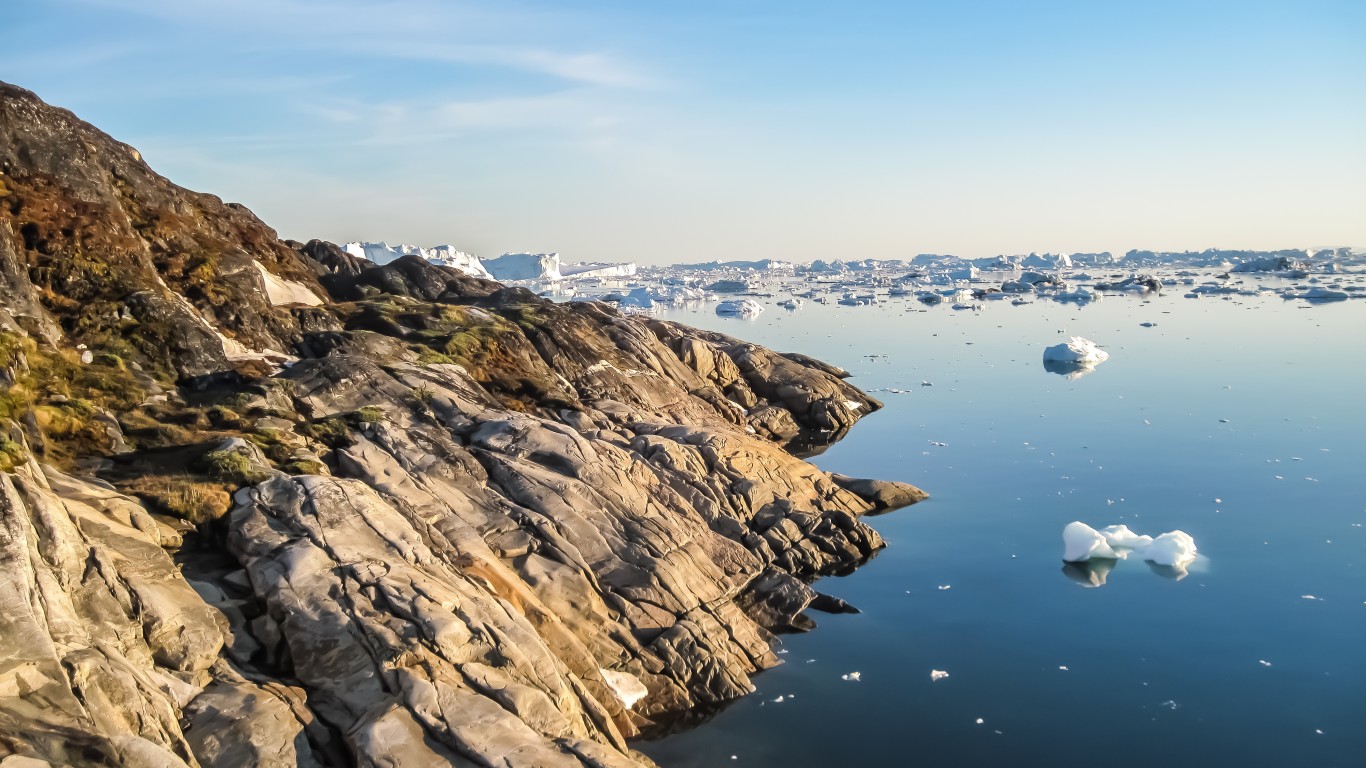
Greenland’s ice sheet is the second largest on the planet, only behind Antarctica. In 2012, 97% of Greenland’s ice sheet experienced surface melting. In 2019, in yet another warm summer, 60% of the ice sheet melted, producing a record volume loss of 12.5 billion tons. The University Corporation for Atmospheric Research warns that a complete melt of this ice sheet could cause sea levels to rise 21 feet.
[in-text-ad]

2012: Superstorm Sandy
> Location: East Coast of U.S.
Superstorm Sandy hit the East Coast during a full moon and high tide, triggering a massive storm surge and making an already hazardous situation worse. The storm, which occurred at the end of October, was followed by historic flooding and power outages, leaving thousands without heat in the weeks that followed. As a result of Sandy’s direct impact and the aftermath, 159 people died. The storm caused $73.5 billion (inflation-adjusted) worth of damage.
2013: Tornadoes
> Location: Oklahoma
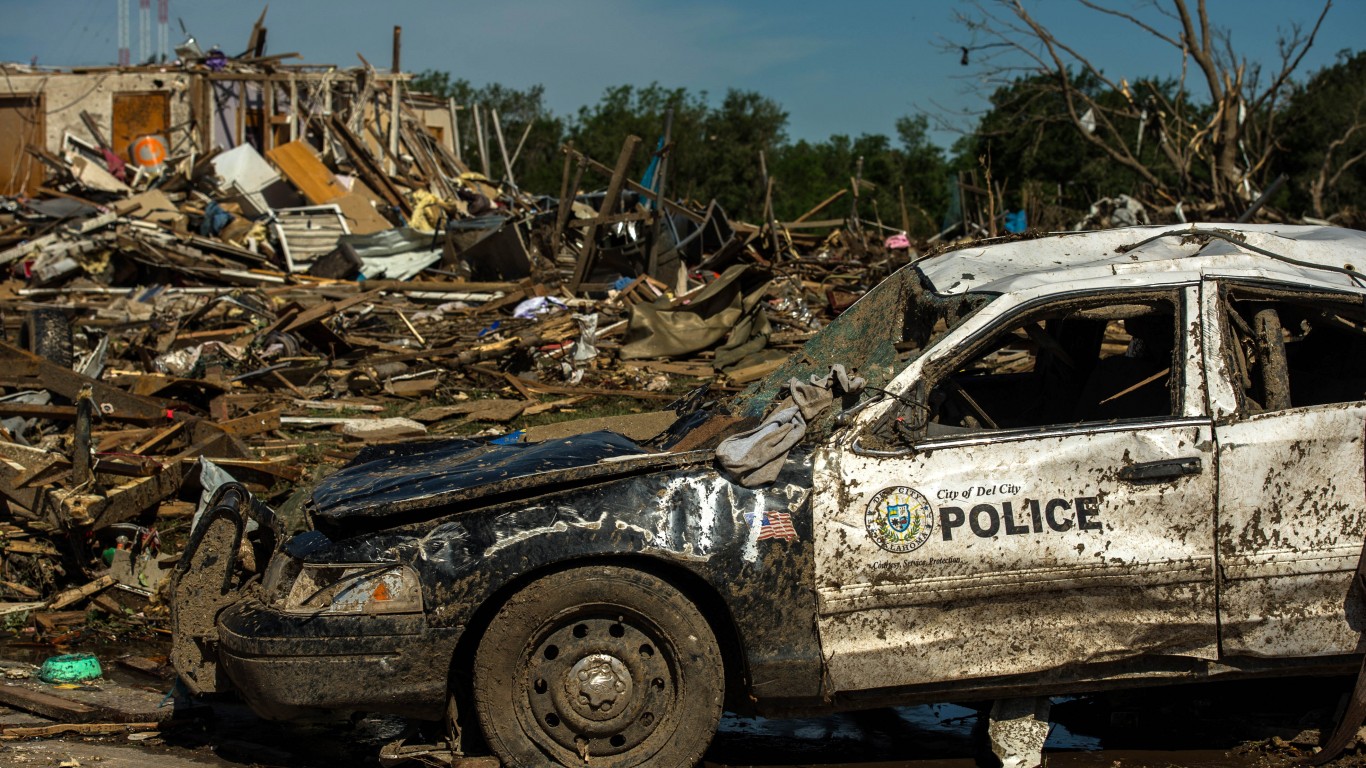
Oklahoma faced two destructive tornadoes in 2013 within an 11-day span. The first was an EF5 tornado that killed 24 people, including seven at a local elementary school, and caused $2 billion in damage. The second, an EF3, 2.6-mile wide tornado, swept through El Reno and Oklahoma City, killing eight and leaving chaos throughout the region. Coinciding thunderstorms also brought flash flooding, taking the lives of an additional 13 people.
2013: Typhoon/hurricane
> Location: Philippines, eastern Pacific
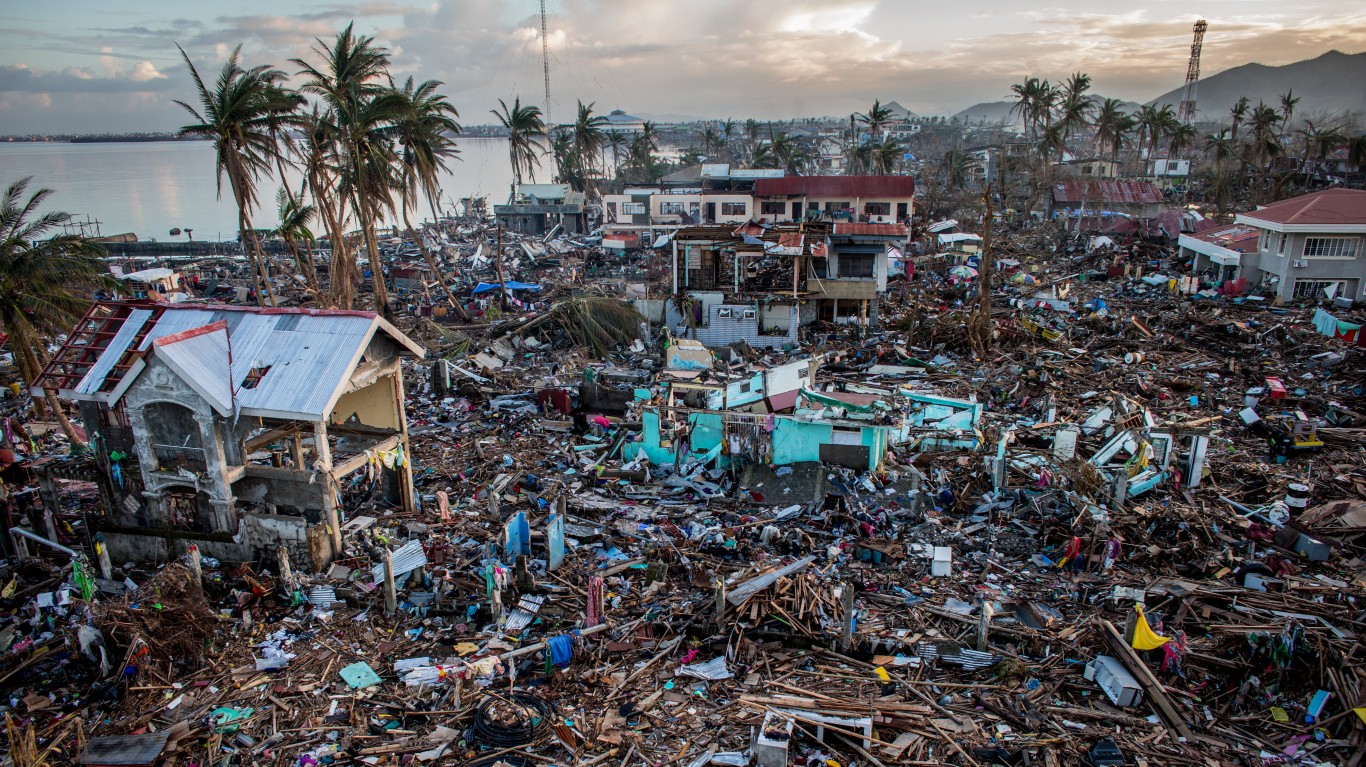
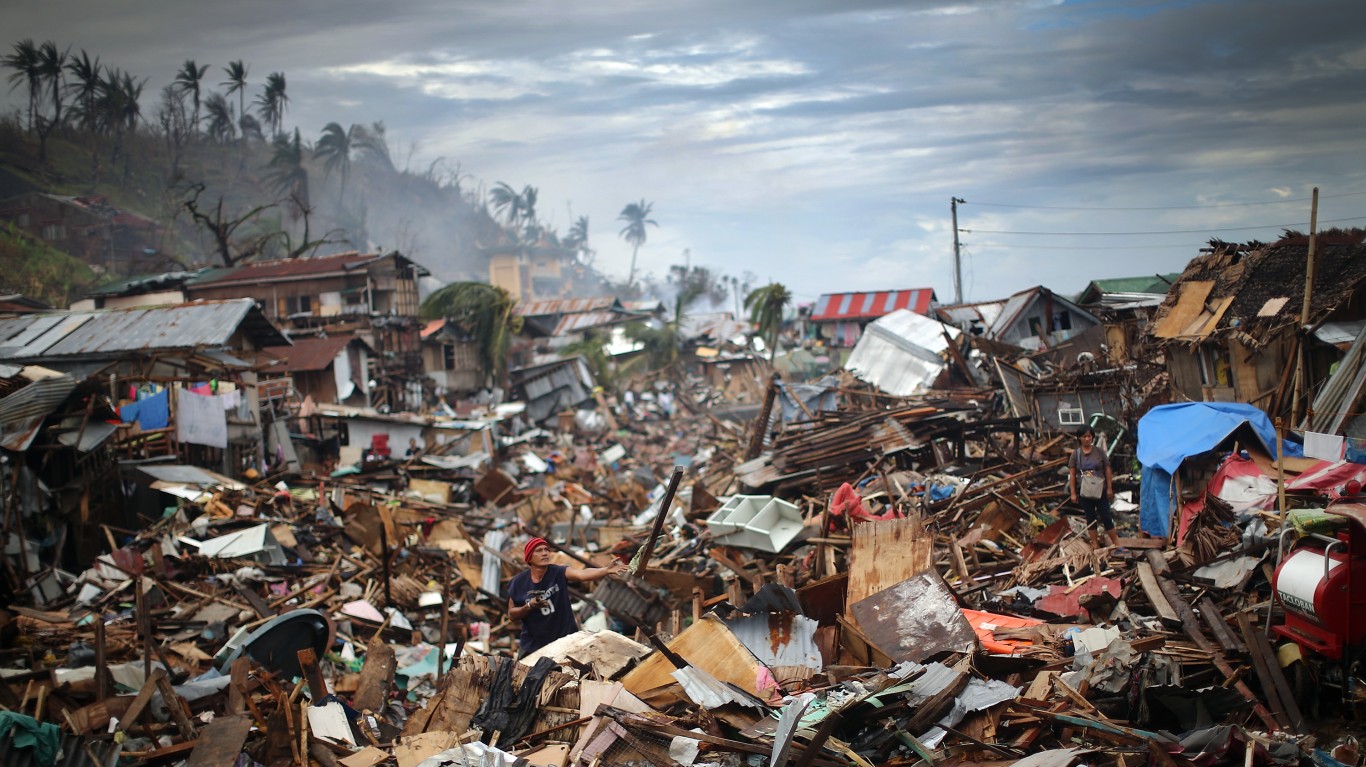
In 2013, Category 5 Super Typhoon Haiyan ravaged the Philippines, and Hurricane Patricia wreaked havoc in the Eastern Pacific. Both storms were record setting, with Haiyan and Patricia reaching sustained winds of 195 mph and 215 mph, respectively. Patricia was the strongest hurricane in the Western Hemisphere. According to World Vision, Haiyan killed over 6,000 people and caused an estimated $5.8 billion. The Weather Channel attributes two deaths to Hurricane Patricia and $325 million in damage.
[in-text-ad-2]

2014-18: Arctic heat waves
> Location: Arctic
Of the five winters between 2014 and 2018, temperatures in the Arctic rose above freezing — as much as 50 degrees above normal — in four of the five winters. This is an alarming occurrence. In the decades leading up to 2010, such temperatures occurred only four times over thirty years. As more Arctic sea ice thins, the sea water underneath is exposed, leading to increases in air temperature and the perpetuation of additional melting.
2015-17: Global coral bleaching event
> Location: Worldwide
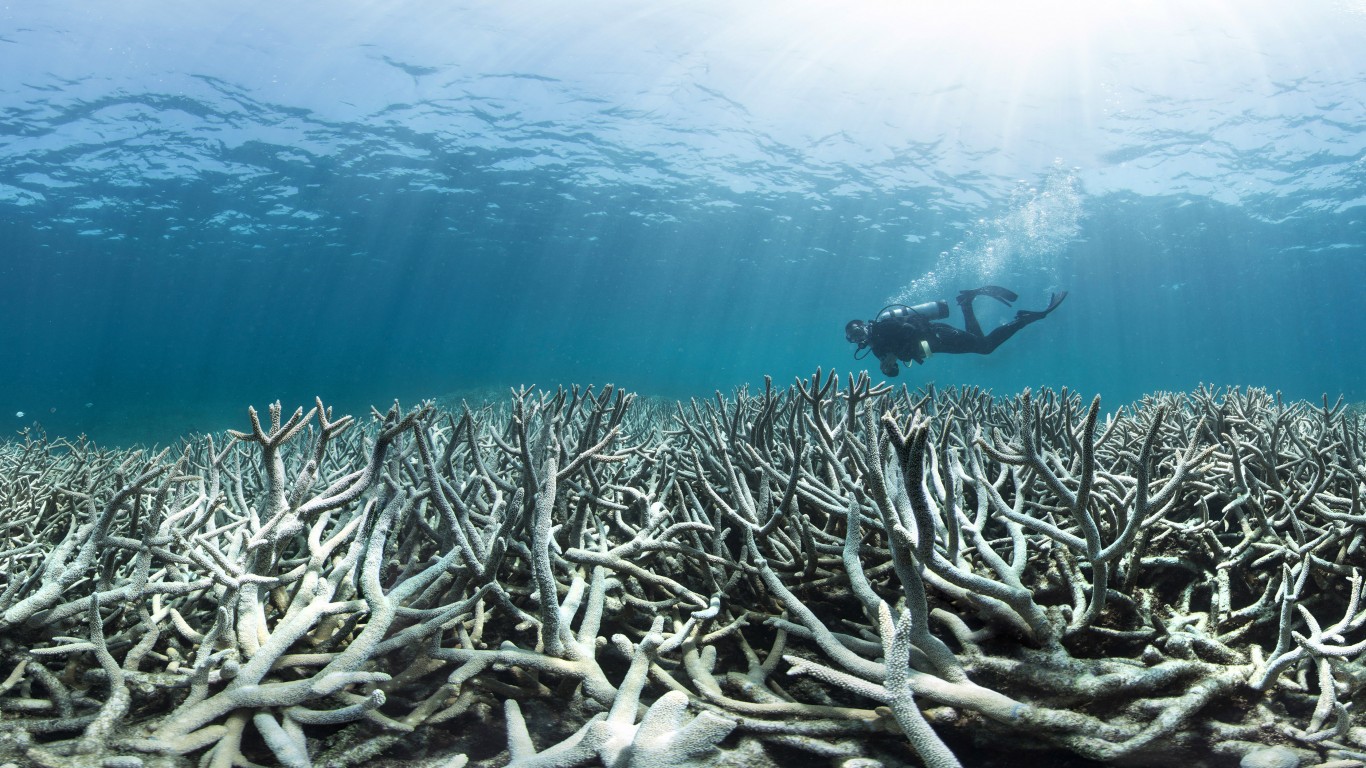
When environmental temperatures become too high, coral, a living organism, expels symbiotic algae that typically live inside it and provide it with nutrients. This results in a bleaching event, increasing the risk of coral death. Between 2015 and 2017, a global coral bleaching event affected 75% of coral reefs, including the Great Barrier Reef in Australia. Coral death has a significant, negative impact on oceanic ecosystems and the thousands of species that depend on it.
[in-text-ad]

2015: Heat wave
> Location: India and Pakistan
In 2015, a heat wave hit India and Pakistan, reaching over 120°F and leading to the deaths of 4,000 people. According to the World Meteorological Organization, climate change made this event 30 times more likely. Delayed beginning of the monsoon season, lack of soil moisture, and urbanization further enhanced the devastation of the heat wave.
2015: Flooding
> Location: South Carolina
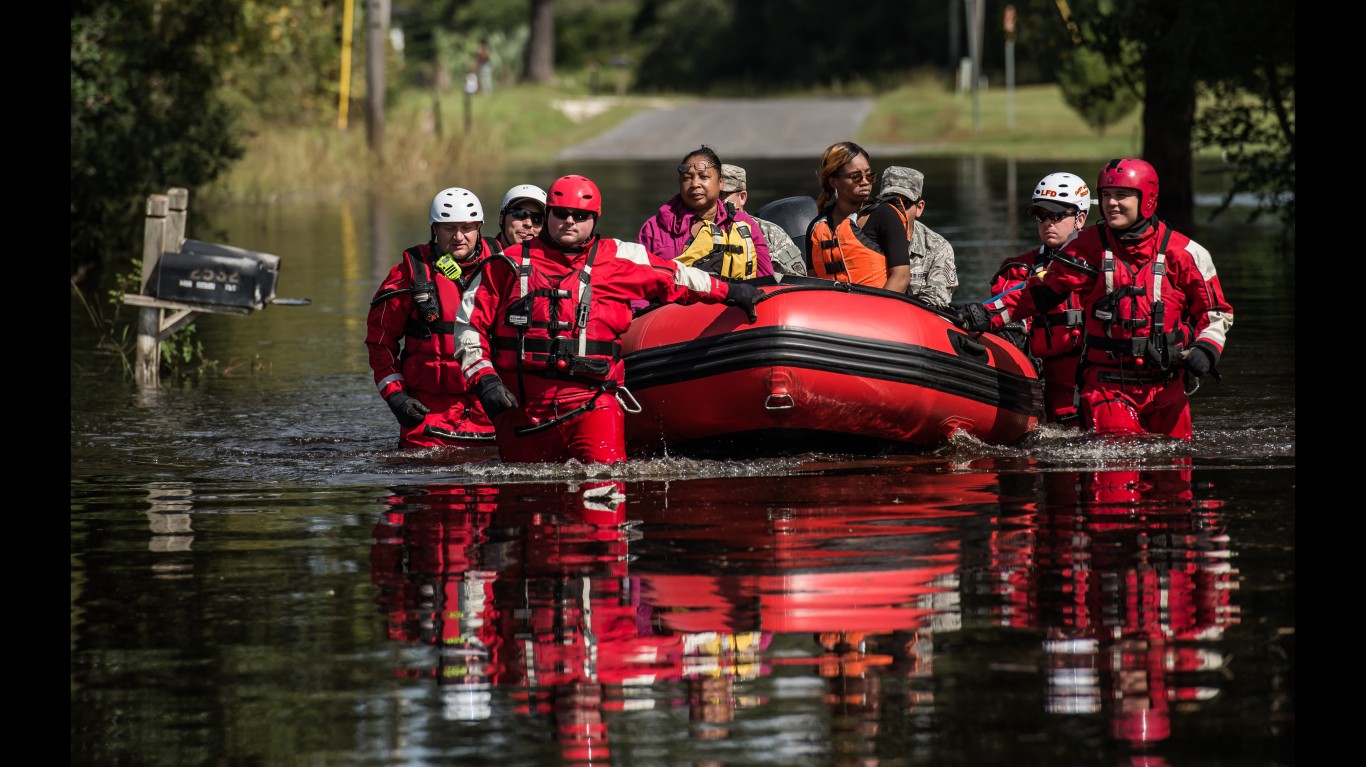
According to the National Hurricane Center, moisture from Hurricane Joaquin contributed to coastal, historic flooding in Charleston and Columbia, South Carolina. The event closed down a major highway and devastated local homes and businesses, resulting in 19 deaths and over $1.4 billion in damage.
2016: Flooding from Hurricane Matthew
> Location: North Carolina
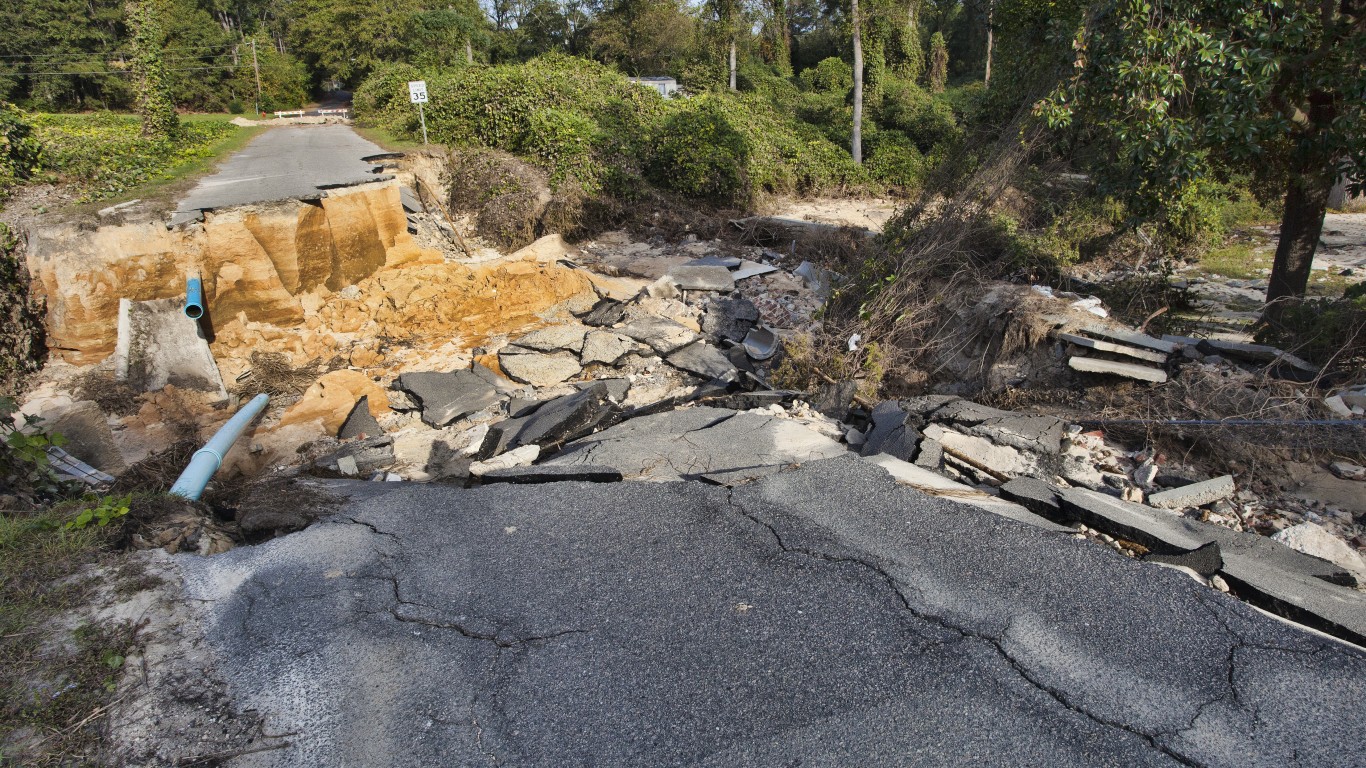
North Carolina experienced severe flooding in 2016, after it was hit by Hurricane Matthew. The storm brought excessive rainfall and a storm surge several feet above normal tidal levels, destroying thousands of structures and downing trees and power lines in both Carolinas. According to The National Weather Service, the flooding was responsible for 25 deaths in North Carolina alone. The storm and flooding caused an estimated $10.3 billion in damage..
[in-text-ad-2]
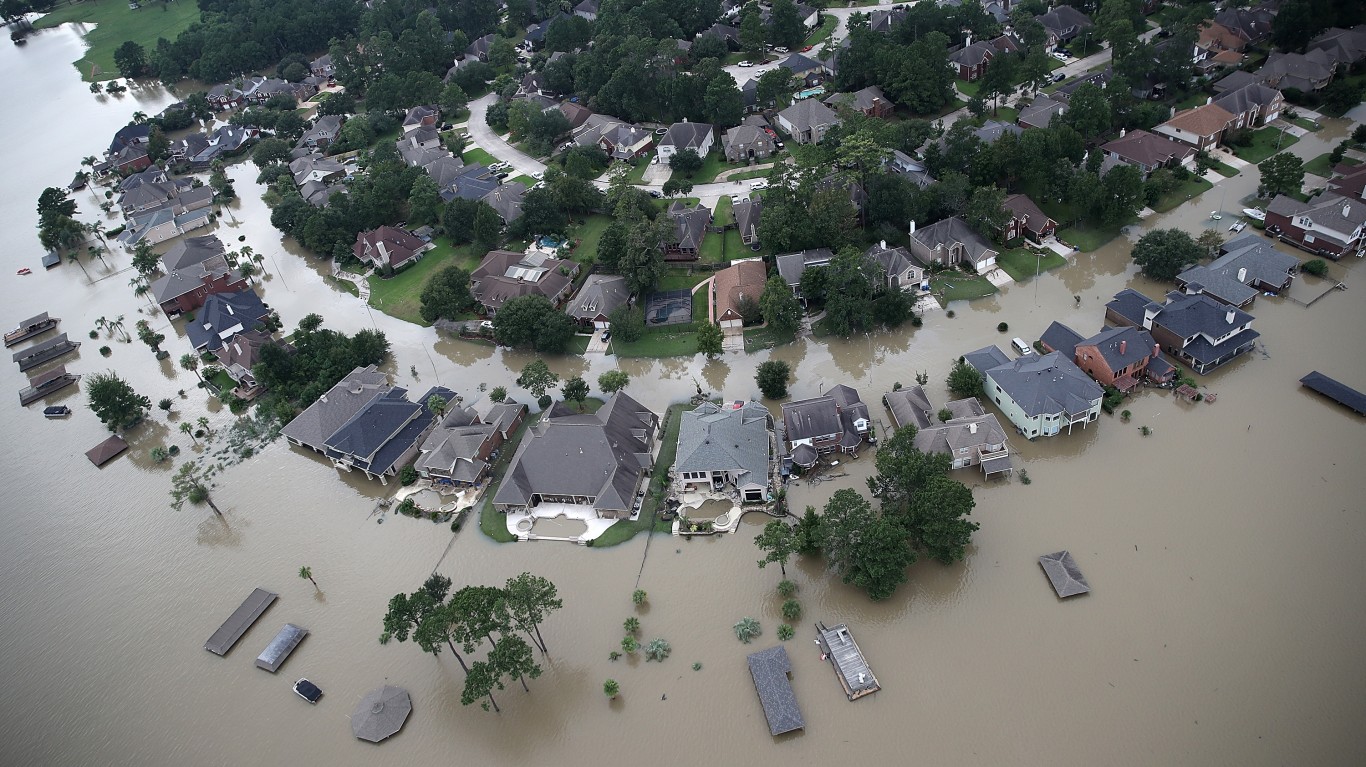
2017: Hurricane Harvey and floods
> Location: Texas coast
Hurricane Harvey was a record-breaking storm. It brought more extreme rainfall than any other tropical cyclone to hit the U.S. and was the second most costly, only topped by Hurricane Katrina. The storm’s extremely slow pace led to massive flooding across Texas, causing 68 deaths, $130 billion in damage, and evacuations of tens of thousands residents.
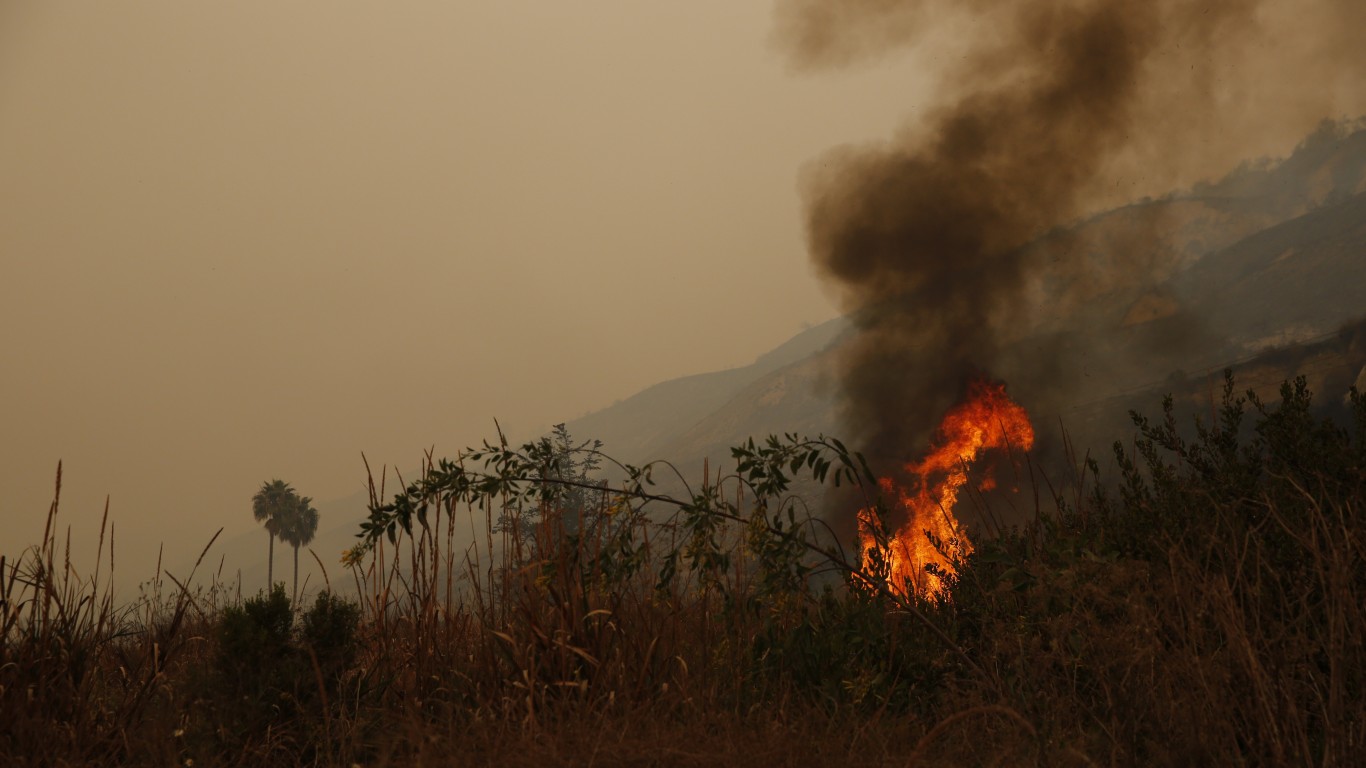
2017: Firestorm
> Location: California
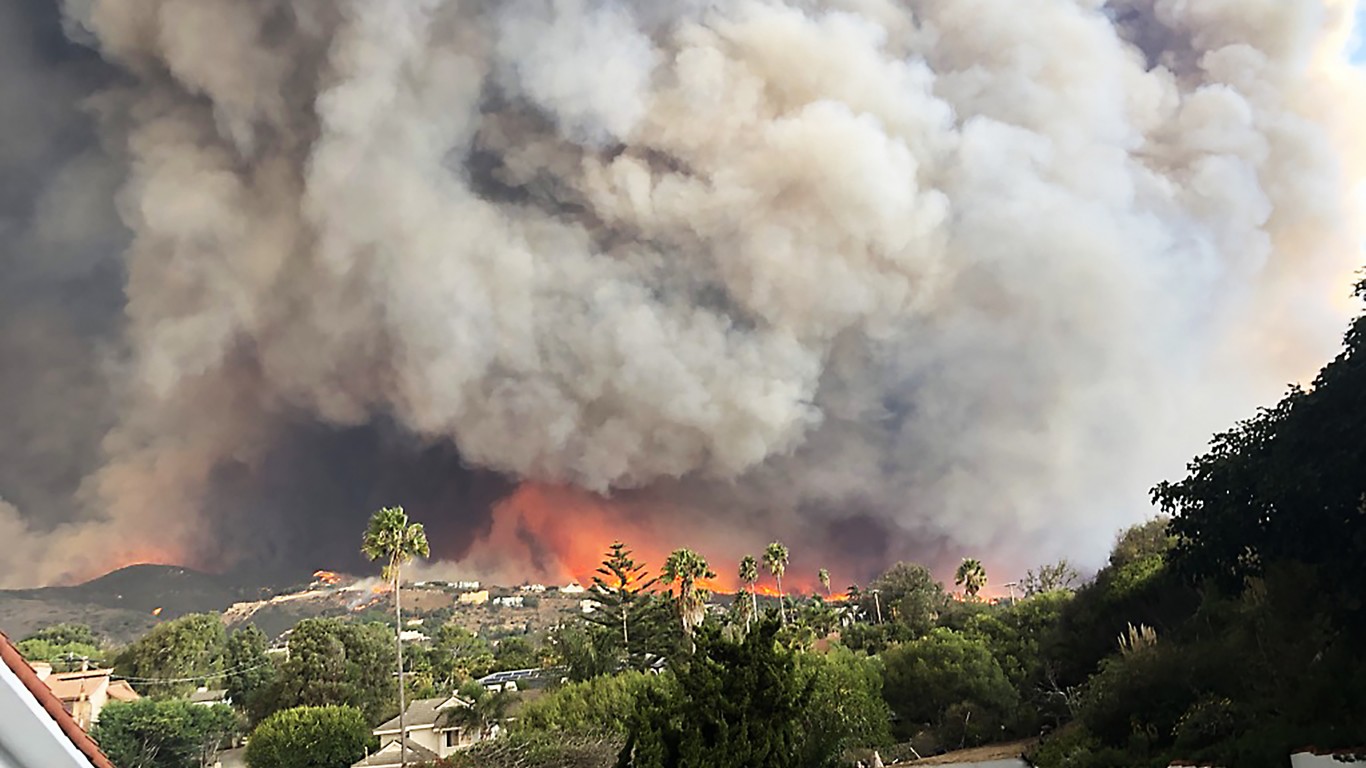
Years of minimal precipitation, drought, and high temperatures have contributed to yearly wildfires across the state of California in the last decade. In October 2017, red-flag warnings were issued by the National Weather Service, predicting high wind gusts in Northern California with a risk of fire. Soon after, rapidly-spreading wildfires ravaged Napa and Sonoma Counties, stoked by 70-mph winds. The firestorm resulted in 25 deaths and $10 billion worth of damage, affecting thousands of homes and businesses.
[in-text-ad]
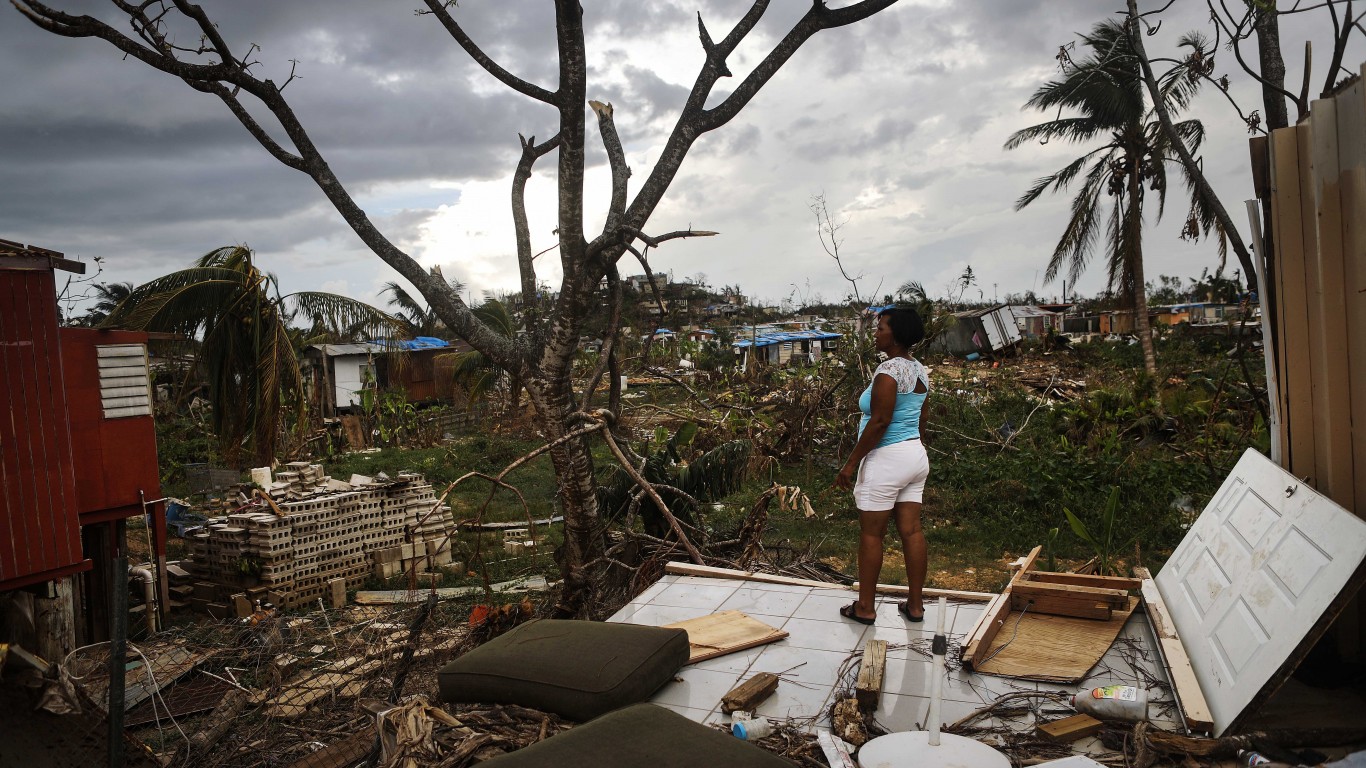
2017: Hurricane Maria
> Location: Puerto Rico
In 2017, Puerto Rico was hit by Category 4 Hurricane Maria, a storm that caused $23 billion worth of damage. The island has still not recovered from the cyclone. While scholars differ in their analysis of storm-caused death estimates, Maria is attributed to between 2,975 and 4,645 deaths. Further, the U.S. territory’s electrical grid and power lines were destroyed, leaving residents without electricity for months following the hurricane.
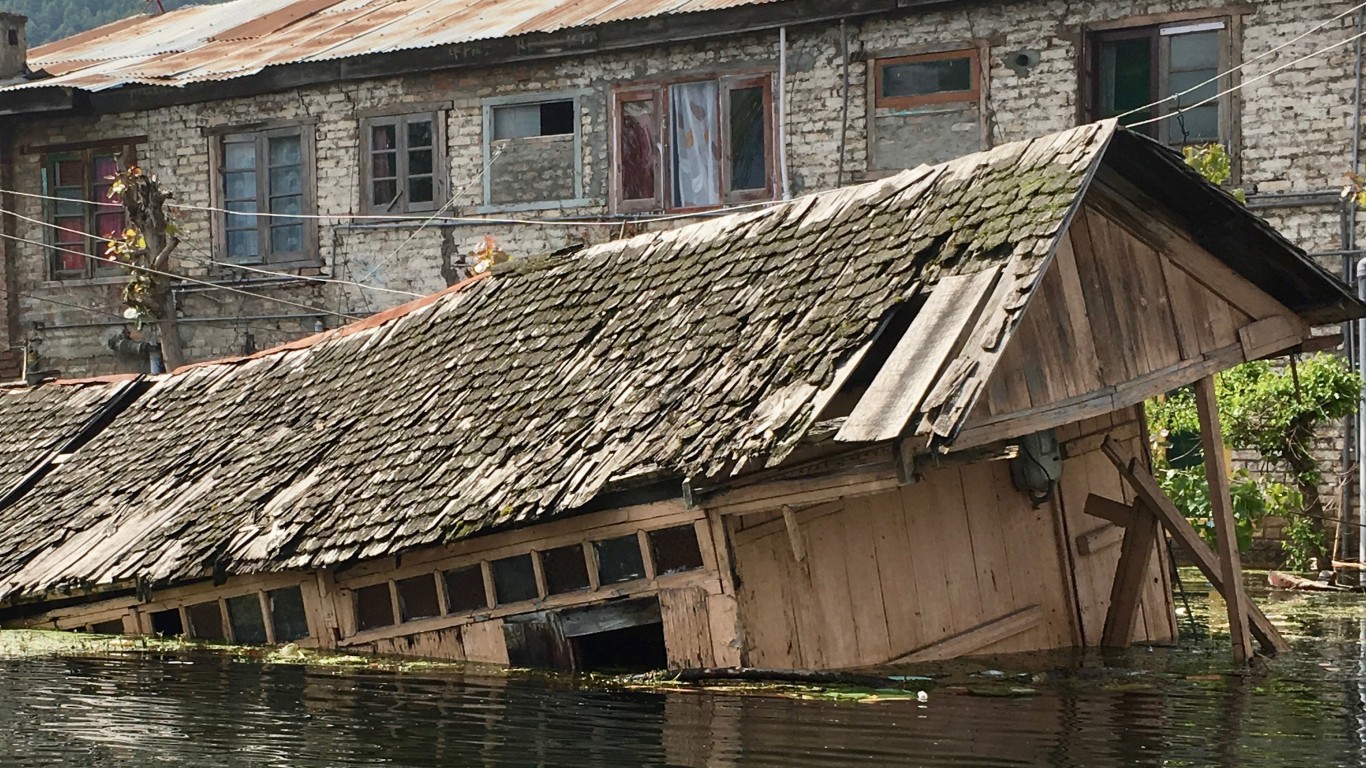
2017: Floods
> Location: South Asia
While South Asia’s monsoon season typically causes some flooding, climate change has contributed to flooding at unsafe levels, as happened in Bangladesh, Nepal, India, and Pakistan in 2017. Over 1,000 people died as a result of the extreme rainfall event. Climate change poses a risk during monsoon season – when global temperatures rise, both atmospheric water vapor and ocean temperatures increase, perpetuating extreme storms. The Asia-Pacific SDG Partnership estimates the cost of the 2017 flooding during the monsoon season to be $1.2 billion.

2018: Firestorm
> Location: California
2018 brought more destructive wildfires to Northern California. The Camp Fire, which occurred in November and caused 85 fatalities, was California’s deadliest. Paradise, California, was particularly hard hit, losing nearly all of its structures to the blaze. According to Wildfire Today, the Camp Fire caused $422 billion in damages.
[in-text-ad-2]
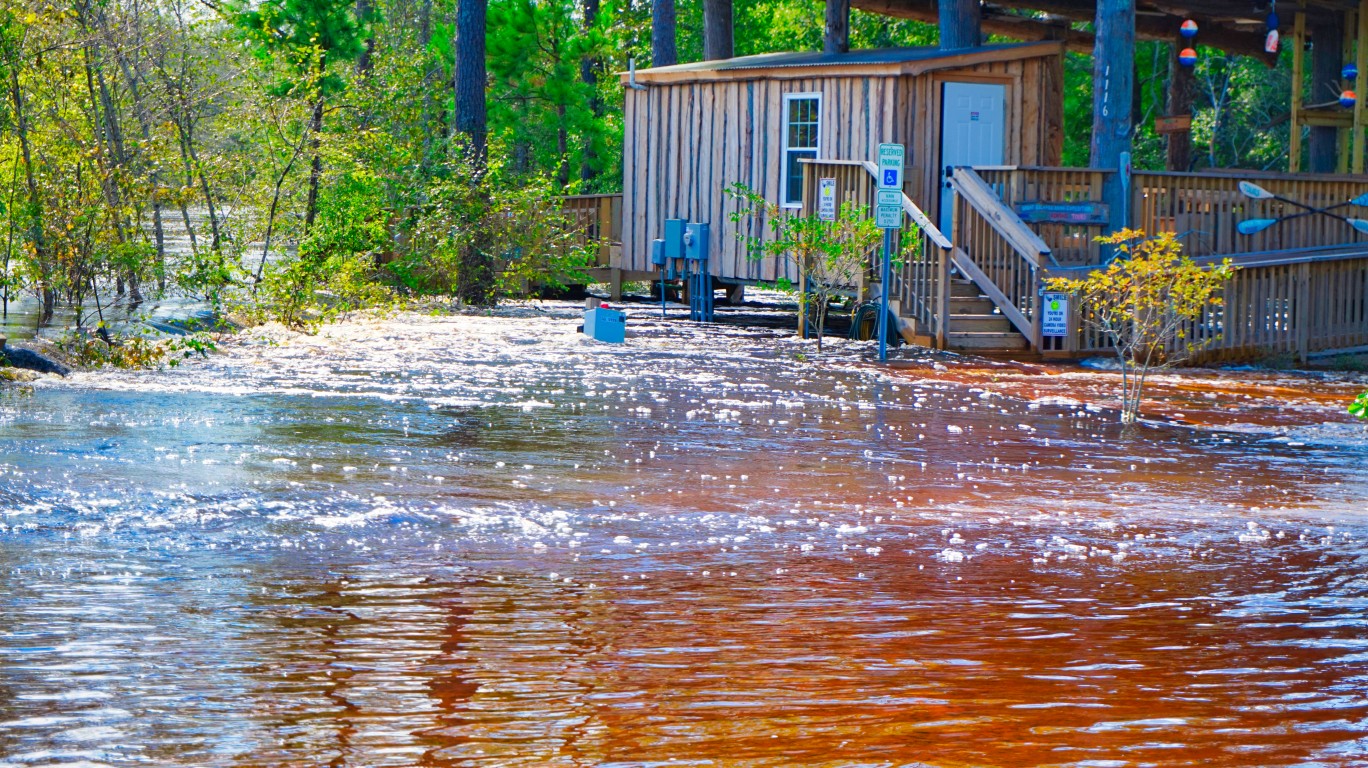
2018: Flooding from Hurricane Florence
> Location: North and South Carolina
Hurricane Florence was both deadly and costly for the Carolinas. While the storm was rated a Category 1, its slow-moving nature allowed for record-levels of rainfall, which caused flooding, wind, storm surge, and significant damage. The National Weather Service estimates the hurricane caused 42 fatalities and $24.5 billion in damage.
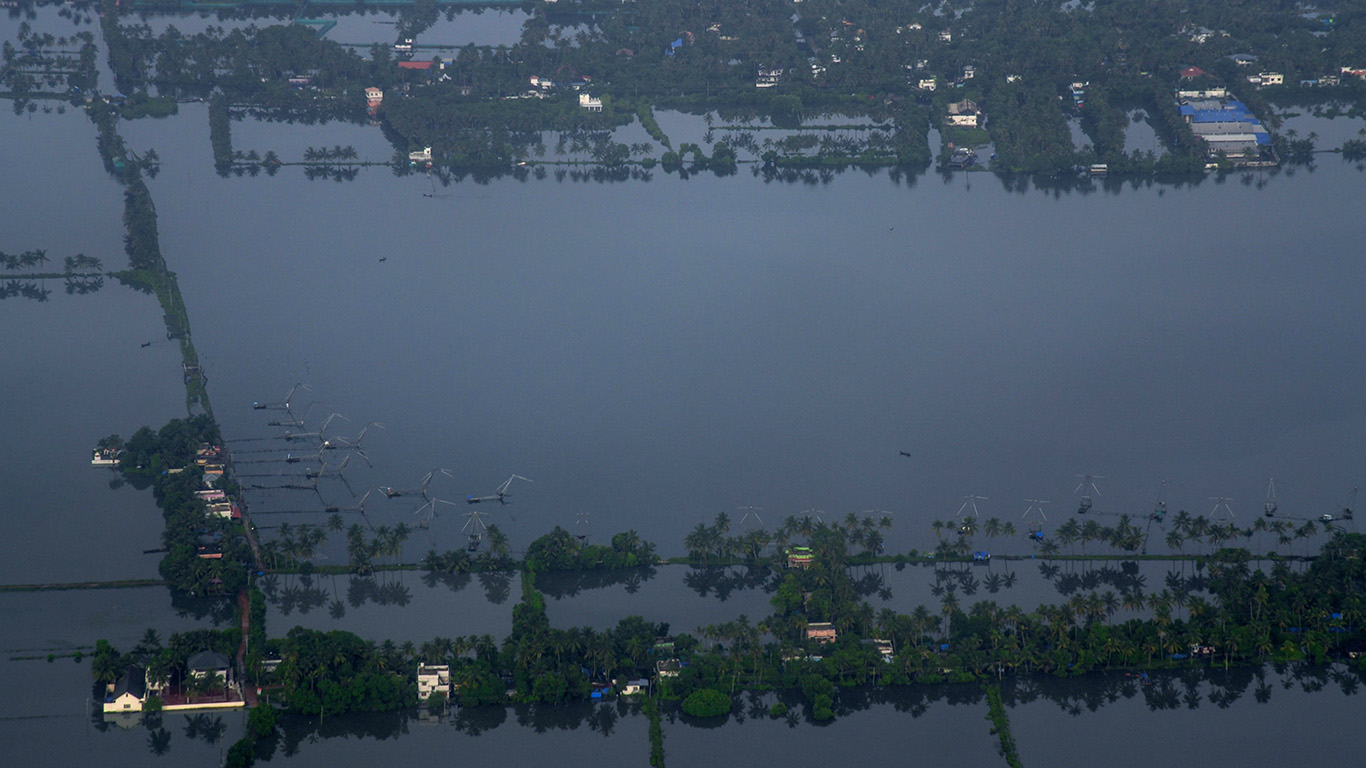
2018: Flooding from monsoon
> Location: Kerala, India
Torrential downpours during monsoon season caused deadly flooding in Kerala, India. The precipitation event triggered mudslides, killing more than 324 people, displacing at least 1.4 million, and costing $3.7 billion in losses. While climate change contributed to the low pressure system that made the monsoon storm worse, environmental scientists also pointed to deforestation as a cause of the excessive destruction.
[in-text-ad]
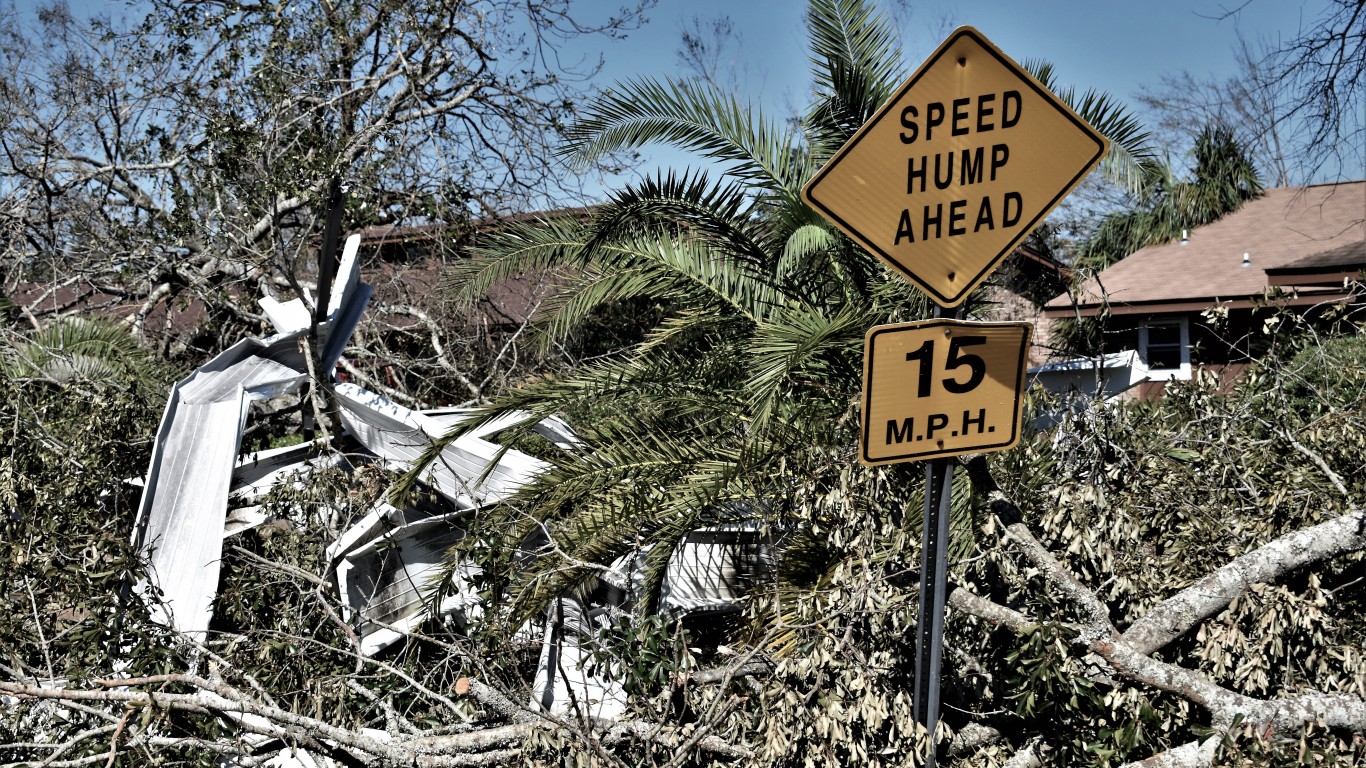
2018: Hurricane Michael
> Location: Florida
The cause of a 14-foot storm surge and extreme winds, Hurricane Michael was rated Category 5 when it made landfall in Florida, one of only four storms of that strength to reach U.S. land since 1850. It continued into Georgia at Category 3 strength, spawning damaging tornadoes. The hurricane caused at least 43 fatalities and more than $5.7 billion worth of damage.
2018-19: Northern Hemisphere heat waves
> Location: Northern Hemisphere
The summers of 2018 and 2019 broke heat records in Germany, Belgium, France, and the Netherlands. Paris hit its highest temperature of 108.7°F in July of 2019, and there were over 3,951 heat wave-related deaths in Europe that summer. These high temperatures are part of a bigger trend, with a study on the Northern Hemisphere heat waves calling the phenomena a “new climate regime.”
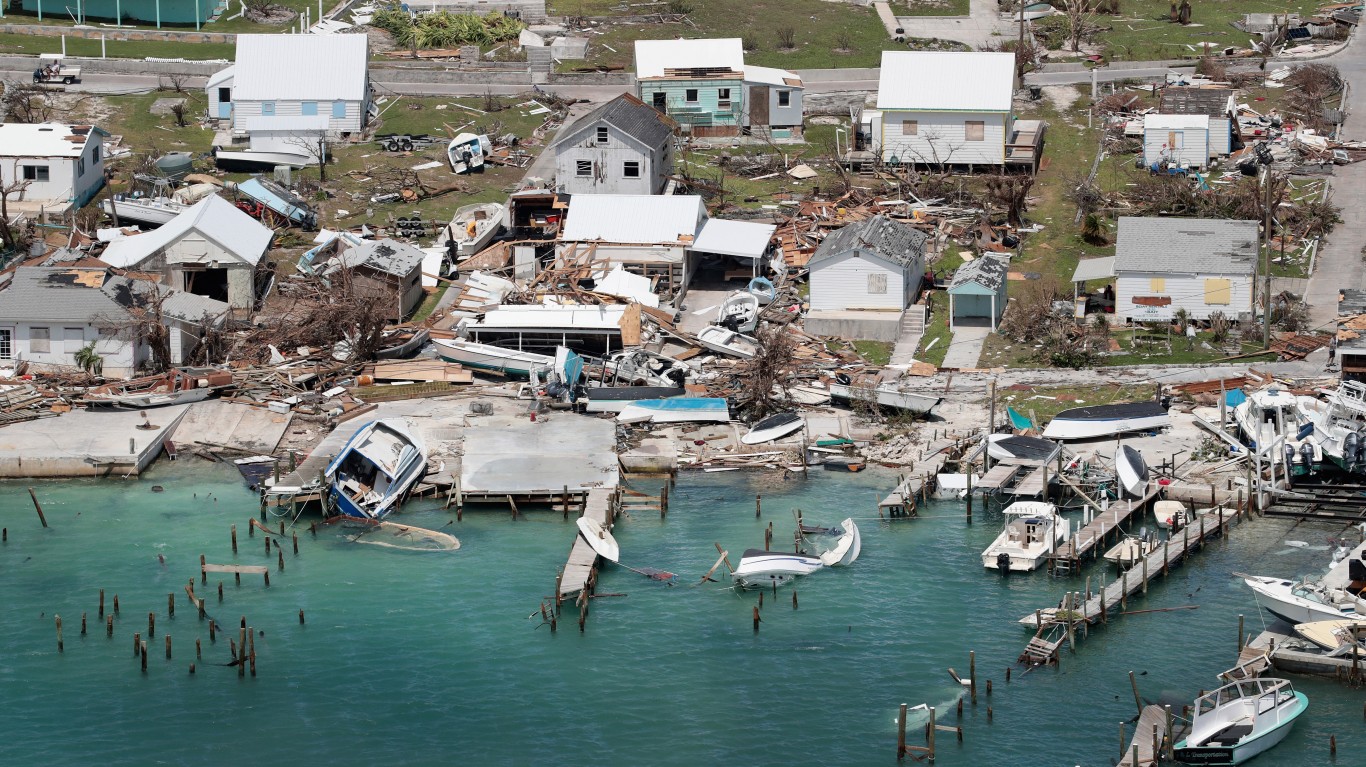
2019: Flooding from Hurricane Dorian
> Location: North Carolina Outer Banks
Dorian caused catastrophic damage in the Bahamas, mainly in Abaco and eastern Grand Bahama Islands, where at least 74 people died and a total damage estimated at $3.4 billion. After hitting the Bahamas, Dorian swept through the North Carolina Outer Banks in September, 2019, resulting in a large storm surge, high winds, and tornadoes. Hit especially hard was Ocracoke Island, where many of the homes were destroyed. The storm caused three fatalities in North Carolina as well as $1.6 billion in damage.
[in-text-ad-2]
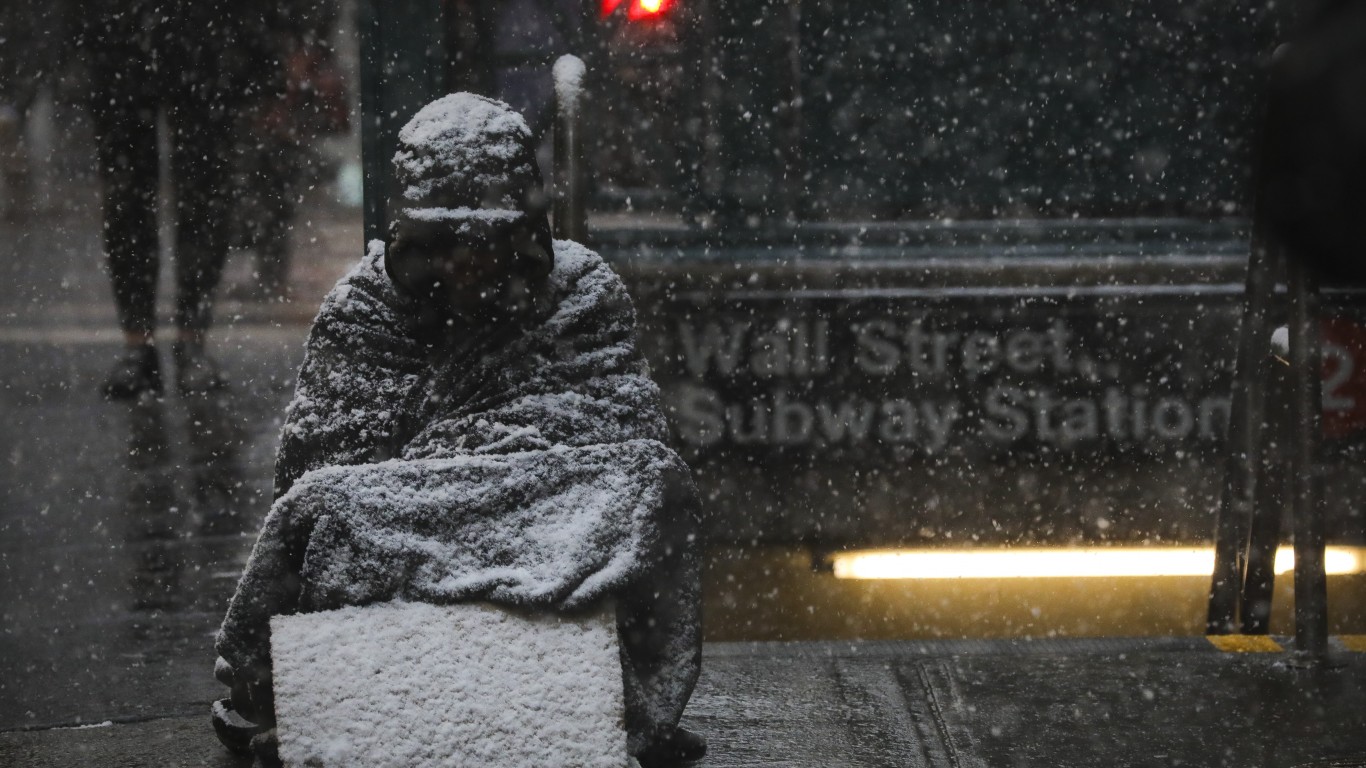
2019: Polar vortex
> Location: Midwest America
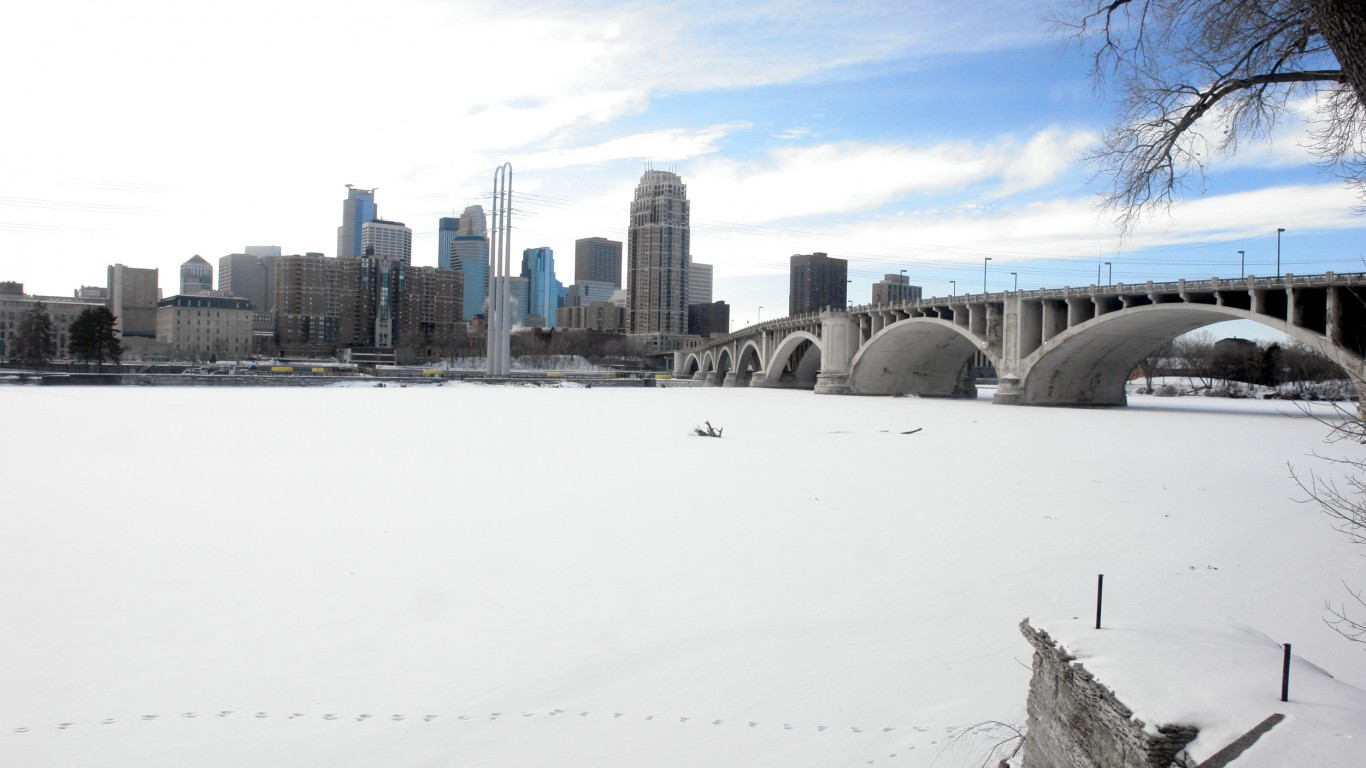
Residents of the U.S. Midwest and Canadians in the mid and eastern parts of the country experienced temperatures that were colder than parts of Antarctica during the 2019 Polar Vortex. Wind chills resulted in temperatures of -30 to -60 degrees Fahrenheit. At least eight deaths and 50 cases of frostbite were recorded. In some places, schools closed, the U.S. Postal Service was forced to pause deliveries, flights were grounded, and local businesses halted operations. The cold weather also affected Southern states like Alabama and Mississippi.
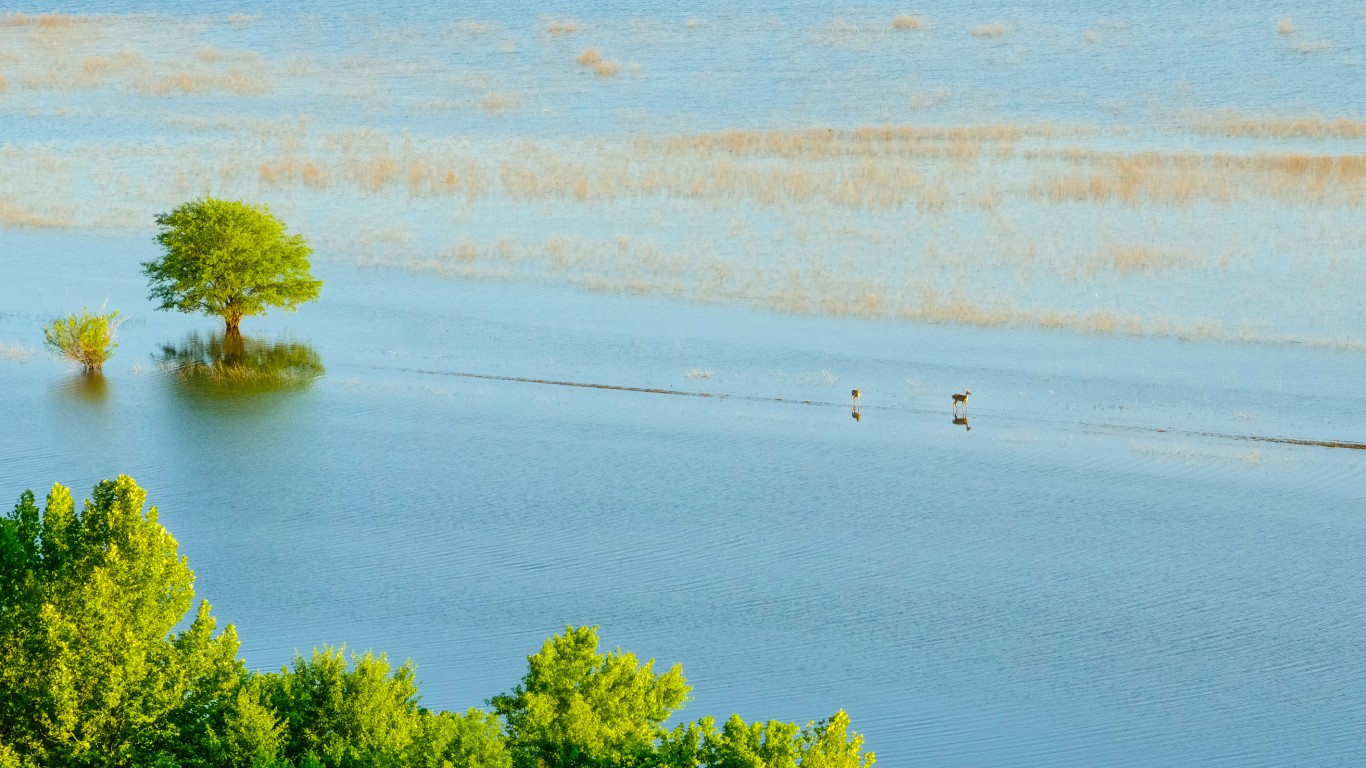
2019: Flooding
> Location: Missouri, Mississippi Valleys
After being hit by a bomb cyclone that brought heavy snow and blizzard-strength winds, multiple regions, including Missouri and the Mississippi Valley, experienced significant, record-breaking river flooding. The event prompted evacuations, broke levees, and set new record river levels. In Nebraska, losses were estimated at nearly $1 billion due to affected agriculture and livestock.
[in-text-ad]
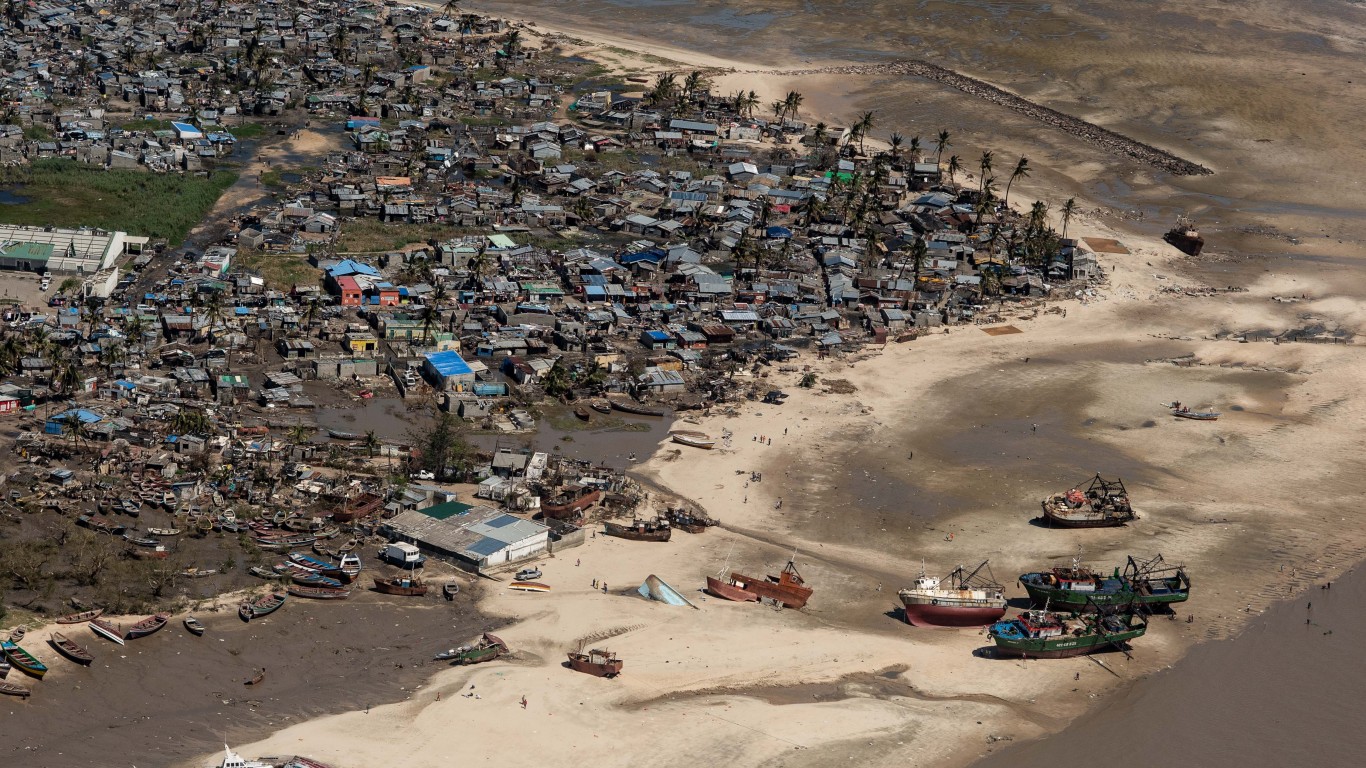
2019: Cyclone Idai
> Location: Mozambique, Malawi and Zimbabwe
Taking more than 1,000 lives and causing $773 million in damage, Cyclone Idai devastated Mozambique, Malawi, and Zimbabwe in 2019. The storm brought torrential rain, flash floods, and damaging winds, affecting millions in the area. Portions of the region are below sea level, which was catastrophic for local agriculture and infrastructure.
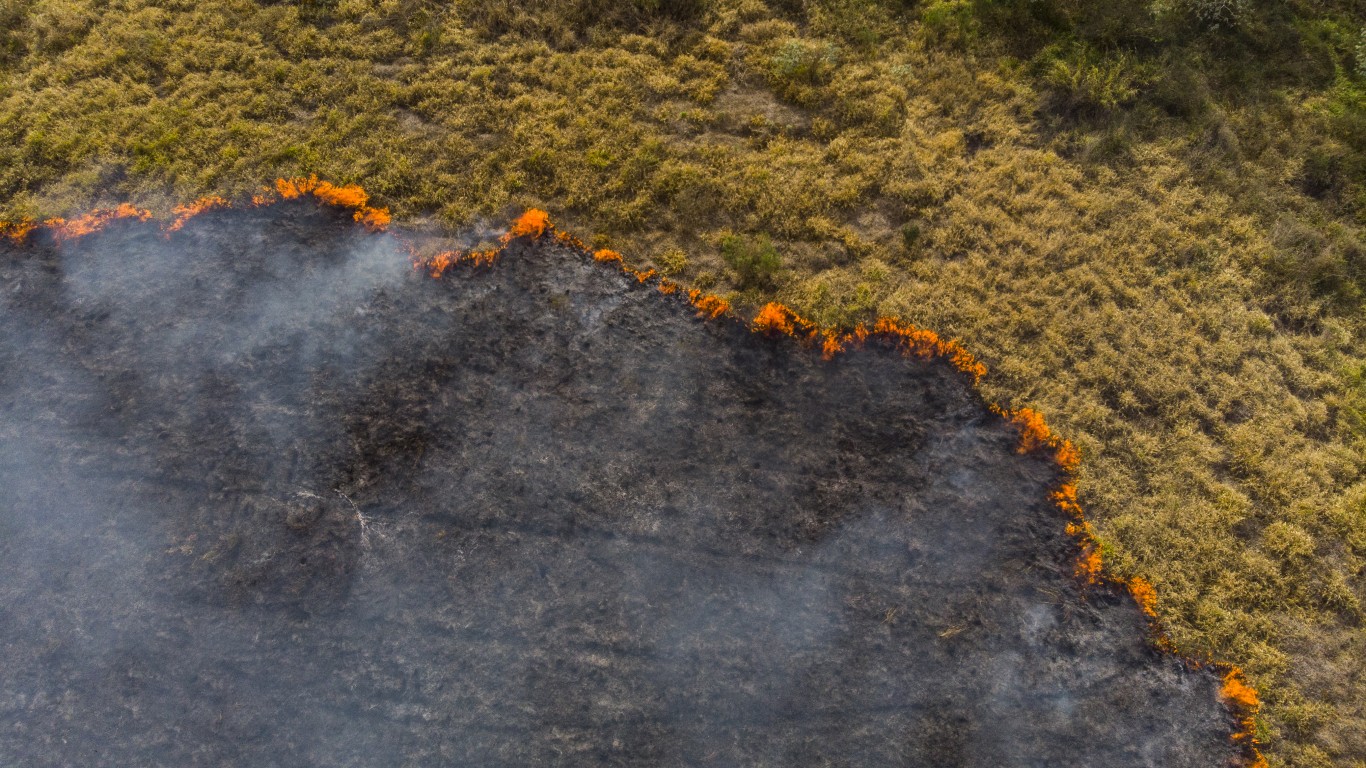
2019: Wildfires
> Location: Brazil, Australia, Siberia, Alaska
Wildfires in 2019 spanned the globe, with destructive fires in California. Brazil, Australia, Siberia, and Alaska. In Siberia and Alaska, high temperatures, limited rainfall, high winds, and lightning contributed to the wildfires. One study estimates that wildfires in Brazil killed 17 million animals, and Australia’s bushfires raged into 2020, destroying homes and prompting evacuations.
2020: Two hurricanes
> Location: Central America
The 2020 hurricane season was so prolific that the Greek alphabet was utilized for naming new storms beyond the initial 21 named with the regular alphabet. Two of these were Hurricane Iota and Hurricane Eta, both Category 4 storms that impacted Central America. Hurricane Eta caused the most fatalities of any tropical cyclone in 2020, with 274 dead or missing and $8.3 billion in damages. Hurricane Iota killed 84 and caused $1.4 billion in damages.
[in-text-ad-2]
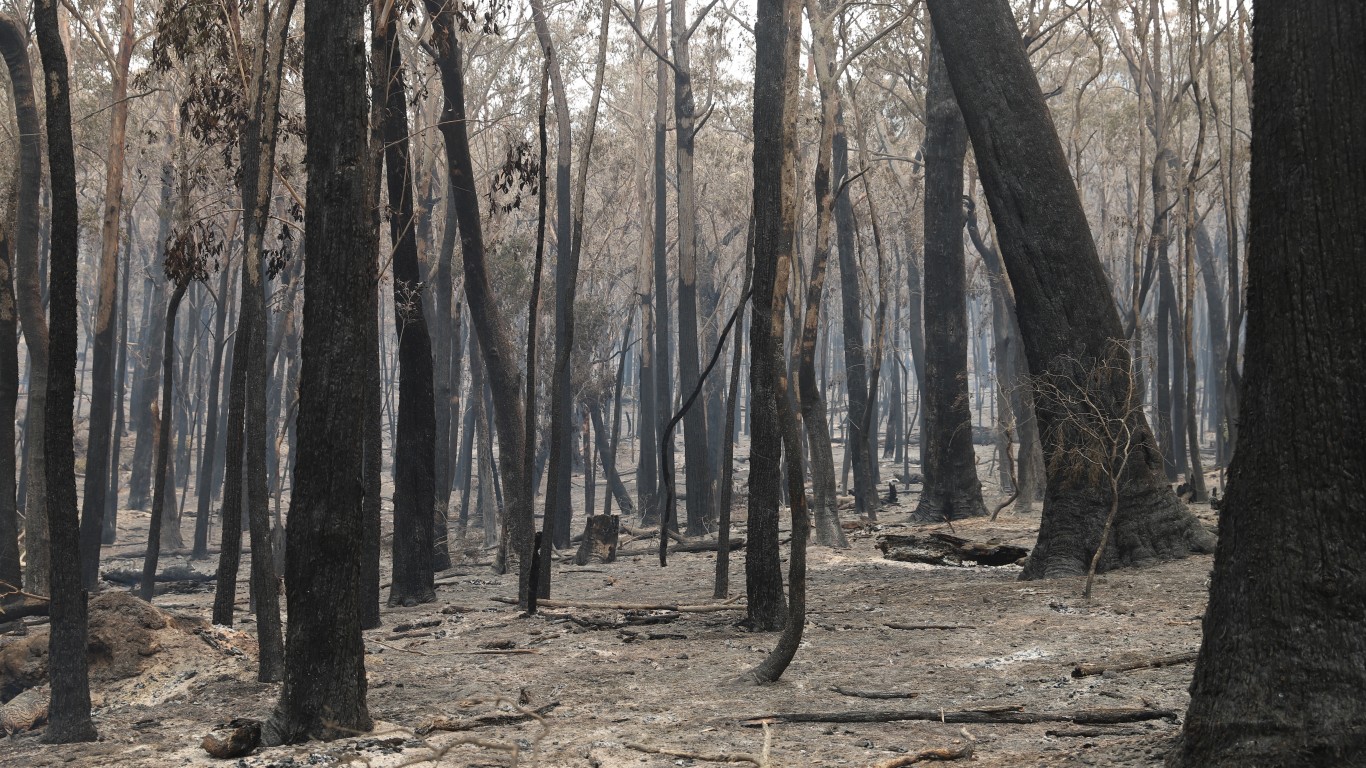
2020: Bushfires
> Location: Australia, U.S.
The bushfires in Australia that began in 2019 continued into 2020, burning over 46 million acres and destroying thousands of homes. Meanwhile, extremely high temperatures, low precipitation, and high winds in the Western U.S. triggered devastating wildfires there. In the U.S. 43 fatalities were recorded as a direct result of the wildfires, though additional deaths are attributed to smoke inhalation – smoke lasted for weeks in fire-affected areas.
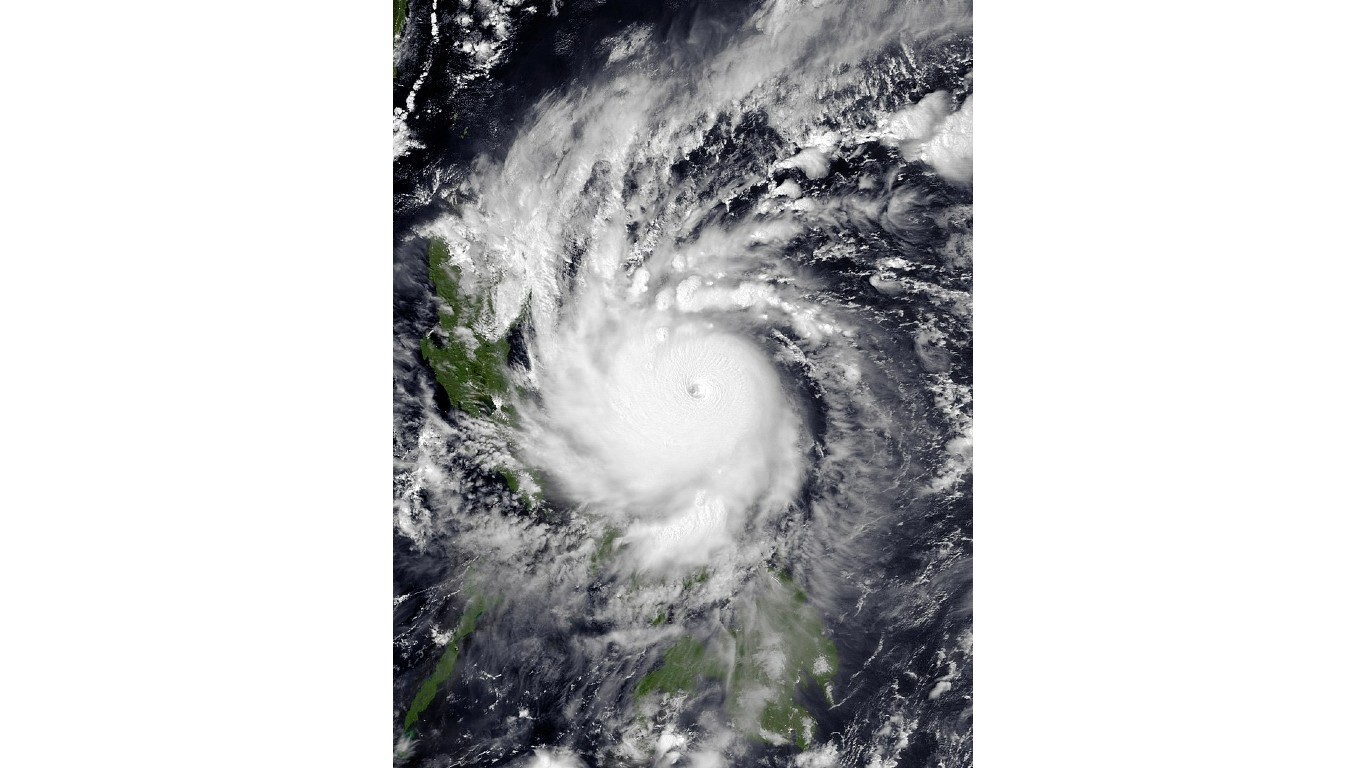
2020: Super Typhoon Goni
> Location: Philippines
Super Typhoon Goni was named the strongest tropical cyclone to make landfall in the history of the world. The storm hit Catanduanes Island in the Philippines in November of 2020, killing 31 people and destroying hundreds of thousands of homes, at an estimated $415 million worth of damage.
[in-text-ad]

2020: Hottest Day in Death Valley
> Location: Death Valley, California
While the world record for highest temperature remains at 134°F, this Death Valley record is considered unreliable and has been disputed. Instead, 2020’s record of 129.9°F in the same locale may be considered the more reliable reading and is set to become the new record, once it is fully reviewed by the World Meteorological Organization.
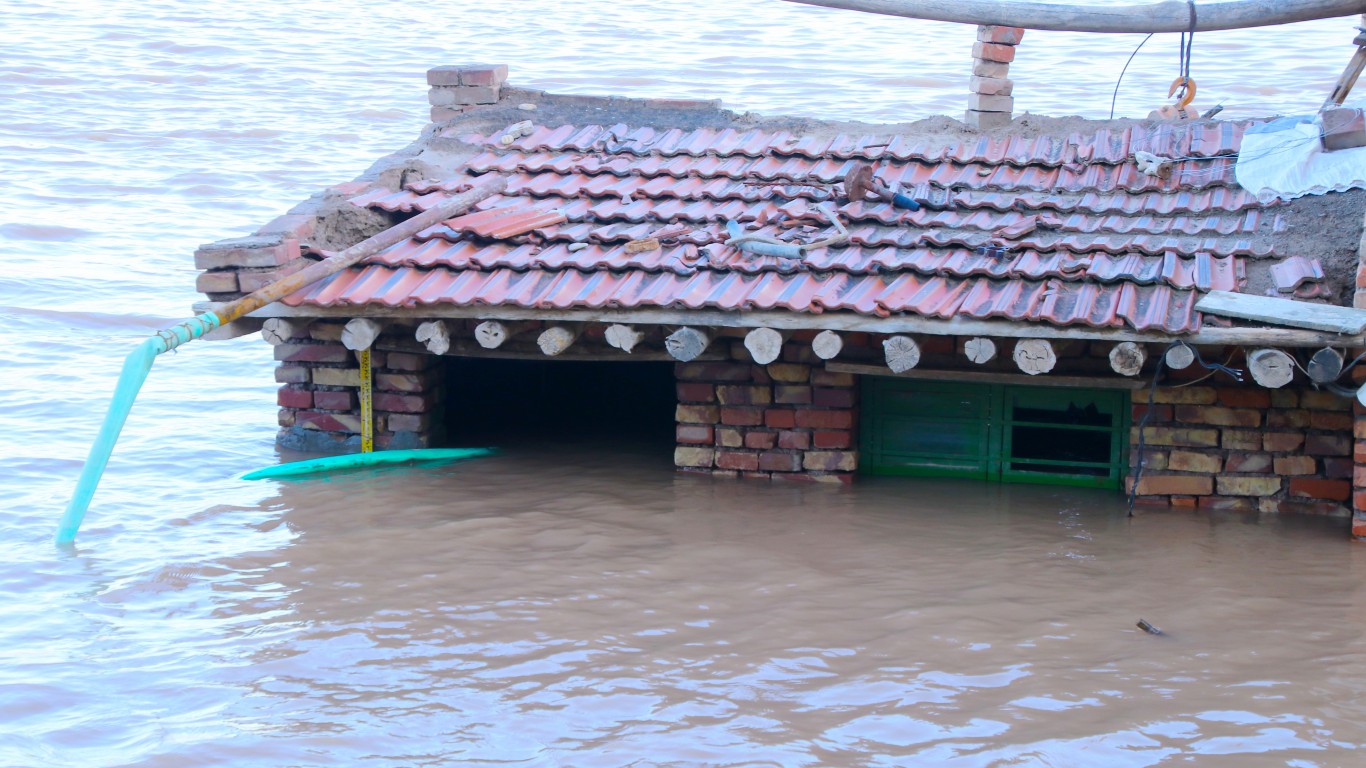
2020: Seasonal monsoon flooding
> Location: China
In 2020, China’s monsoon season caused extreme flooding, which led to the deaths of 278 people and affected over 70 million more. The deluge also damaged at least 1.4 million homes and businesses, causing an estimated $32 billion in damage.
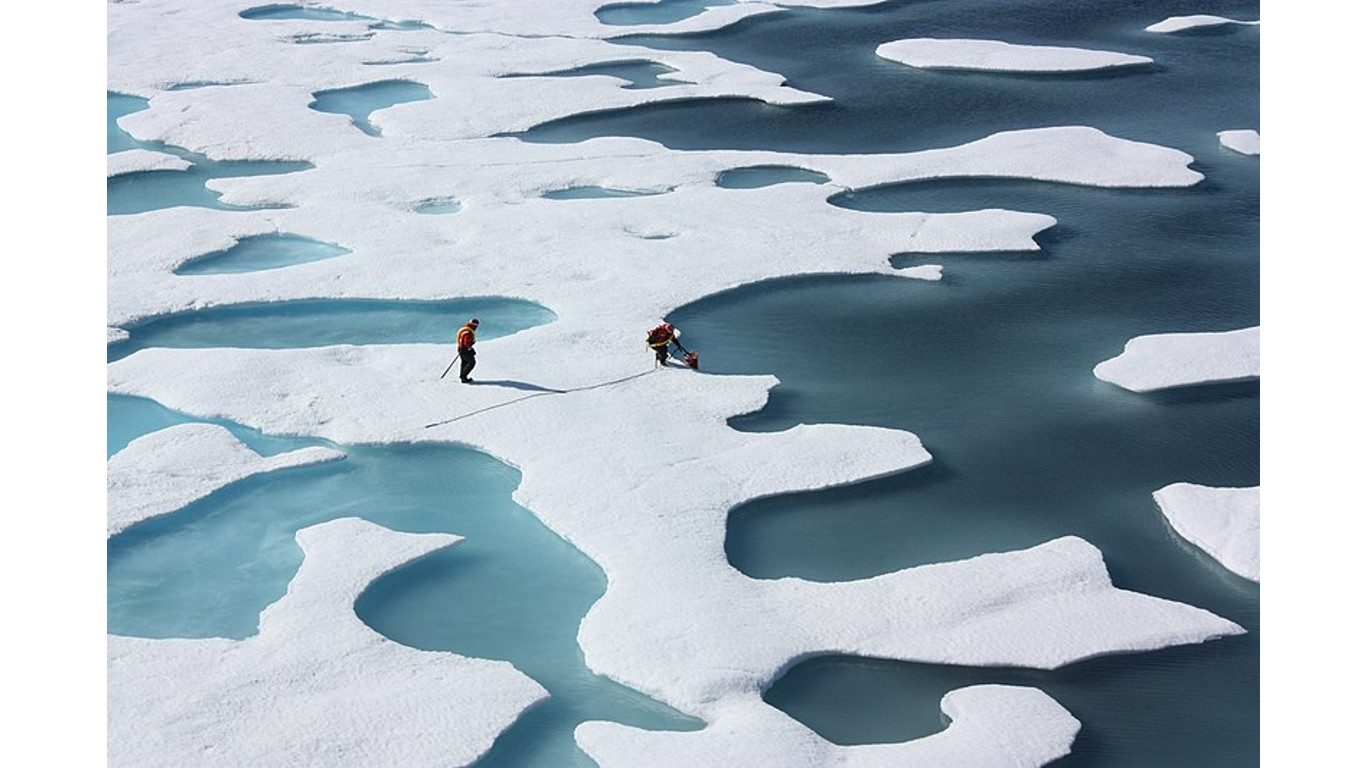
2020: Low Arctic ice
> Location: Arctic
In September, 2020, arctic sea ice melted to an extreme low point, the second-lowest ever recorded. Scientists predict that all summer ice in the Arctic will have melted by 2050, only freezing again during winters. This climate change-related event is more directly linked to carbon dioxide emissions.
[in-text-ad-2]
2020-21: Drought
> Location: California
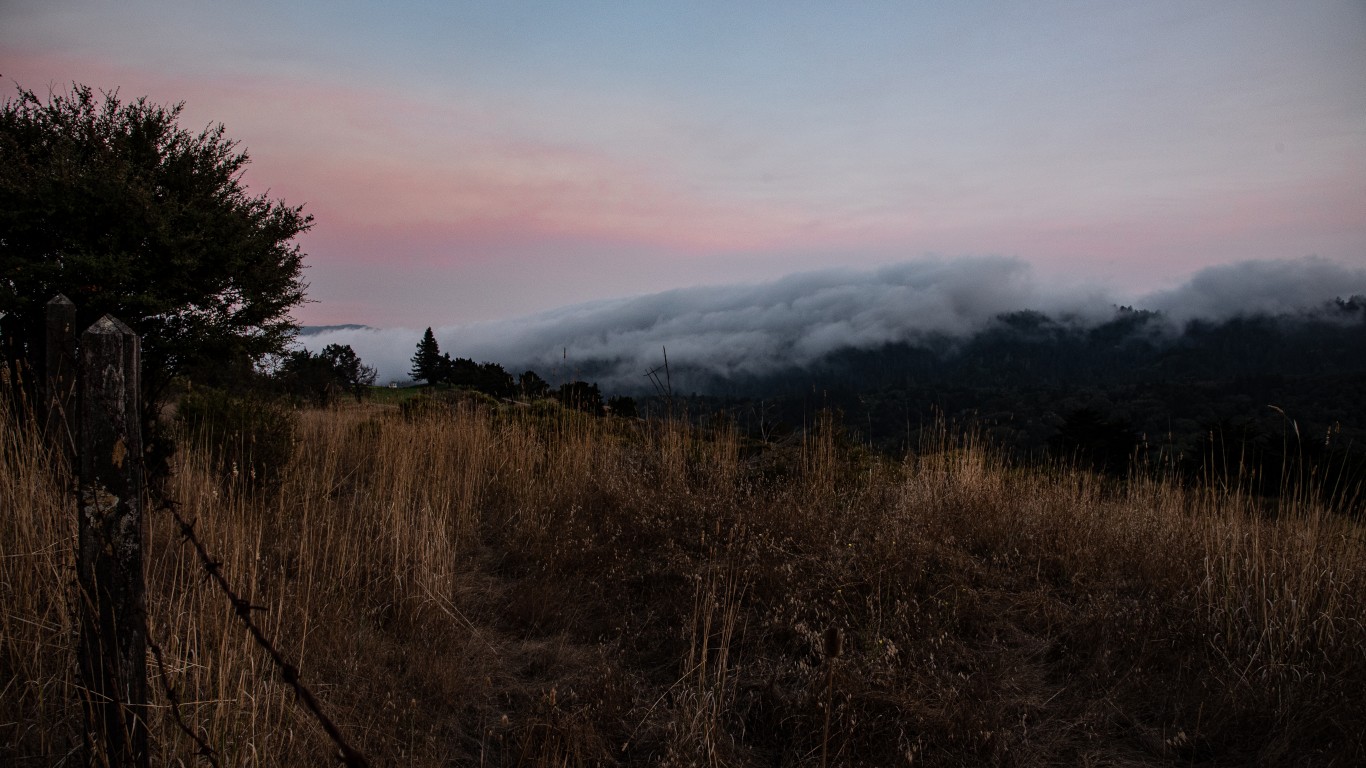
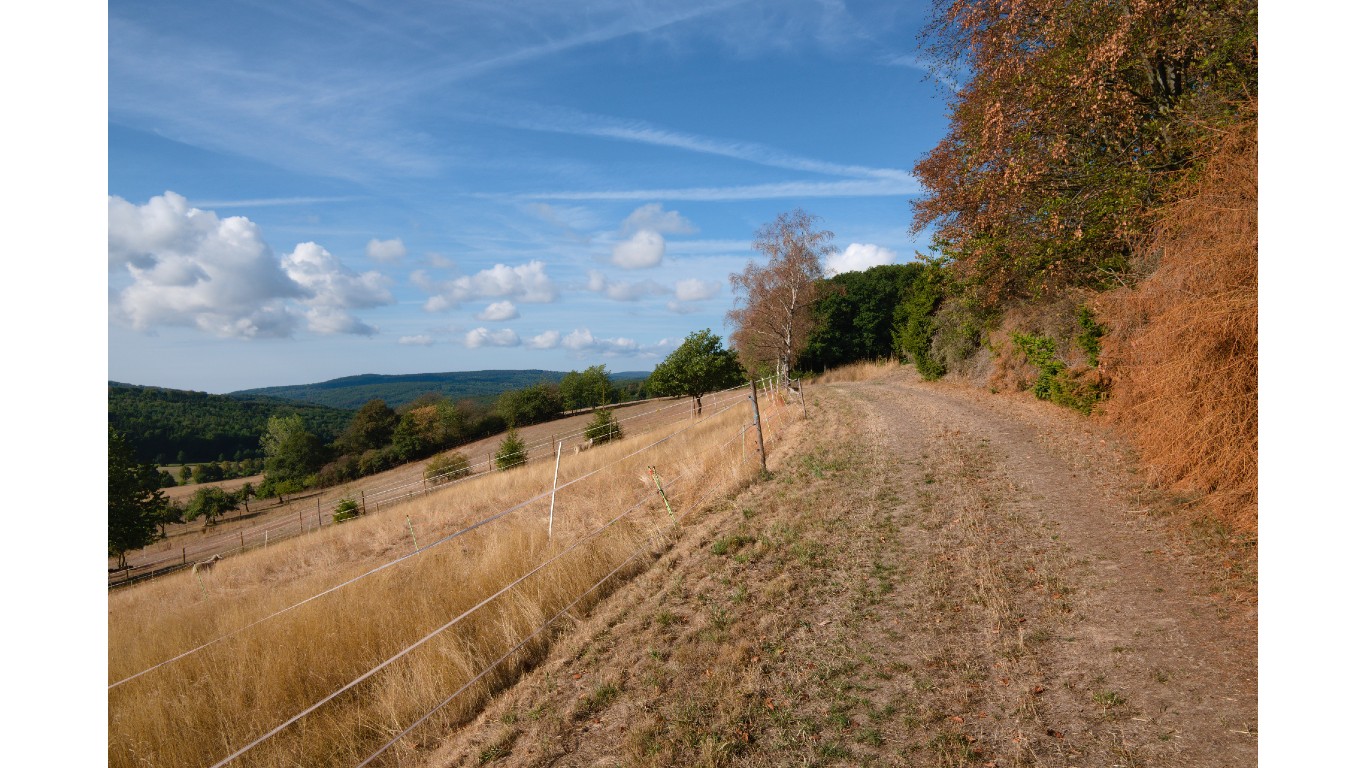
Between increasing temperatures and minimal rain, California has faced some of its driest years on record, with the 2020-2021 season being the second driest in 100 years. When temperatures are high, water in watersheds evaporates, resulting in drought and aridification. The drought has negatively impacted California’s economy, with $1.1 billion in losses, and it is dangerous for future wildfires.
2021: Heat wave
> Location: Northwest U.S., British Columbia
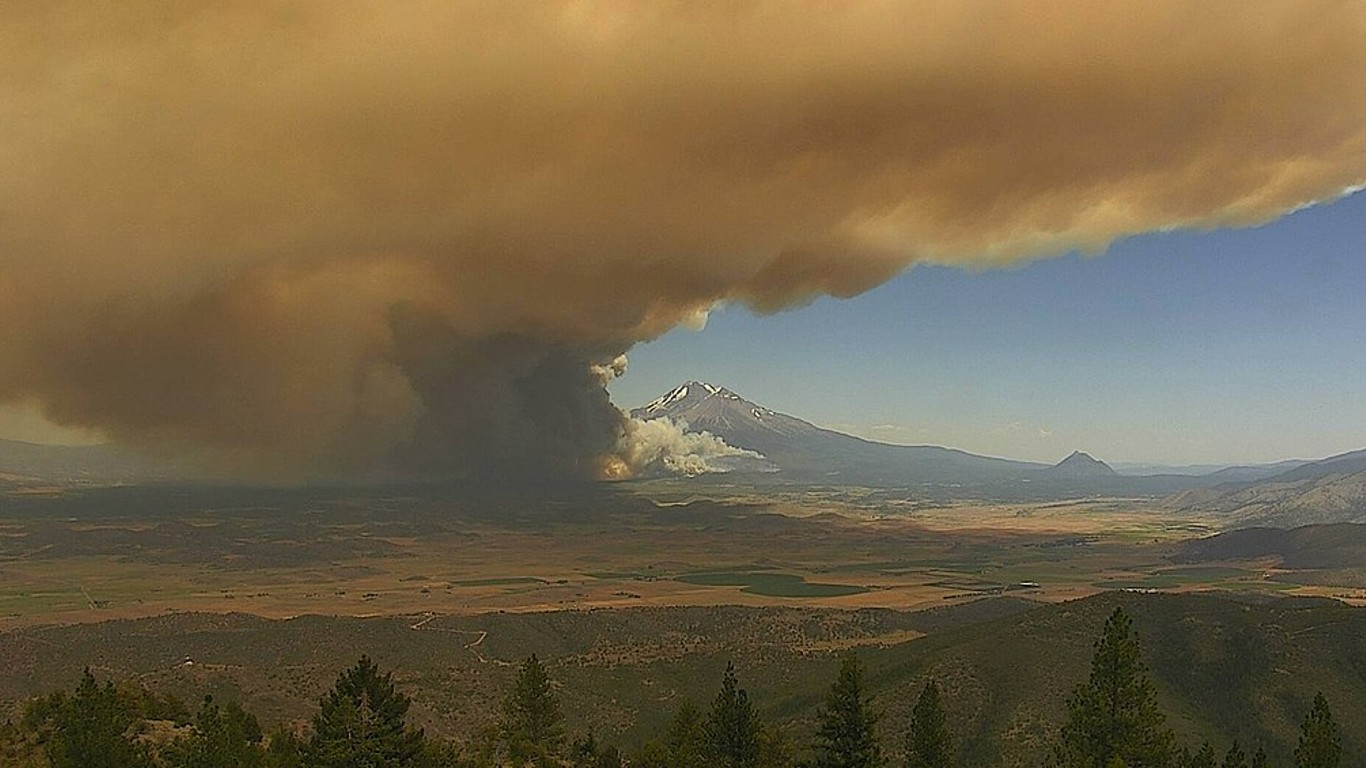
While the Pacific Northwest is known for its rainy weather through much of the year, increasing temperatures are having an impact. The summer of 2021 saw soaring, record-breaking temperatures in the region, according to NOAA, some of the hottest in 126 years. Washington and Oregon were struck by temperatures exceeding 100 degrees. The heat wave resulted in 211 fatalities. British Columbia experienced similarly extreme temperatures, and hundreds of heat-related deaths.
[in-text-ad]
2021: Flooding
> Location: Europe
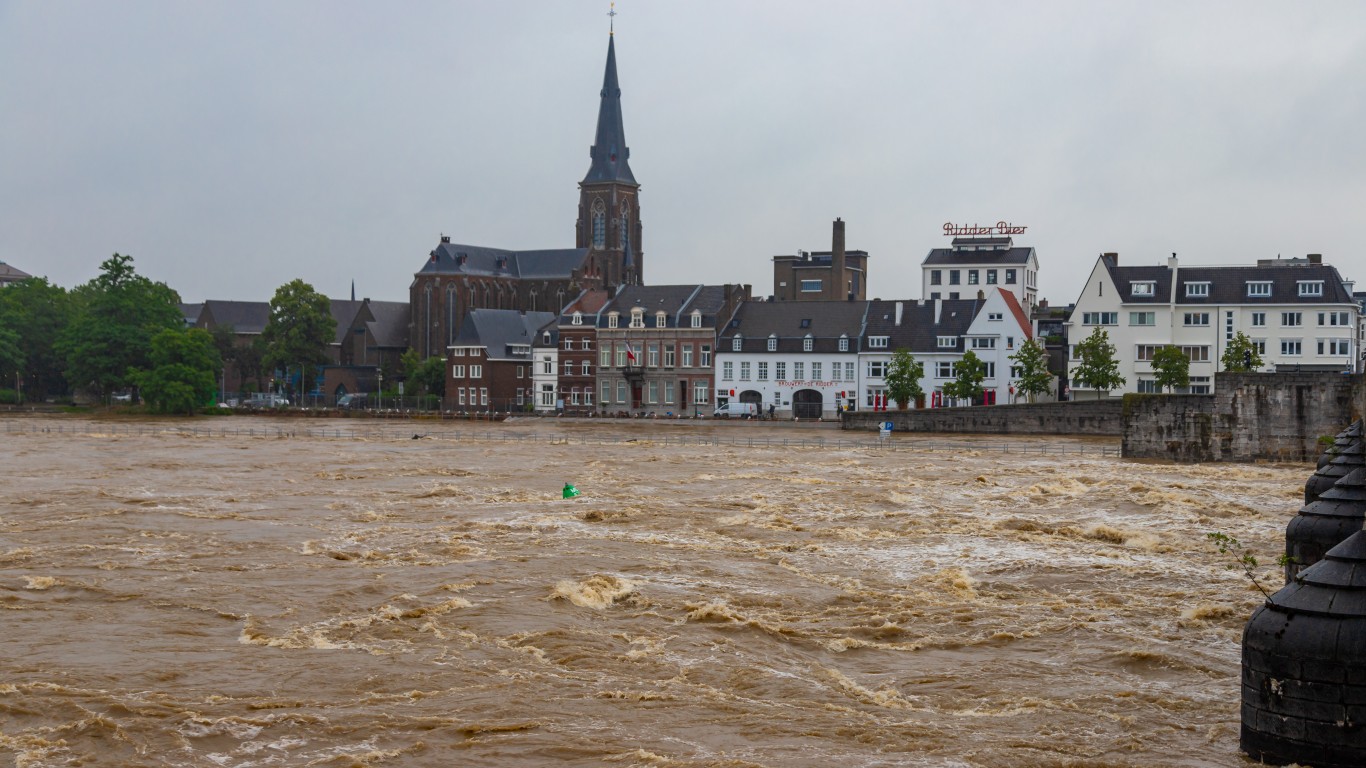
Over 200 were killed during extreme flooding in Western Europe, including people in Germany, Luxembourg, Belgium, and the Netherlands. The event was linked to climate change – increases in global temperatures contributed to wetter weather from more water vapor in the air. The floods caused an estimated $40 billion in damages.
2021: Agriculture frozen
> Location: France
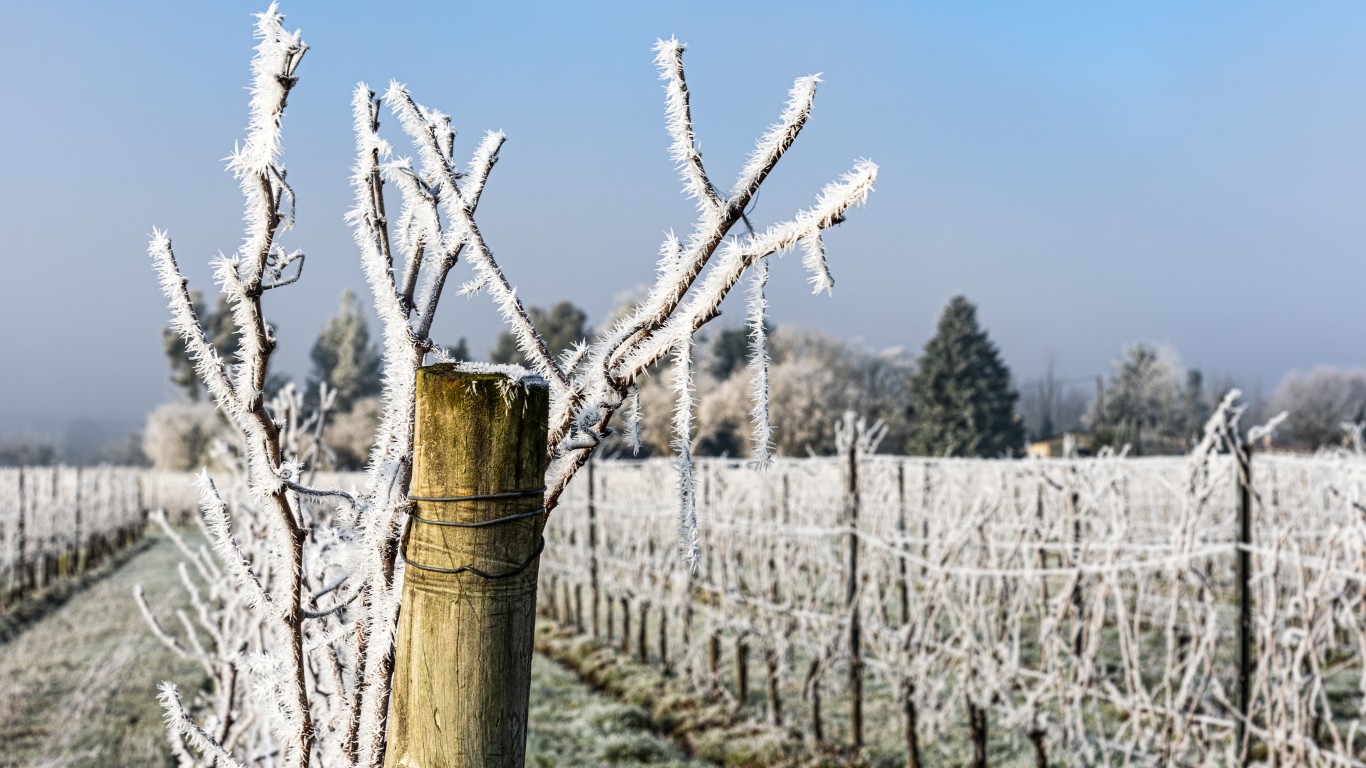
Even minimal changes in regular temperatures can devastate agricultural crops and lead to economic loss. Warm temperatures followed by a cold snap resulted in vineyard plants sprouting too early, only to be killed by the cold. This event prompted the loss of one-third of the wine plants in France, and is attributed with losses over $1 billion.
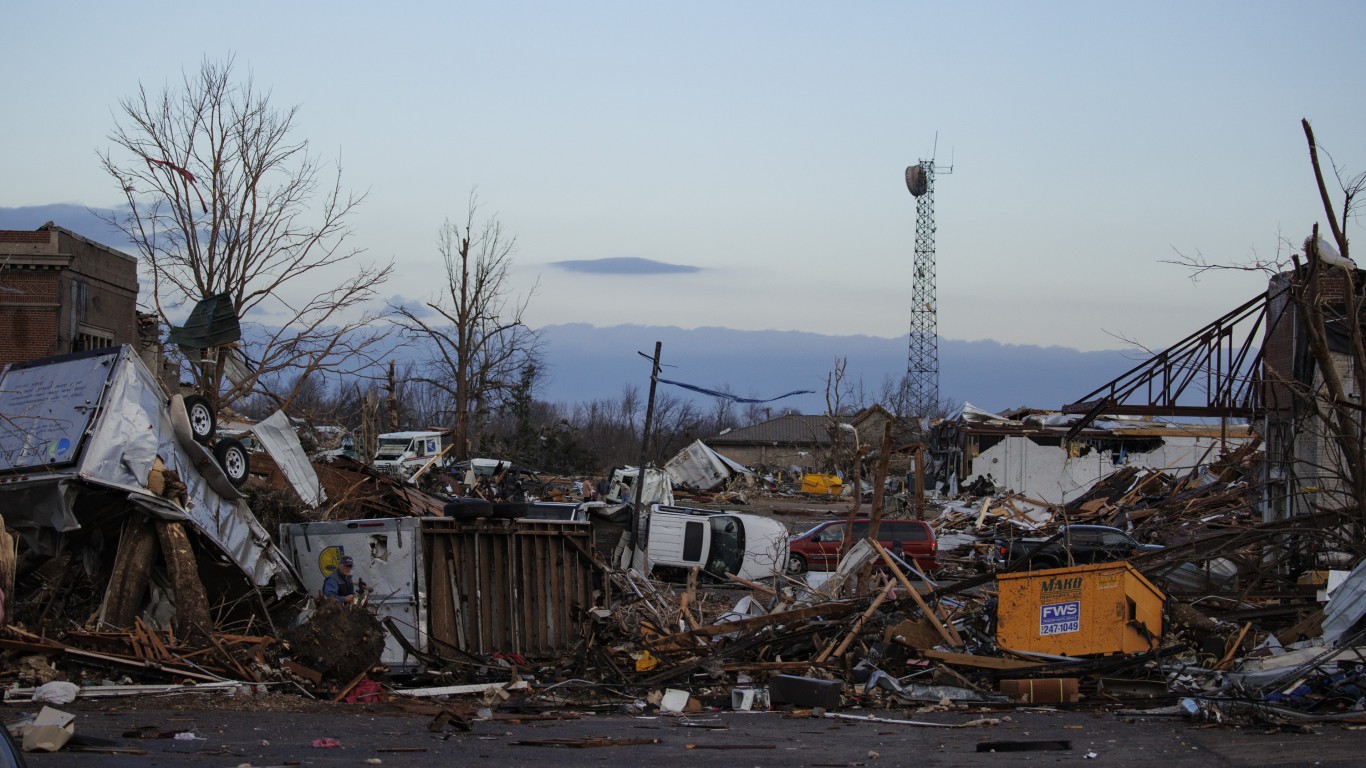
2021: December tornadoes
> Location: U.S. Plains. Midwest
In December of 2021, an outbreak of tornadoes ripped across multiple states, killing 90 as it tore through a Kentucky candle factory and an Illinois Amazon warehouse. The tornado outbreak’s estimated damage caused is around $3 billion. Tornado season in the U.S. Plains and Midwest typically spans from April to June, but according to NOAA, winter temperature increases and moist air can cause thunderstorms, which can produce tornadoes.
[in-text-ad-2]
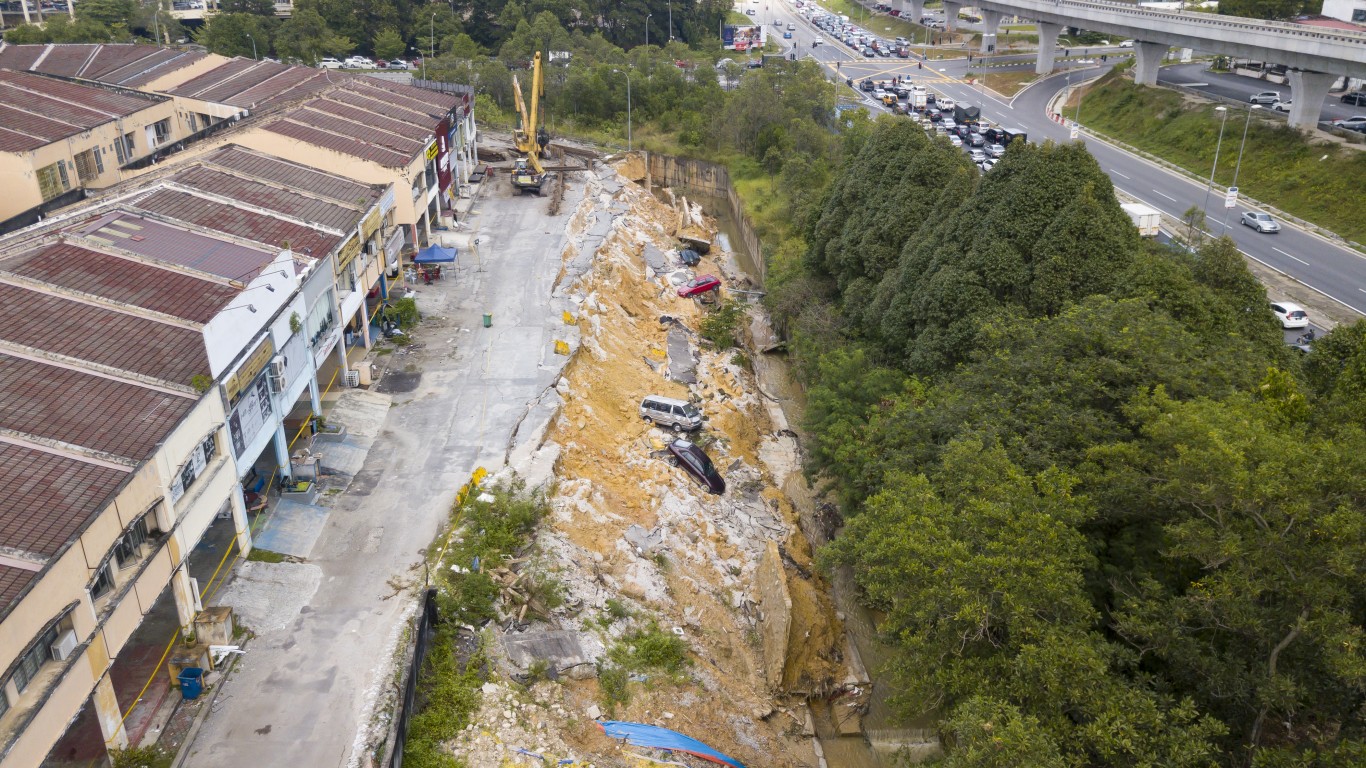
2022: Floods
> Location: Malaysia
Severe flooding in Malaysia displaced thousands and caused the deaths of 50 people early in 2022. The event was triggered by an out-of-season tropical depression at the end of 2021. Being out of season, people and relief agencies were caught unprepared. The disaster is estimated to cost $1.46 billion in losses.

2022: Antarctic heat waves
> Location: Antarctica
In March of 2022, a heat wave hit Antarctica, resulting in temperatures that were up to 70 degrees above normal. The temperature that day was 13.8°F, while the normal temperature in the region in March is -55.5°F. During the same heat wave, an ice shelf the size of New York City in East Antarctica broke off, demonstrating the severe impact of increasing global temperatures.
[in-text-ad]
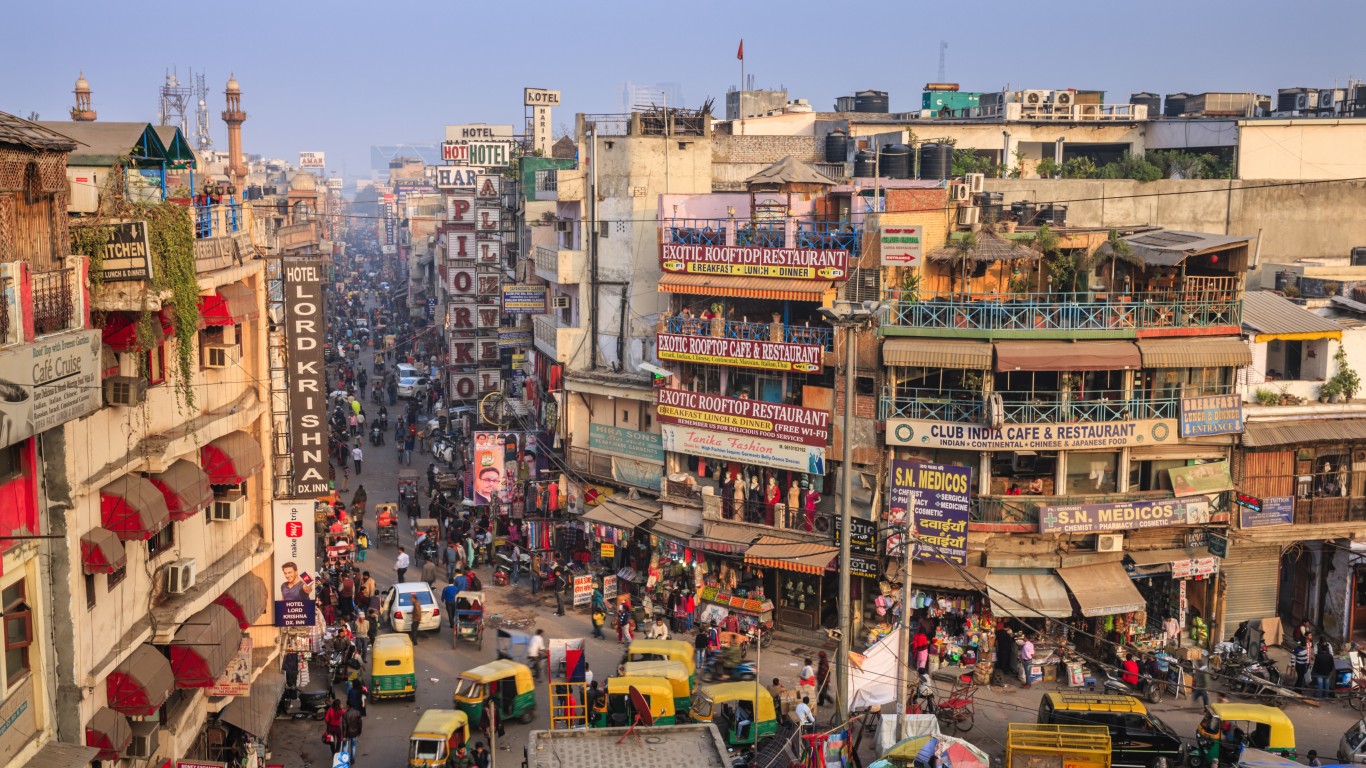
2022: Intense heat
> Location: India
The average temperatures in India in March are a high of 87.7°F and a low of 64.4°F, but the average high temperature in March of 2022 broke records held for 122 years. Average high temperatures soared to 91.6°F across the country, ushering in an early summer – as have become the norm in recent years.
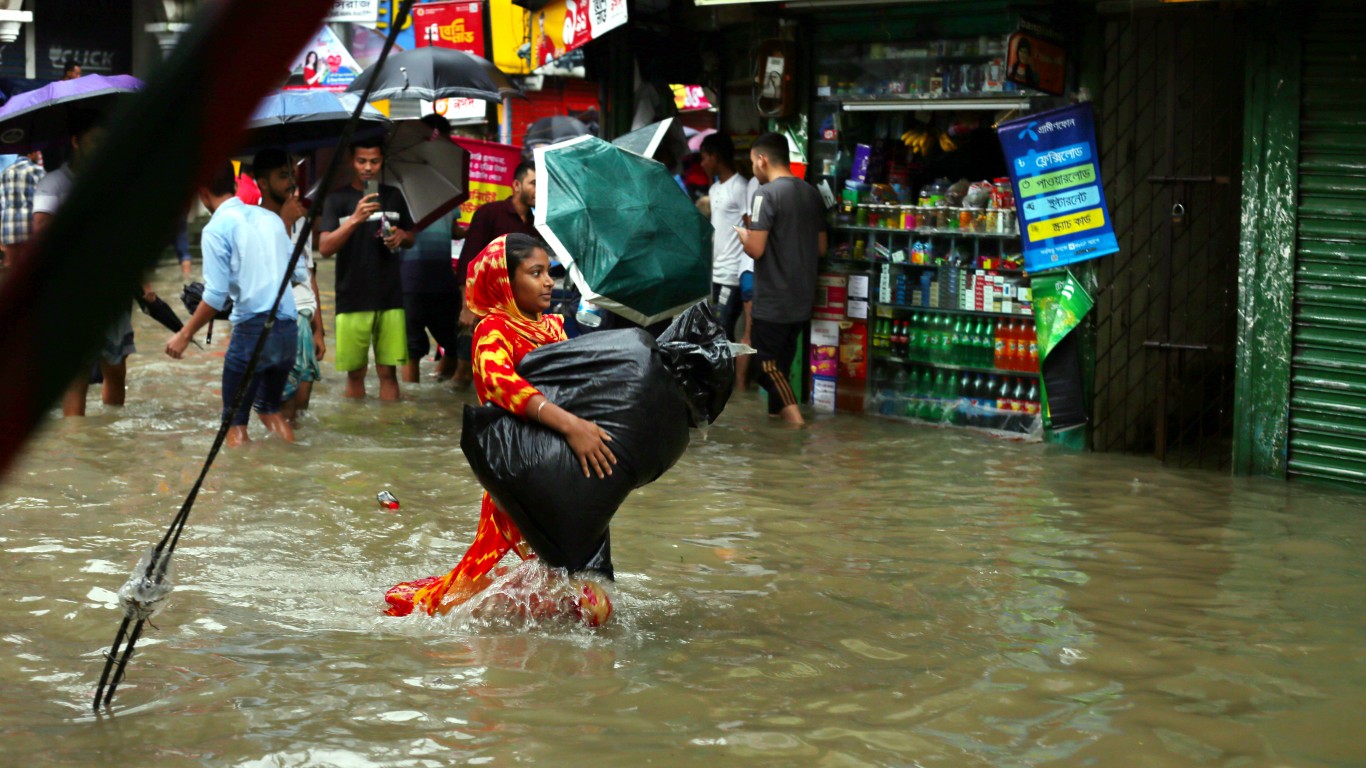
2022: Flooding
> Location: Bangladesh
Last month, severe flooding hit Bangladesh, triggering deadly mudslides. The deluge was considered to be some of the worst to hit the country in the last century, leading to over 100 deaths. Many were left homeless, and millions of dollars are needed to aid recovery.
Thank you for reading! Have some feedback for us?
Contact the 24/7 Wall St. editorial team.
 24/7 Wall St.
 24/7 Wall St.
 24/7 Wall St.