The United States spends more on healthcare than any other developed country – sometimes more than $400,000 per person over a lifetime for the average American. Of course, certain medical conditions can be much more expensive to treat than others, and the costs of treatment for some common ailments are rising. (Here are the most common ailments in America.)
To identify 25 health conditions with soaring medical costs in America, 24/7 Tempo reviewed the Medical Care Expenditure Index, which measures the growth in cost per case spending using annual data through 2019, from the Health Care Satellite Account – a set of statistics measuring U.S. health care spending produced by the Bureau of Economic Analysis.
We used the BEA’s Blended Account database, which blends together data from multiple sources, including large claims databases that cover millions of enrollees and billions of claims. This dataset was last updated by the BEA on Dec. 6, 2021. Total dollars spent in 2019 and 2009, as well as total episodes of care for each condition in 2019 also came from the BEA.
Click here to see health conditions with soaring medical costs in America
Numerous factors influence which ailments are becoming more expensive. In some cases the high cost of advanced pharmaceutical treatments has driven up the total cost of care. HIV, for example, is increasingly costly to treat in part because there is no cap on drug prices in the U.S., which means price regulation relies on competition – and patents on many newer, more effective HIV drugs prevent other companies from providing lower-cost, generic options.
In the case of cystic fibrosis – which represents the single fastest-rising medical cost in America – advances in treatment have led to longer life spans for those born with this autosomal recessive disease. This has led to an increase in the prevalence of cystic fibrosis in the adult population, translating to a higher cost of care over a person’s lifetime. Cystic fibrosis also happens to top the list of the most expensive ailments in America.
25. Cancer of bone and connective tissue
> Growth in cost per case spending index: 3.28
> Cost per case in 2019: $6,729 – #128 highest
> Total spent in 2019: $813,767,909 – #128 most
> Cost per case in 2009: $3,903 – #40 highest in 2009
> 10-year growth in cost per case: 72.4% – #43 largest
> Number of episodes in 2019: 152,892 – #231 most
[in-text-ad]

24. Cancer; other and unspecified primary
> Growth in cost per case spending index: 3.36
> Cost per case in 2019: $3,010 – #224 highest
> Total spent in 2019: $698,057,879 – #224 most
> Cost per case in 2009: $1,815 – #100 highest in 2009
> 10-year growth in cost per case: 65.8% – #63 largest
> Number of episodes in 2019: 293,186 – #213 most

23. Tuberculosis
> Growth in cost per case spending index: 3.38
> Cost per case in 2019: $2,484 – #106 highest
> Total spent in 2019: $86,481,690 – #106 most
> Cost per case in 2009: $1,189 – #151 highest in 2009
> 10-year growth in cost per case: 108.9% – #16 largest
> Number of episodes in 2019: 44,006 – #254 most

22. Septicemia (except in labor)
> Growth in cost per case spending index: 3.42
> Cost per case in 2019: $18,432 – #208 highest
> Total spent in 2019: $30,821,409,477 – #208 most
> Cost per case in 2009: $13,725 – #4 highest in 2009
> 10-year growth in cost per case: 34.3% – #154 largest
> Number of episodes in 2019: 2,113,895 – #121 most
[in-text-ad-2]

21. Acute posthemorrhagic anemia
> Growth in cost per case spending index: 3.42
> Cost per case in 2019: $3,129 – #49 highest
> Total spent in 2019: $916,687,594 – #49 most
> Cost per case in 2009: $1,802 – #102 highest in 2009
> 10-year growth in cost per case: 73.7% – #39 largest
> Number of episodes in 2019: 370,327 – #207 most

20. HIV infection
> Growth in cost per case spending index: 3.44
> Cost per case in 2019: $37,356 – #31 highest
> Total spent in 2019: $17,080,661,153 – #31 most
> Cost per case in 2009: $15,958 – #1 highest in 2009
> 10-year growth in cost per case: 134.1% – #13 largest
> Number of episodes in 2019: 578,024 – #183 most
[in-text-ad]

19. Coagulation and hemorrhagic disorders
> Growth in cost per case spending index: 3.48
> Cost per case in 2019: $3,910 – #40 highest
> Total spent in 2019: $5,350,286,068 – #40 most
> Cost per case in 2009: $1,669 – #112 highest in 2009
> 10-year growth in cost per case: 134.2% – #12 largest
> Number of episodes in 2019: 1,729,995 – #133 most

18. Poisoning by other medications and drugs
> Growth in cost per case spending index: 3.51
> Cost per case in 2019: $2,583 – #121 highest
> Total spent in 2019: $1,163,212,038 – #121 most
> Cost per case in 2009: $1,299 – #138 highest in 2009
> 10-year growth in cost per case: 98.9% – #20 largest
> Number of episodes in 2019: 569,271 – #184 most

17. Cancer; other respiratory and intrathoracic
> Growth in cost per case spending index: 3.61
> Cost per case in 2019: $6,006 – #68 highest
> Total spent in 2019: $114,124,684 – #68 most
> Cost per case in 2009: $3,954 – #39 highest in 2009
> 10-year growth in cost per case: 51.9% – #96 largest
> Number of episodes in 2019: 24,020 – #257 most
[in-text-ad-2]

16. Leukemias
> Growth in cost per case spending index: 3.63
> Cost per case in 2019: $15,806 – #58 highest
> Total spent in 2019: $5,676,732,031 – #58 most
> Cost per case in 2009: $7,574 – #20 highest in 2009
> 10-year growth in cost per case: 108.7% – #17 largest
> Number of episodes in 2019: 454,026 – #193 most

15. Intestinal infection
> Growth in cost per case spending index: 4.05
> Cost per case in 2019: $1,619 – #221 highest
> Total spent in 2019: $3,084,380,866 – #221 most
> Cost per case in 2009: $793 – #192 highest in 2009
> 10-year growth in cost per case: 104.1% – #18 largest
> Number of episodes in 2019: 2,407,790 – #115 most
[in-text-ad]

14. Spinal cord injury
> Growth in cost per case spending index: 4.09
> Cost per case in 2019: $7,598 – #9 highest
> Total spent in 2019: $545,971,867 – #9 most
> Cost per case in 2009: $4,015 – #38 highest in 2009
> 10-year growth in cost per case: 89.2% – #23 largest
> Number of episodes in 2019: 90,840 – #241 most
13. Cancer of brain and nervous system
> Growth in cost per case spending index: 4.12
> Cost per case in 2019: $15,030 – #117 highest
> Total spent in 2019: $1,669,078,178 – #117 most
> Cost per case in 2009: $9,157 – #12 highest in 2009
> 10-year growth in cost per case: 64.1% – #70 largest
> Number of episodes in 2019: 140,389 – #233 most

12. Encephalitis (except that caused by tuberculosis or sexually transmitted disease)
> Growth in cost per case spending index: 4.14
> Cost per case in 2019: $7,902 – #7 highest
> Total spent in 2019: $333,868,553 – #7 most
> Cost per case in 2009: $2,610 – #72 highest in 2009
> 10-year growth in cost per case: 202.8% – #6 largest
> Number of episodes in 2019: 53,416 – #252 most
[in-text-ad-2]
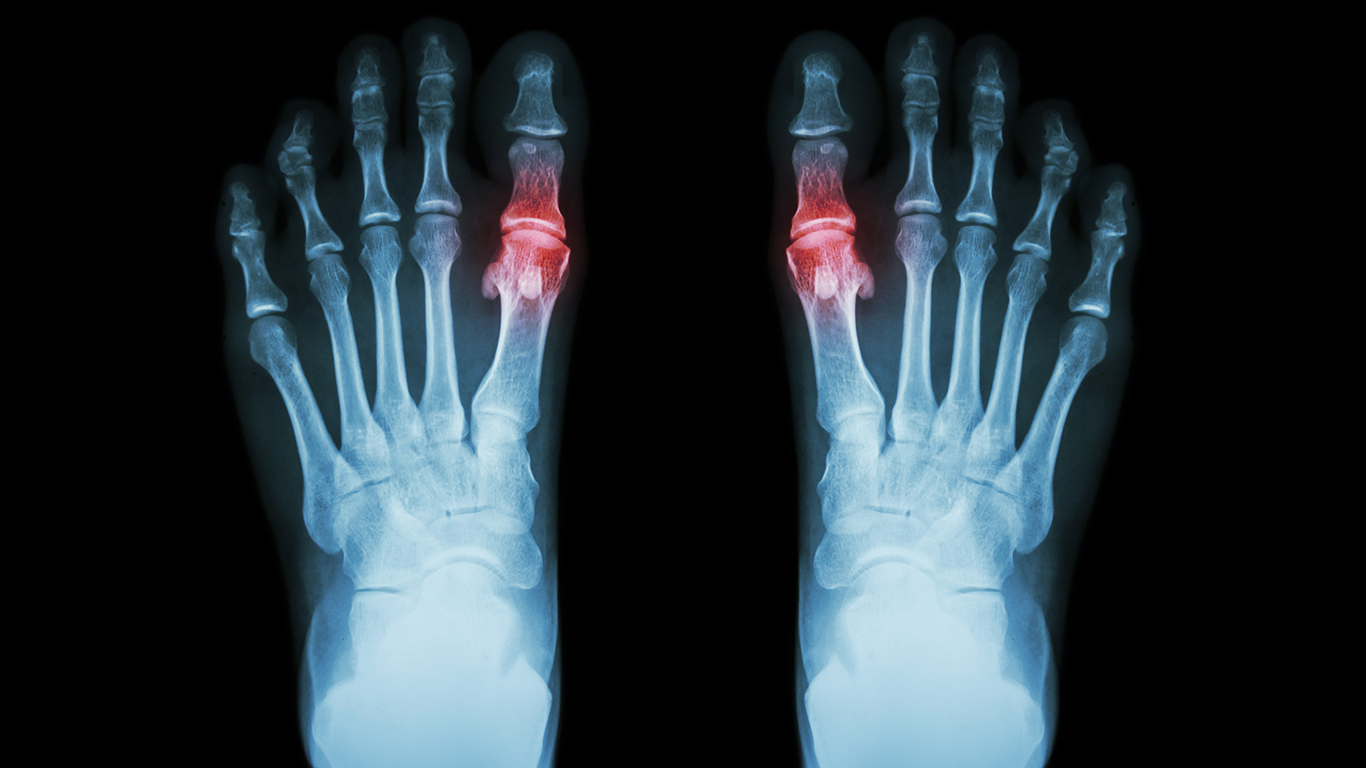
11. Rheumatoid arthritis and related disease
> Growth in cost per case spending index: 4.29
> Cost per case in 2019: $6,120 – #47 highest
> Total spent in 2019: $12,618,165,262 – #47 most
> Cost per case in 2009: $2,275 – #81 highest in 2009
> 10-year growth in cost per case: 169.1% – #10 largest
> Number of episodes in 2019: 2,606,261 – #110 most

10. Other inflammatory condition of skin
> Growth in cost per case spending index: 4.37
> Cost per case in 2019: $1,839 – #48 highest
> Total spent in 2019: $10,039,561,728 – #48 most
> Cost per case in 2009: $785 – #195 highest in 2009
> 10-year growth in cost per case: 134.4% – #11 largest
> Number of episodes in 2019: 6,900,996 – #63 most
[in-text-ad]

9. Hypertension with complications and secondary hypertension
> Growth in cost per case spending index: 4.77
> Cost per case in 2019: $4,992 – #2 highest
> Total spent in 2019: $17,781,180,226 – #2 most
> Cost per case in 2009: $1,452 – #127 highest in 2009
> 10-year growth in cost per case: 243.8% – #4 largest
> Number of episodes in 2019: 4,502,932 – #80 most
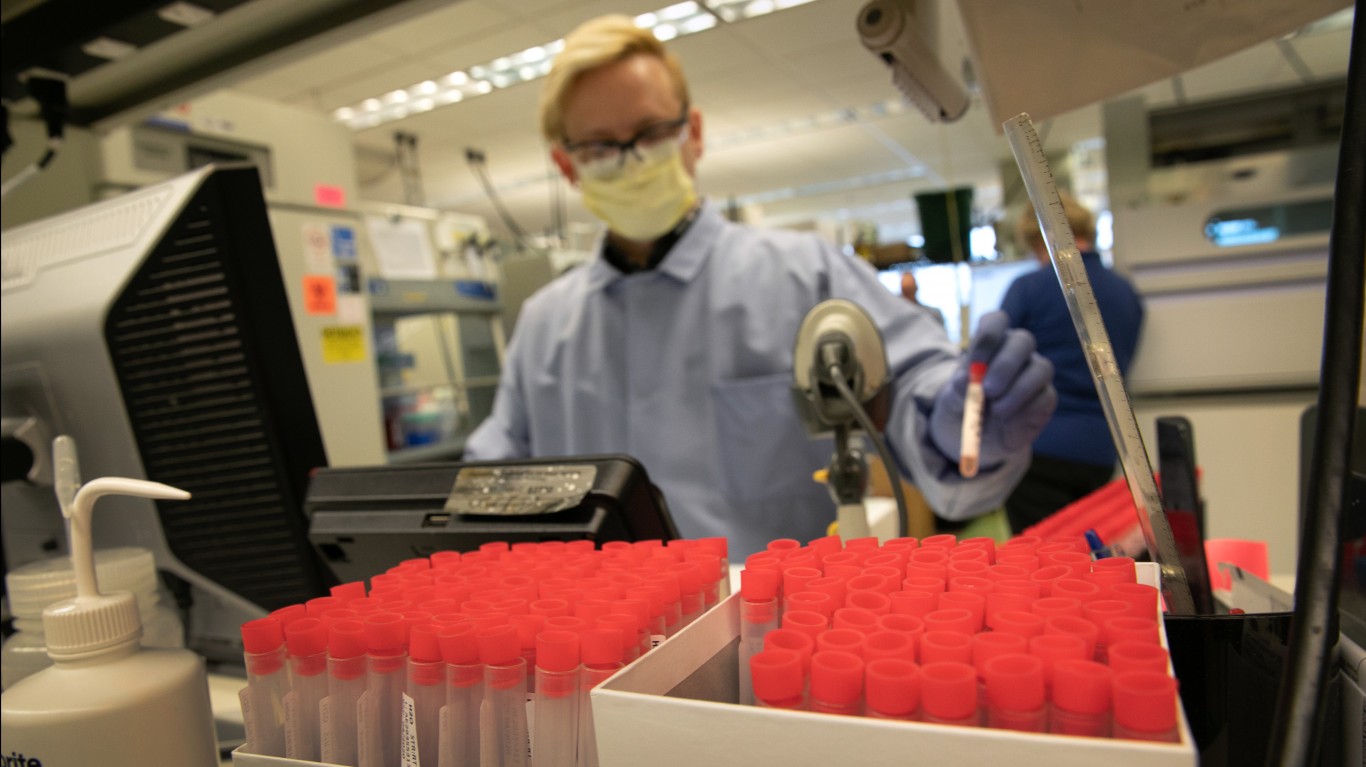
8. Sickle cell anemia
> Growth in cost per case spending index: 4.80
> Cost per case in 2019: $11,138 – #15 highest
> Total spent in 2019: $606,535,968 – #15 most
> Cost per case in 2009: $6,387 – #24 highest in 2009
> 10-year growth in cost per case: 74.4% – #37 largest
> Number of episodes in 2019: 68,840 – #247 most
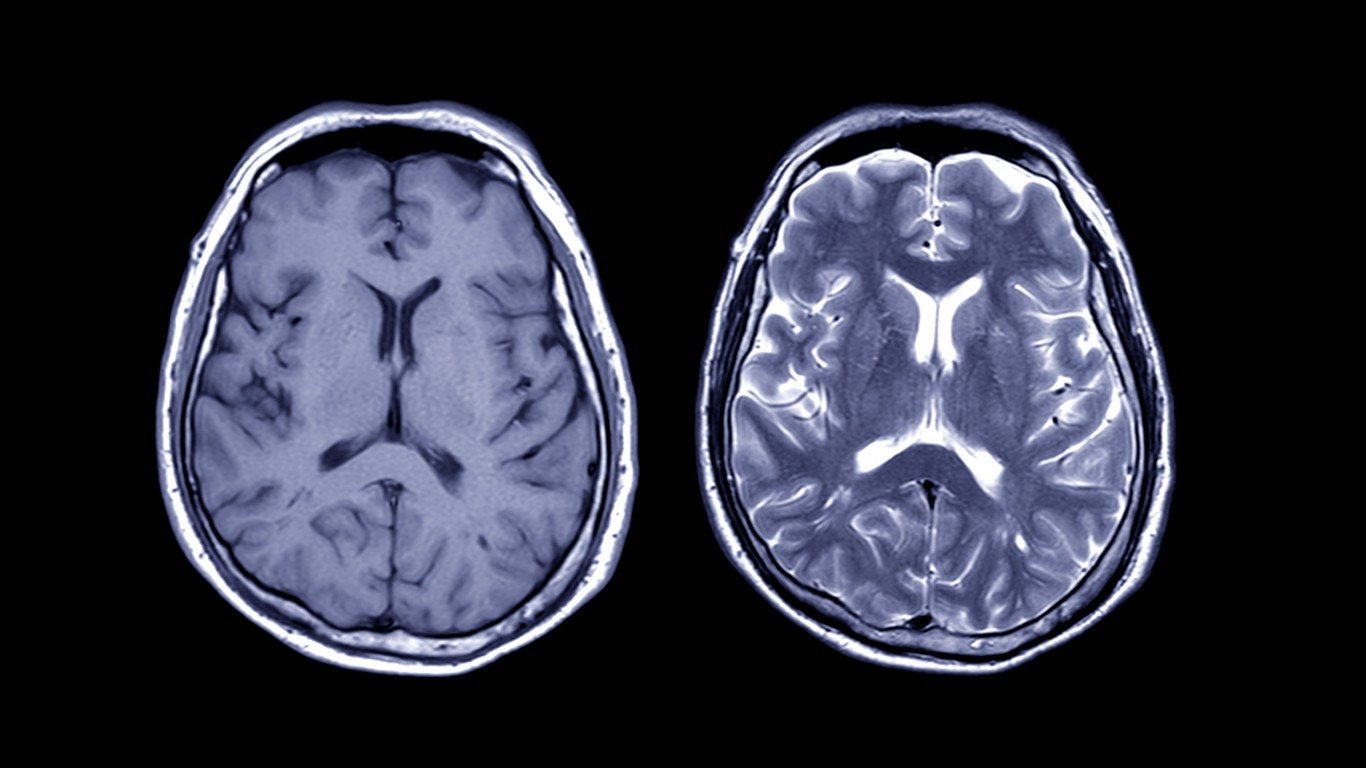
7. Late effects of cerebrovascular disease
> Growth in cost per case spending index: 4.95
> Cost per case in 2019: $10,965 – #5 highest
> Total spent in 2019: $6,107,796,344 – #5 most
> Cost per case in 2009: $3,789 – #42 highest in 2009
> 10-year growth in cost per case: 189.4% – #7 largest
> Number of episodes in 2019: 704,201 – #173 most
[in-text-ad-2]

6. Hepatitis
> Growth in cost per case spending index: 5.04
> Cost per case in 2019: $4,586 – #10 highest
> Total spent in 2019: $3,187,409,422 – #10 most
> Cost per case in 2009: $1,687 – #109 highest in 2009
> 10-year growth in cost per case: 171.8% – #9 largest
> Number of episodes in 2019: 878,733 – #161 most

5. Regional enteritis and ulcerative colitis
> Growth in cost per case spending index: 5.28
> Cost per case in 2019: $14,968 – #28 highest
> Total spent in 2019: $14,698,215,611 – #28 most
> Cost per case in 2009: $4,223 – #36 highest in 2009
> 10-year growth in cost per case: 254.4% – #3 largest
> Number of episodes in 2019: 1,241,419 – #150 most
[in-text-ad]
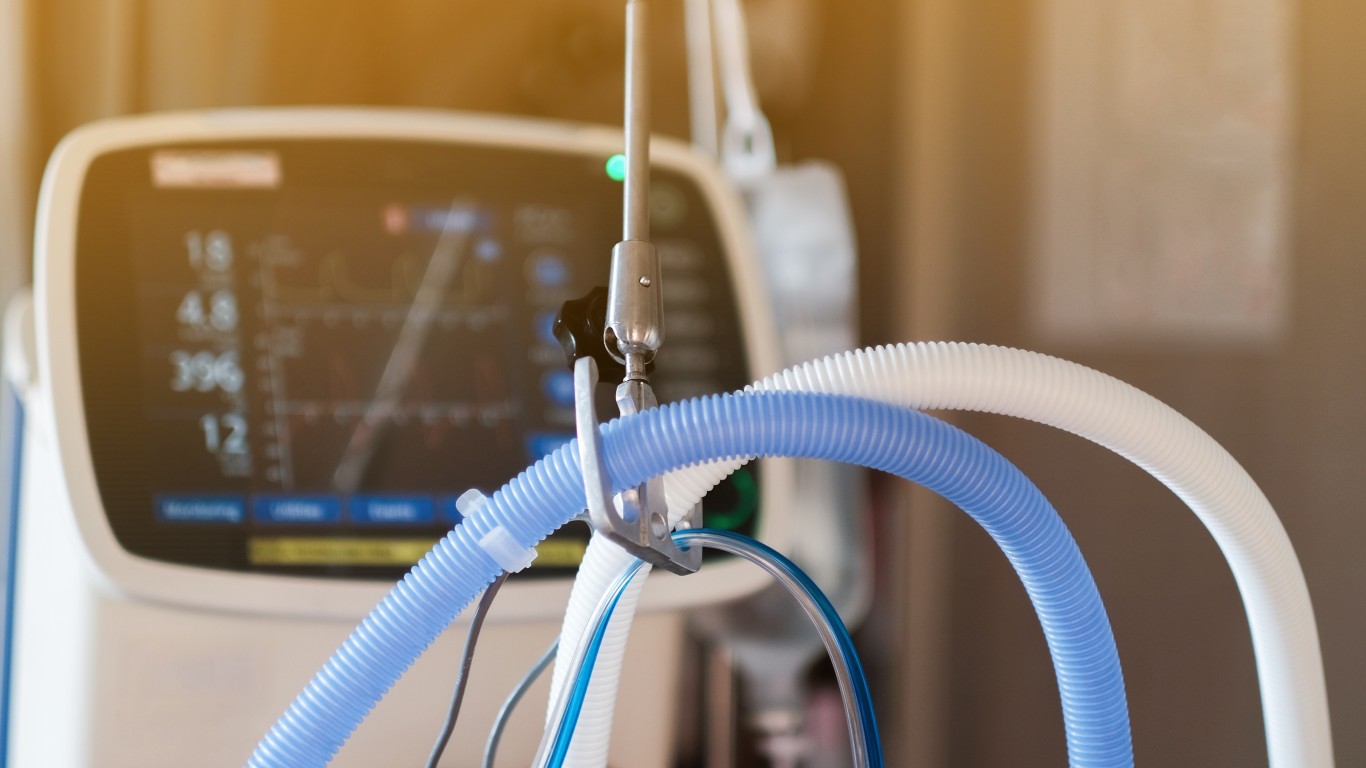
4. Respiratory distress syndrome
> Growth in cost per case spending index: 7.38
> Cost per case in 2019: $32,101 – #14 highest
> Total spent in 2019: $626,592,343 – #14 most
> Cost per case in 2009: $11,667 – #8 highest in 2009
> 10-year growth in cost per case: 175.1% – #8 largest
> Number of episodes in 2019: 24,676 – #256 most

3. Multiple sclerosis
> Growth in cost per case spending index: 9.27
> Cost per case in 2019: $33,471 – #11 highest
> Total spent in 2019: $16,728,271,780 – #11 most
> Cost per case in 2009: $10,404 – #9 highest in 2009
> 10-year growth in cost per case: 221.7% – #5 largest
> Number of episodes in 2019: 631,818 – #179 most

2. Multiple myeloma
> Growth in cost per case spending index: 9.77
> Cost per case in 2019: $60,036 – #61 highest
> Total spent in 2019: $8,951,457,126 – #61 most
> Cost per case in 2009: $14,914 – #2 highest in 2009
> 10-year growth in cost per case: 302.5% – #2 largest
> Number of episodes in 2019: 188,490 – #222 most
[in-text-ad-2]

1. Cystic fibrosis
> Growth in cost per case spending index: 23.29
> Cost per case in 2019: $136,319 – #23 highest
> Total spent in 2019: $3,909,394,271 – #23 most
> Cost per case in 2009: $11,826 – #7 highest in 2009
> 10-year growth in cost per case: 1052.7% – #1 largest
> Number of episodes in 2019: 36,254 – #255 most
Cash Back Credit Cards Have Never Been This Good
Credit card companies are at war, handing out free rewards and benefits to win the best customers. A good cash back card can be worth thousands of dollars a year in free money, not to mention other perks like travel, insurance, and access to fancy lounges. See our top picks for the best credit cards today. You won’t want to miss some of these offers.
Flywheel Publishing has partnered with CardRatings for our coverage of credit card products. Flywheel Publishing and CardRatings may receive a commission from card issuers.
Thank you for reading! Have some feedback for us?
Contact the 24/7 Wall St. editorial team.
 24/7 Wall St.

