Special Report
Earth's CO2 Level Rose Every Year Since Climate Change Became a National Issue
Published:

On June 3 of this year, NOAA scientists announced a weather station at Hawaii’s Mauna Loa Atmospheric Baseline Observatory had recorded carbon dioxide levels at 421 parts per million (ppm) in May.
The last time the earth experienced similar levels of this greenhouse gas was during the Pliocene Epoch millions of years ago, a period when global temperatures increased and sea levels may have reached as high as 20 meters (65 feet) above present-day levels.
Both CO2 and sea level subsequently fell precipitously, and over the past 6,000 years, levels remained around 280 parts per million. No longer. The global average grew from 350.9 ppm to 418.39 ppm between 1988 and 2022, an alarming 19% increase. Today the amount of CO2 in the earth’s atmosphere is more than 50% higher than it was prior to the Industrial Revolution. (These are the cities emitting the most carbon dioxide in the world.)
Carbon dioxide is only one of the greenhouse gasses, of course. Methane (CH4) and nitrous oxide (N20) have risen 12% and 9%, respectively, since 1988.
Human sources of carbon dioxide emissions are primarily the burning of fossil fuels, which accounts for 87% of CO2 emissions, land-use changes (primarily deforestation), and industrial processes like cement manufacturing. (These are the companies pumping the most greenhouse gas into the atmosphere.)
Emissions of methane, which has 80 times the warming effect of CO2 in its first 20 years in the atmosphere, is linked to agricultural emissions from ruminant livestock and leaks from oil and gas operations. So called feedback loops linked to global warming, namely melting permafrost and seepage from warming sea floors, is accelerating the growth of natural methane emissions.
The primary source of anthropogenic nitrous oxide, commonly used in dentist’s offices and injected into modified race car engines to boost speed, is agricultural activity, specifically microbes in fertilized soil and the deterioration of animal manure.
The idea of a potential link between carbon dioxide levels and changing temperatures on earth – the so-called greenhouse effect – was first proposed by a Swedish scientist in 1896, and some date this as the beginnings of our concern with climate change. It was in 1988, however, that climate change became a national issue when Dr. James Hansen, director of NASA’s Institute for Space Studies, testified before the U.S. Senate Energy and Natural Resources Committee that “[T]he greenhouse effect has been detected, and it is changing our climate now.”
Click here to see how Earth’s CO2 level rose every year since climate change became a national issue
To identify the world’s CO2 concentration every year since climate change became a national issue, 24/7 Wall St. reviewed annual concentrations of gasses known as main drivers of climate change – carbon dioxide, methane, and nitrous oxide – from the Global Monitoring Laboratory, a research organization of the National Oceanic and Atmospheric Administration (NOAA) which measures the atmospheric distribution and trends of various greenhouse gasses.

1988
> Carbon dioxide (CO2): 350.93 ppm
> Methane (CH4): 1,698.83 ppm
> Nitrous oxide (N2O): 306.49 ppm
[in-text-ad]

1989
> Carbon dioxide (CO2): 352.57 ppm
> Methane (CH4): 1,710.52 ppm
> Nitrous oxide (N2O): 307.48 ppm
1990
> Carbon dioxide (CO2): 353.72 ppm
> Methane (CH4): 1,709.33 ppm
> Nitrous oxide (N2O): 308.78 ppm

1991
> Carbon dioxide (CO2): 355.15 ppm
> Methane (CH4): 1,729.07 ppm
> Nitrous oxide (N2O): 309.57 ppm
[in-text-ad-2]

1992
> Carbon dioxide (CO2): 355.90 ppm
> Methane (CH4): 1,731.05 ppm
> Nitrous oxide (N2O): 310.00 ppm

1993
> Carbon dioxide (CO2): 356.63 ppm
> Methane (CH4): 1,735.65 ppm
> Nitrous oxide (N2O): 310.25 ppm
[in-text-ad]
1994
> Carbon dioxide (CO2): 358.20 ppm
> Methane (CH4): 1,741.66 ppm
> Nitrous oxide (N2O): 310.98 ppm
1995
> Carbon dioxide (CO2): 360.23 ppm
> Methane (CH4): 1,747.10 ppm
> Nitrous oxide (N2O): 311.78 ppm

1996
> Carbon dioxide (CO2): 362.01 ppm
> Methane (CH4): 1,749.86 ppm
> Nitrous oxide (N2O): 312.81 ppm
[in-text-ad-2]
1997
> Carbon dioxide (CO2): 363.17 ppm
> Methane (CH4): 1,753.94 ppm
> Nitrous oxide (N2O): 313.53 ppm
1998
> Carbon dioxide (CO2): 365.69 ppm
> Methane (CH4): 1,762.43 ppm
> Nitrous oxide (N2O): 314.20 ppm
[in-text-ad]

1999
> Carbon dioxide (CO2): 367.81 ppm
> Methane (CH4): 1,772.33 ppm
> Nitrous oxide (N2O): 315.15 ppm

2000
> Carbon dioxide (CO2): 368.92 ppm
> Methane (CH4): 1,774.07 ppm
> Nitrous oxide (N2O): 316.14 ppm
2001
> Carbon dioxide (CO2): 370.38 ppm
> Methane (CH4): 1,772.95 ppm
> Nitrous oxide (N2O): 316.89 ppm
[in-text-ad-2]
2002
> Carbon dioxide (CO2): 372.49 ppm
> Methane (CH4): 1,773.14 ppm
> Nitrous oxide (N2O): 317.47 ppm
2003
> Carbon dioxide (CO2): 375.08 ppm
> Methane (CH4): 1,777.41 ppm
> Nitrous oxide (N2O): 318.21 ppm
[in-text-ad]
2004
> Carbon dioxide (CO2): 376.61 ppm
> Methane (CH4): 1,775.44 ppm
> Nitrous oxide (N2O): 318.93 ppm
2005
> Carbon dioxide (CO2): 378.97 ppm
> Methane (CH4): 1,774.55 ppm
> Nitrous oxide (N2O): 319.60 ppm
2006
> Carbon dioxide (CO2): 381.17 ppm
> Methane (CH4): 1,776.40 ppm
> Nitrous oxide (N2O): 320.37 ppm
[in-text-ad-2]
2007
> Carbon dioxide (CO2): 382.89 ppm
> Methane (CH4): 1,781.75 ppm
> Nitrous oxide (N2O): 321.14 ppm

2008
> Carbon dioxide (CO2): 384.98 ppm
> Methane (CH4): 1,789.94 ppm
> Nitrous oxide (N2O): 322.11 ppm
[in-text-ad]
2009
> Carbon dioxide (CO2): 386.42 ppm
> Methane (CH4): 1,793.63 ppm
> Nitrous oxide (N2O): 322.88 ppm
2010
> Carbon dioxide (CO2): 388.71 ppm
> Methane (CH4): 1,796.84 ppm
> Nitrous oxide (N2O): 323.70 ppm

2011
> Carbon dioxide (CO2): 390.57 ppm
> Methane (CH4): 1,803.42 ppm
> Nitrous oxide (N2O): 324.61 ppm
[in-text-ad-2]
2012
> Carbon dioxide (CO2): 392.64 ppm
> Methane (CH4): 1,810.33 ppm
> Nitrous oxide (N2O): 325.58 ppm

2013
> Carbon dioxide (CO2): 395.49 ppm
> Methane (CH4): 1,815.44 ppm
> Nitrous oxide (N2O): 326.53 ppm
[in-text-ad]

2014
> Carbon dioxide (CO2): 397.45 ppm
> Methane (CH4): 1,824.40 ppm
> Nitrous oxide (N2O): 327.61 ppm
2015
> Carbon dioxide (CO2): 399.58 ppm
> Methane (CH4): 1,834.63 ppm
> Nitrous oxide (N2O): 328.51 ppm

2016
> Carbon dioxide (CO2): 402.87 ppm
> Methane (CH4): 1,842.40 ppm
> Nitrous oxide (N2O): 329.33 ppm
[in-text-ad-2]
2017
> Carbon dioxide (CO2): 405.19 ppm
> Methane (CH4): 1,849.95 ppm
> Nitrous oxide (N2O): 330.31 ppm
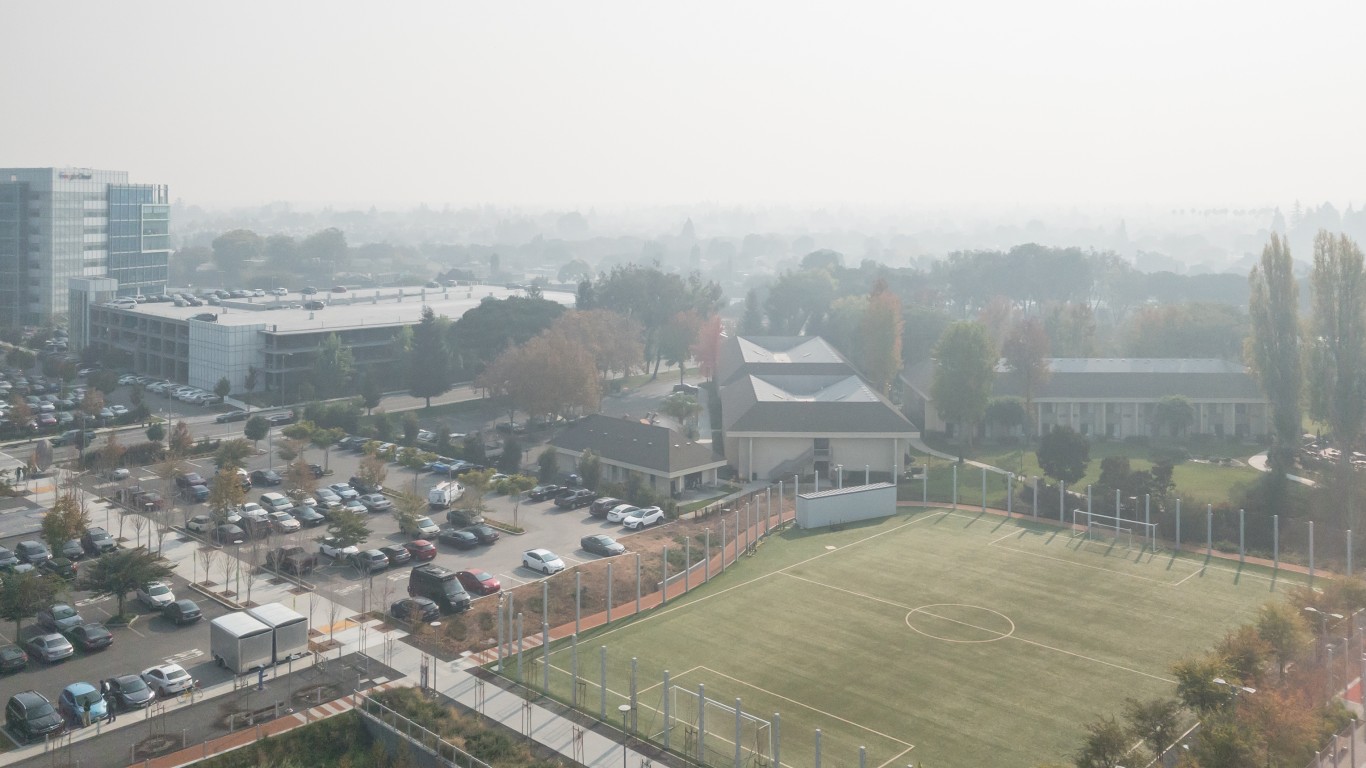
2018
> Carbon dioxide (CO2): 407.58 ppm
> Methane (CH4): 1,857.31 ppm
> Nitrous oxide (N2O): 330.90 ppm
[in-text-ad]
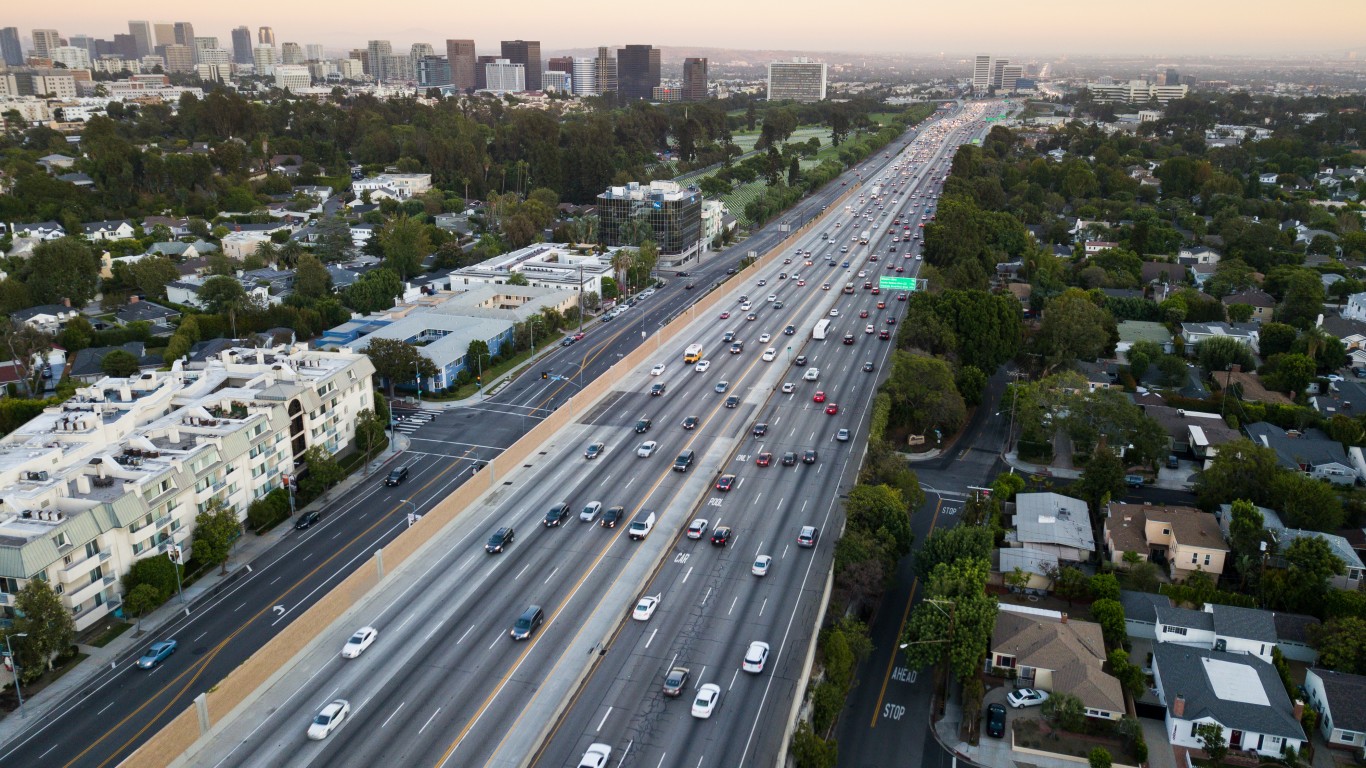
2019
> Carbon dioxide (CO2): 411.66 ppm
> Methane (CH4): 1,866.59 ppm
> Nitrous oxide (N2O): 331.88 ppm

2020
> Carbon dioxide (CO2): 414.24 ppm
> Methane (CH4): 1,878.95 ppm
> Nitrous oxide (N2O): 333.03 ppm
2021
> Carbon dioxide (CO2): 416.45 ppm
> Methane (CH4): 1,895.50 ppm
> Nitrous oxide (N2O): 334.31 ppm
[in-text-ad-2]
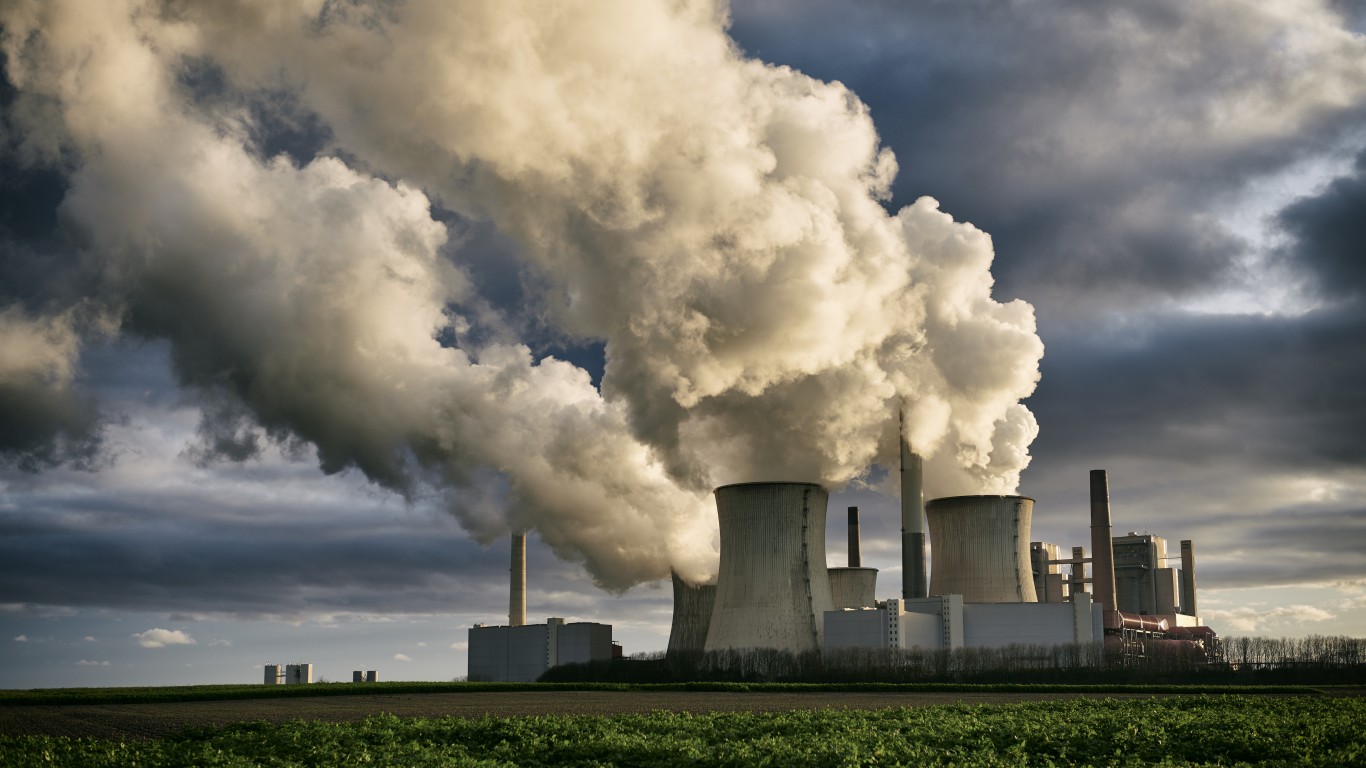
2022
> Carbon dioxide (CO2): 418.39 ppm as of June
> Methane (CH4): 1,909.20 ppm as of March
> Nitrous oxide (N2O): 335.40 ppm as of March
The thought of burdening your family with a financial disaster is most Americans’ nightmare. However, recent studies show that over 100 million Americans still don’t have proper life insurance in the event they pass away.
Life insurance can bring peace of mind – ensuring your loved ones are safeguarded against unforeseen expenses and debts. With premiums often lower than expected and a variety of plans tailored to different life stages and health conditions, securing a policy is more accessible than ever.
A quick, no-obligation quote can provide valuable insight into what’s available and what might best suit your family’s needs. Life insurance is a simple step you can take today to help secure peace of mind for your loved ones tomorrow.
Click here to learn how to get a quote in just a few minutes.
Thank you for reading! Have some feedback for us?
Contact the 24/7 Wall St. editorial team.