
There has been a near 30% surge in homicides in the United States in 2020, the largest one-year increase ever recorded. Homicides increased once again in 2021, but by a smaller, 6% margin. Preliminary data from 2022 suggests that murders may finally be declining once again.
Based on data reported by police departments in major U.S. cities, homicides are down by about 3.8% compared to the same period last year. While these early figures are encouraging, there are still several large American cities where murders are up in 2022 – sometimes by a wide margin.
Using a compilation of homicide data from 2021 and 2022, 24/7 Wall St. identified the U.S. cities where murder is up the most this year. Cities are ranked by the percent change in homicides reported year-to-date compared to the same period in 2021. Reporting dates vary by city, but are noted in each case.
We considered all U.S. cities with populations of at least 250,000 as well as cities with smaller populations and an average of at least 10 homicides a year between 2015 and 2019. Only cities with publicly available homicide data were considered. Population figures are five-year estimates from the U.S. Census Bureau’s 2020 American Community Survey.
In every city on this list, homicides are up so far in 2022 by at least 5% compared to the same period in 2021. In some, they are up over 50%. Most of the cities on this list are in the South. There is only one Midwestern city on this list and only one city in the Northeast. (Here is a look at the states where the murder rate is soaring.)
Many of these cities are among those that consistently rank among the most violent cities in the country. Places on this list such as Baltimore, Little Rock, and New Orleans regularly rank among the U.S. cities with highest violent crime rates. (Here is a look at America’s most dangerous cities.)
Click here to see the cities where murders are up the most this year.

28. Atlanta, GA
> Increase in murders, 2021-2022 YTD +5.6%
> Total murders; Jan. 1 – Aug. 6, 2022 95
> Total murders; Jan. 1 – Aug. 6, 2021 90
> Population: 497,642
[in-text-ad]

27. Jacksonville, FL
> Increase in murders, 2021-2022 YTD +6.0%
> Total murders; Jan. 1 – Aug. 3, 2022 71
> Total murders; Jan. 1 – Aug. 3, 2021 67
> Population: 902,488
 24/7 Wall St.
26. Charlotte, NC
> Increase in murders, 2021-2022 YTD +8.5%
> Total murders; Jan. 1 – June 30, 2022 51
> Total murders; Jan. 1 – June 30, 2021 47
> Population: 873,570

25. Greensboro, NC
> Increase in murders, 2021-2022 YTD +8.7%
> Total murders; Jan. 1 – July 31, 2022 25
> Total murders; Jan. 1 – July 31, 2021 23
> Population: 294,395
[in-text-ad-2]

24. Washington, DC
> Increase in murders, 2021-2022 YTD +8.9%
> Total murders; Jan. 1 – Aug 15, 2022 134
> Total murders; Jan. 1 – Aug 15, 2021 123
> Population: 701,974

23. Baltimore, MD
> Increase in murders, 2021-2022 YTD +9.6%
> Total murders; Jan. 1 – Aug 6, 2022 218
> Total murders; Jan. 1 – Aug 6, 2021 199
> Population: 602,274
[in-text-ad]

22. Dallas, TX
> Increase in murders, 2021-2022 YTD +12.2%
> Total murders; Jan. 1 – Aug 15, 2022 147
> Total murders; Jan. 1 – Aug 15, 2021 131
> Population: 1,338,846

21. Spokane, WA
> Increase in murders, 2021-2022 YTD +12.5%
> Total murders; Jan. 1 – Aug 13, 2022 9
> Total murders; Jan. 1 – Aug 13, 2021 8
> Population: 219,185

20. Tampa, FL
> Increase in murders, 2021-2022 YTD +13.0%
> Total murders; Jan. 1 – June 30, 2022 26
> Total murders; Jan. 1 – June 30, 2021 23
> Population: 395,912
[in-text-ad-2]

19. San Diego, CA
> Increase in murders, 2021-2022 YTD +15.4%
> Total murders; Jan. 1 – June 30, 2022 30
> Total murders; Jan. 1 – June 30, 2021 26
> Population: 1,414,545

18. Long Beach, CA
> Increase in murders, 2021-2022 YTD +15.8%
> Total murders; Jan. 1 – June 30, 2022 22
> Total murders; Jan. 1 – June 30, 2021 19
> Population: 462,081
[in-text-ad]

17. San Antonio, TX
> Increase in murders, 2021-2022 YTD +18.2%
> Total murders; Jan. 1 – March 31, 2022 39
> Total murders; Jan. 1 – March 31, 2021 33
> Population: 1,529,133
 24/7 Wall St.
16. Pittsburgh, PA
> Increase in murders, 2021-2022 YTD +19.4%
> Total murders; Jan. 1 – June 30, 2022 37
> Total murders; Jan. 1 – June 30, 2021 31
> Population: 301,286
15. Lexington, KY
> Increase in murders, 2021-2022 YTD +20.8%
> Total murders; Jan. 1 – Aug 13, 2022 29
> Total murders; Jan. 1 – Aug 13, 2021 24
> Population: 322,200
[in-text-ad-2]

14. Stockton, CA
> Increase in murders, 2021-2022 YTD +21.0%
> Total murders; Jan. 1 – June 30, 2022 23
> Total murders; Jan. 1 – June 30, 2021 19
> Population: 311,103

13. Little Rock, AR
> Increase in murders, 2021-2022 YTD +22.5%
> Total murders; Jan. 1 – Aug 8, 2022 49
> Total murders; Jan. 1 – Aug 8, 2021 40
> Population: 198,067
[in-text-ad]

12. Denver, CO
> Increase in murders, 2021-2022 YTD +23.3%
> Total murders; Jan. 1 – June 30, 2022 53
> Total murders; Jan. 1 – June 30, 2021 43
> Population: 715,878

11. Birmingham, AL
> Increase in murders, 2021-2022 YTD +23.4%
> Total murders; Jan. 1 – Aug 7, 2022 79
> Total murders; Jan. 1 – Aug 7, 2021 64
> Population: 210,928

10. Phoenix, AZ
> Increase in murders, 2021-2022 YTD +25.6%
> Total murders; Jan. 1 – June 30, 2022 113
> Total murders; Jan. 1 – June 30, 2021 90
> Population: 1,658,422
[in-text-ad-2]

9. Raleigh, NC
> Increase in murders, 2021-2022 YTD +26.7%
> Total murders; Jan. 1 – June 30, 2022 19
> Total murders; Jan. 1 – June 30, 2021 15
> Population: 469,698

8. Tulsa, OK
> Increase in murders, 2021-2022 YTD +28.1%
> Total murders; Jan. 1 – June 30, 2022 41
> Total murders; Jan. 1 – June 30, 2021 32
> Population: 402,441
[in-text-ad]

7. New Orleans, LA
> Increase in murders, 2021-2022 YTD +28.4%
> Total murders; Jan. 1 – Aug 14, 2022 172
> Total murders; Jan. 1 – Aug 14, 2021 134
> Population: 391,249
 24/7 Wall St.
6. Milwaukee, WI
> Increase in murders, 2021-2022 YTD +34.5%
> Total murders; Jan. 1 – Aug 9, 2022 148
> Total murders; Jan. 1 – Aug 9, 2021 110
> Population: 592,649

5. Aurora, CO
> Increase in murders, 2021-2022 YTD +35.3%
> Total murders; Jan. 1 – June 30, 2022 23
> Total murders; Jan. 1 – June 30, 2021 17
> Population: 379,434
[in-text-ad-2]

4. Honolulu, HI
> Increase in murders, 2021-2022 YTD +36.4%
> Total murders; Jan. 1 – June 30, 2022 15
> Total murders; Jan. 1 – June 30, 2021 11
> Population: 347,181
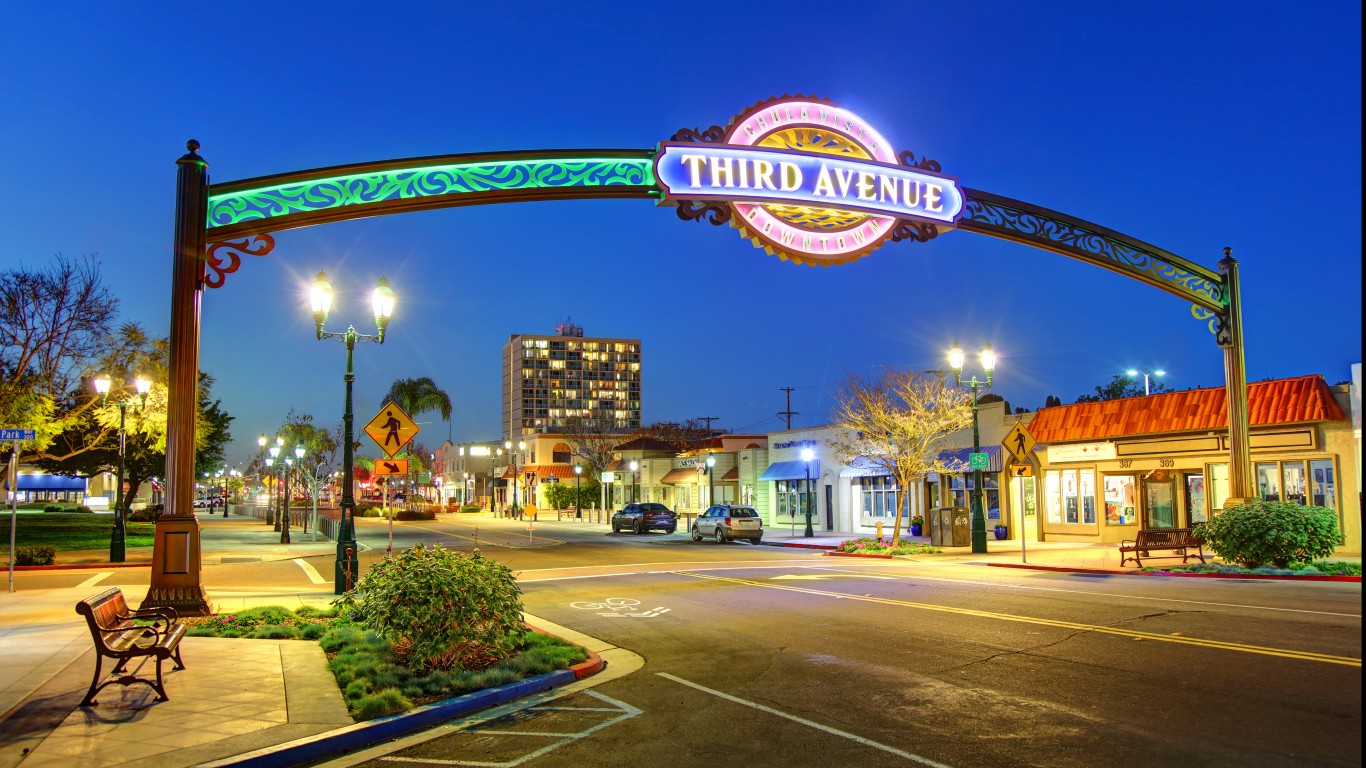
3. Chula Vista, CA
> Increase in murders, 2021-2022 YTD +66.7%
> Total murders; Jan. 1 – June 30, 2022 5
> Total murders; Jan. 1 – June 30, 2021 3
> Population: 268,779
[in-text-ad]

2. Colorado Springs, CO
> Increase in murders, 2021-2022 YTD +100.0%
> Total murders; Jan. 1 – Aug 14, 2022 26
> Total murders; Jan. 1 – Aug 14, 2021 13
> Population: 471,686

1. Virginia Beach, VA
> Increase in murders, 2021-2022 YTD +114.3%
> Total murders; Jan. 1 – Aug 9, 2022 15
> Total murders; Jan. 1 – Aug 9, 2021 7
> Population: 450,882
Are You Still Paying With a Debit Card?
The average American spends $17,274 on debit cards a year, and it’s a HUGE mistake. First, debit cards don’t have the same fraud protections as credit cards. Once your money is gone, it’s gone. But more importantly you can actually get something back from this spending every time you swipe.
Issuers are handing out wild bonuses right now. With some you can earn up to 5% back on every purchase. That’s like getting a 5% discount on everything you buy!
Our top pick is kind of hard to imagine. Not only does it pay up to 5% back, it also includes a $200 cash back reward in the first six months, a 0% intro APR, and…. $0 annual fee. It’s quite literally free money for any one that uses a card regularly. Click here to learn more!
Flywheel Publishing has partnered with CardRatings to provide coverage of credit card products. Flywheel Publishing and CardRatings may receive a commission from card issuers.
Thank you for reading! Have some feedback for us?
Contact the 24/7 Wall St. editorial team.
Latest from 24/7


Our expert who first called NVIDIA in 2009 is predicting 2025 will see a historic AI breakthrough.
You can follow him investing $500,000 of his own money on our top AI stocks for free.