Paying attention and driving carefully is important every time drivers get behind the wheel, but it is especially important in work zones, where laborers perform highway construction, maintenance, or utility work. Because they often have uneven roads and workers close to traffic, work zones are places where accidents are all too common.
Though there are many safety measures in place to make work zones safe, there are still hundreds of accidents in these zones every year. Unfortunately, many of these crashes are fatal. More than 4,000 drivers, passengers, workers, pedestrians, and others were killed in work zones from 2016 to 2020. Such accidents are much more common in some states than others.
To determine the states with the deadliest work zones, 24/7 Wall St. reviewed data from the National Highway Traffic Safety Administration. States were ranked on the rate of auto-related deaths in work zones per million licensed drivers for the years 2016-2020. Other non-occupants were included in the worker, pedestrian, and cyclist category.
From 2016 to 2020, there were 17.8 work zone fatalities per million licensed drivers across the U.S. In the safest state, the work zone fatality rate was 2.6 fatalities per million licensed drivers. In the two deadliest states, there were more than 40 work zone fatalities per million licensed drivers. (See also, this state has worst highways in America.)
It can be difficult to determine why some states are much more prone to work zone fatalities than others. Research indicates that many auto collisions taking place within work zones are not recorded as work-zone accidents, and many of those that are recorded had nothing to do with work zone activities.
It stands to reason that states with more work zones have more opportunity for accidents. Many states have a high share of roads and bridges that are structurally deficient. These are the states with the most structurally deficient bridges.
Click here to see states where work zone car crashes kill the most people.

50. New York
> Work zone fatality rate: 2.62 deaths per million licensed drivers
> Total work zone fatalities, 2016-2020: 32
> Vehicle occupant fatalities: 17
> Worker, pedestrian, and cyclist fatalities: 15
[in-text-ad]

49. Washington
> Work zone fatality rate: 5.16 deaths per million licensed drivers
> Total work zone fatalities, 2016-2020: 30
> Vehicle occupant fatalities: 27
> Worker, pedestrian, and cyclist fatalities: 3

48. Massachusetts
> Work zone fatality rate: 5.87 deaths per million licensed drivers
> Total work zone fatalities, 2016-2020: 29
> Vehicle occupant fatalities: 23
> Worker, pedestrian, and cyclist fatalities: 6
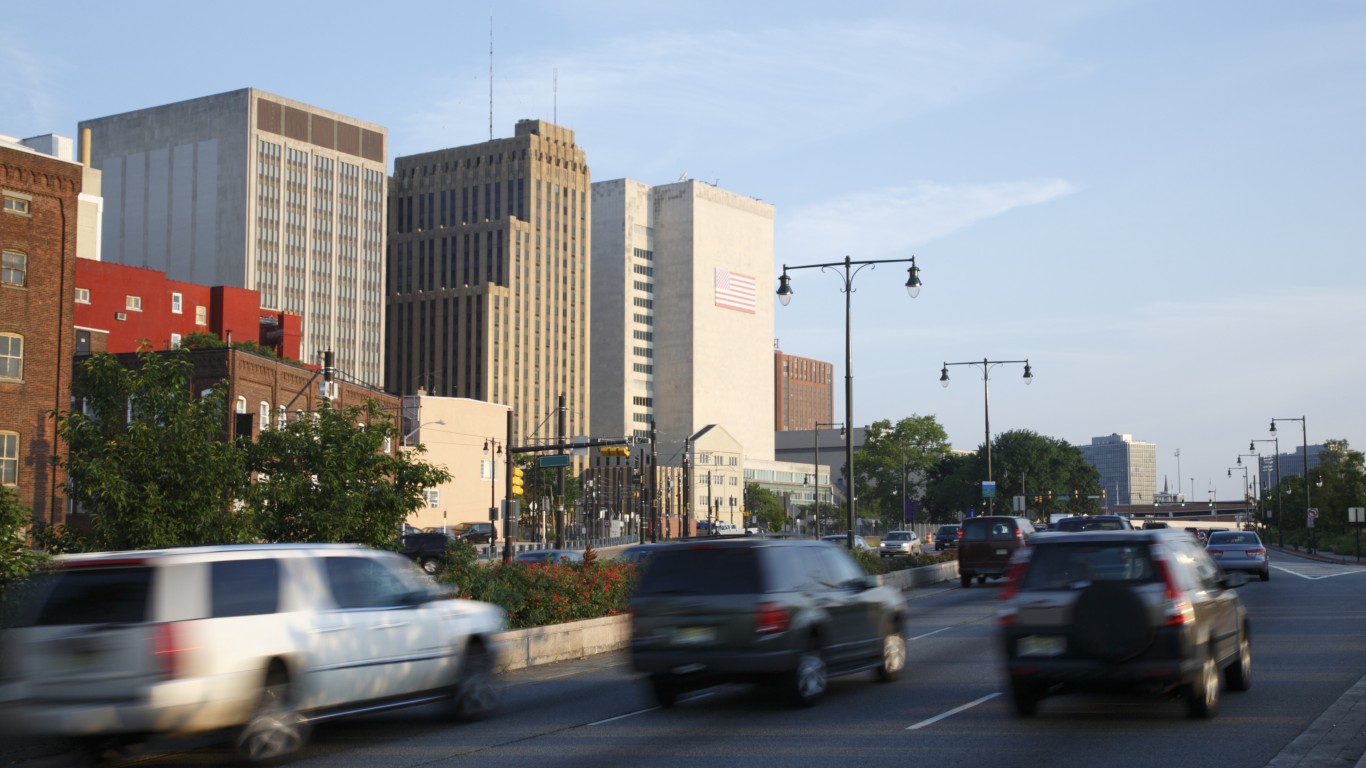
47. New Jersey
> Work zone fatality rate: 6.10 deaths per million licensed drivers
> Total work zone fatalities, 2016-2020: 38
> Vehicle occupant fatalities: 34
> Worker, pedestrian, and cyclist fatalities: 4
[in-text-ad-2]

46. Connecticut
> Work zone fatality rate: 7.18 deaths per million licensed drivers
> Total work zone fatalities, 2016-2020: 18
> Vehicle occupant fatalities: 16
> Worker, pedestrian, and cyclist fatalities: 2
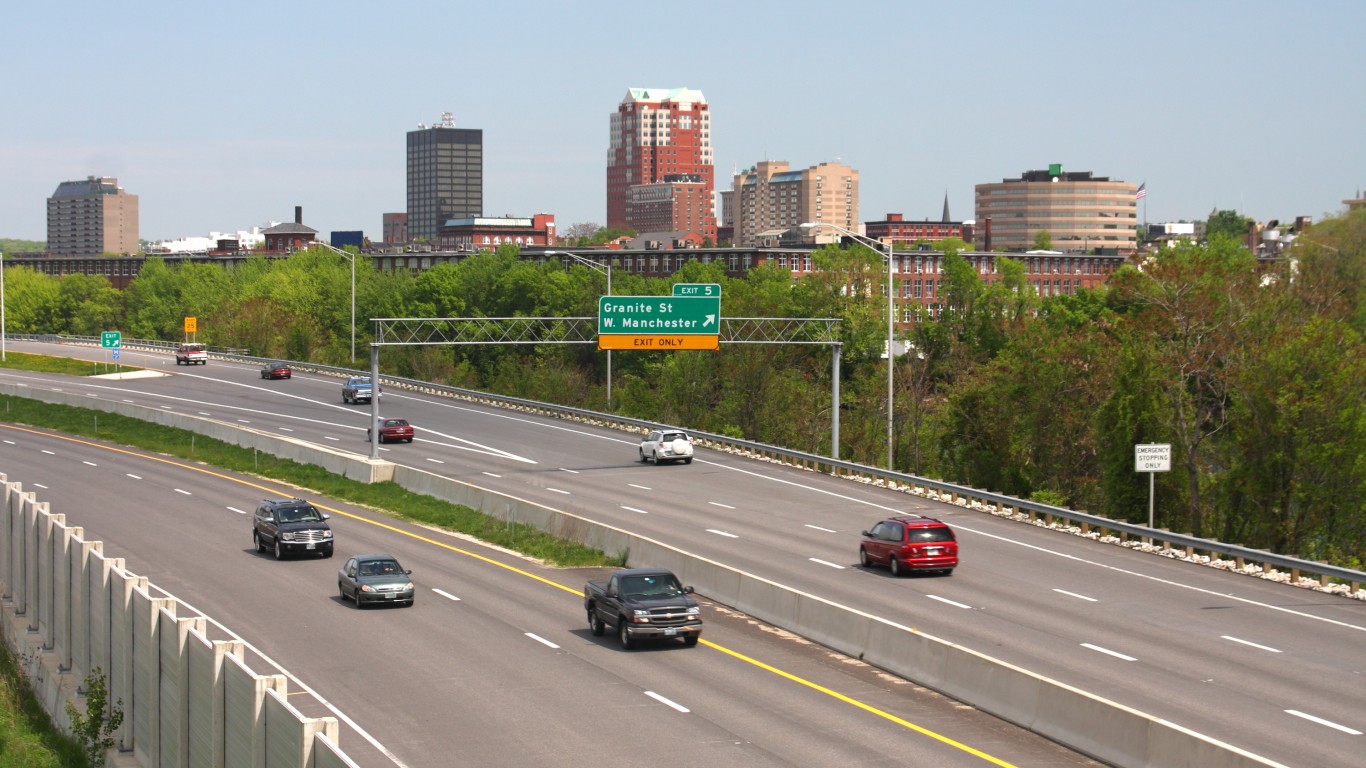
45. New Hampshire
> Work zone fatality rate: 7.54 deaths per million licensed drivers
> Total work zone fatalities, 2016-2020: 8
> Vehicle occupant fatalities: 5
> Worker, pedestrian, and cyclist fatalities: 3
[in-text-ad]

44. Rhode Island
> Work zone fatality rate: 8.20 deaths per million licensed drivers
> Total work zone fatalities, 2016-2020: 6
> Vehicle occupant fatalities: 4
> Worker, pedestrian, and cyclist fatalities: 2

43. Vermont
> Work zone fatality rate: 8.68 deaths per million licensed drivers
> Total work zone fatalities, 2016-2020: 4
> Vehicle occupant fatalities: 2
> Worker, pedestrian, and cyclist fatalities: 2
42. Oregon
> Work zone fatality rate: 9.17 deaths per million licensed drivers
> Total work zone fatalities, 2016-2020: 27
> Vehicle occupant fatalities: 21
> Worker, pedestrian, and cyclist fatalities: 6
[in-text-ad-2]
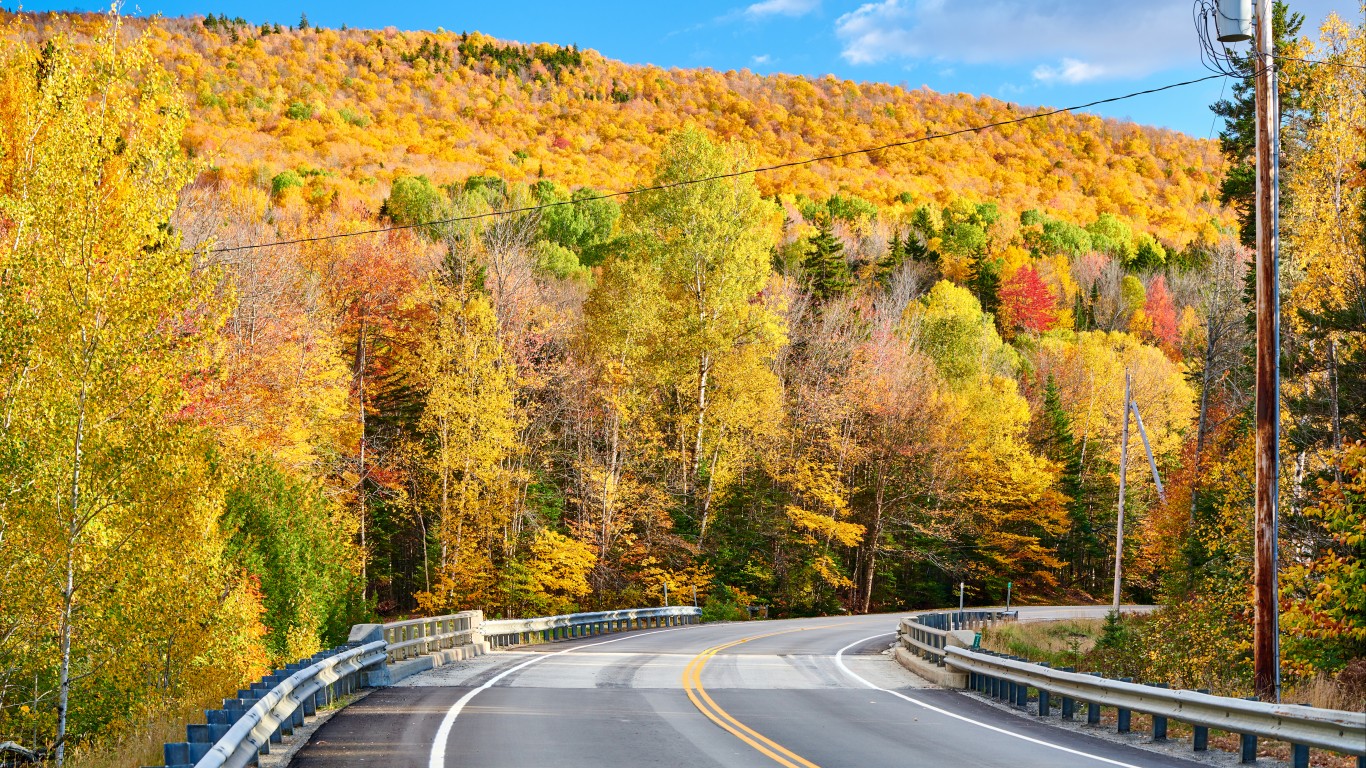
41. Maine
> Work zone fatality rate: 9.54 deaths per million licensed drivers
> Total work zone fatalities, 2016-2020: 10
> Vehicle occupant fatalities: 9
> Worker, pedestrian, and cyclist fatalities: 1

40. Maryland
> Work zone fatality rate: 9.88 deaths per million licensed drivers
> Total work zone fatalities, 2016-2020: 44
> Vehicle occupant fatalities: 25
> Worker, pedestrian, and cyclist fatalities: 19
[in-text-ad]

39. Virginia
> Work zone fatality rate: 9.98 deaths per million licensed drivers
> Total work zone fatalities, 2016-2020: 59
> Vehicle occupant fatalities: 48
> Worker, pedestrian, and cyclist fatalities: 11
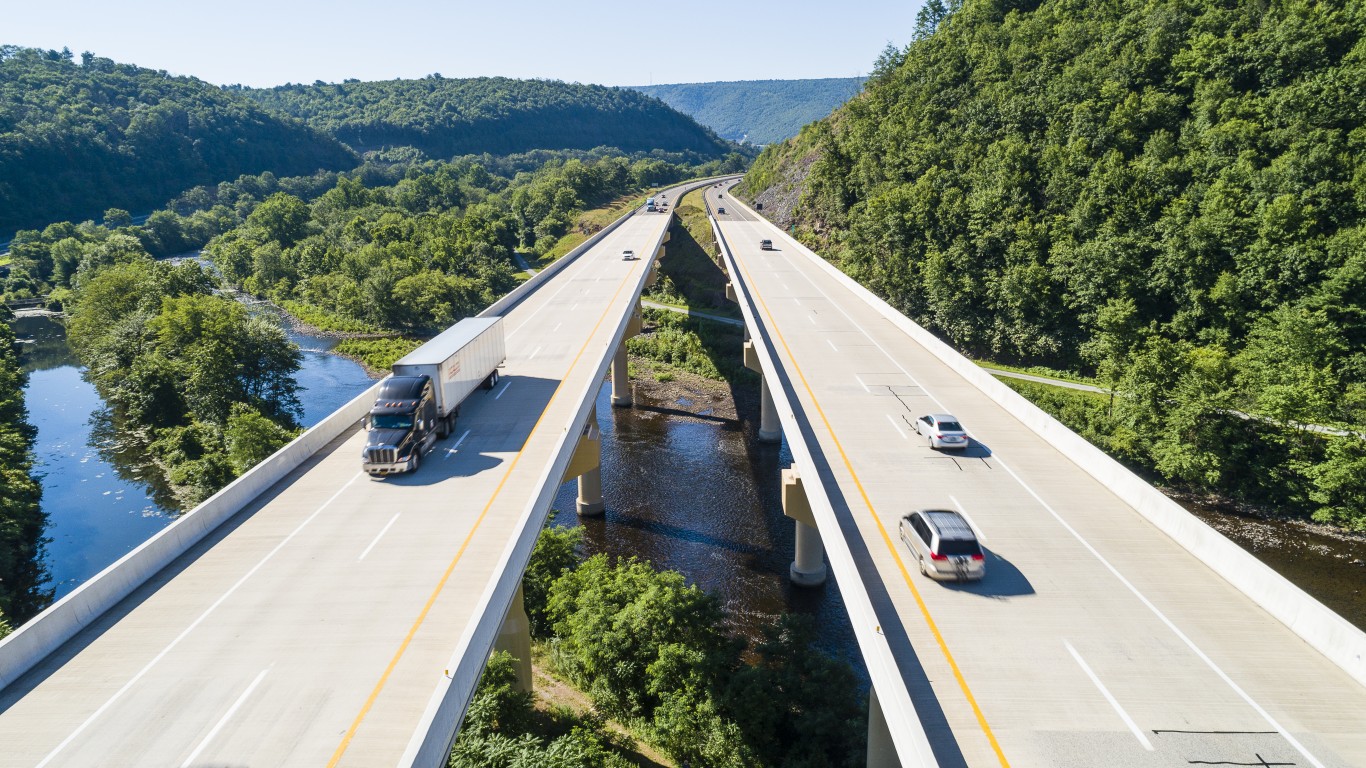
38. Pennsylvania
> Work zone fatality rate: 10.19 deaths per million licensed drivers
> Total work zone fatalities, 2016-2020: 91
> Vehicle occupant fatalities: 79
> Worker, pedestrian, and cyclist fatalities: 12
37. Colorado
> Work zone fatality rate: 11.16 deaths per million licensed drivers
> Total work zone fatalities, 2016-2020: 48
> Vehicle occupant fatalities: 37
> Worker, pedestrian, and cyclist fatalities: 11
[in-text-ad-2]

36. North Carolina
> Work zone fatality rate: 11.39 deaths per million licensed drivers
> Total work zone fatalities, 2016-2020: 87
> Vehicle occupant fatalities: 67
> Worker, pedestrian, and cyclist fatalities: 20
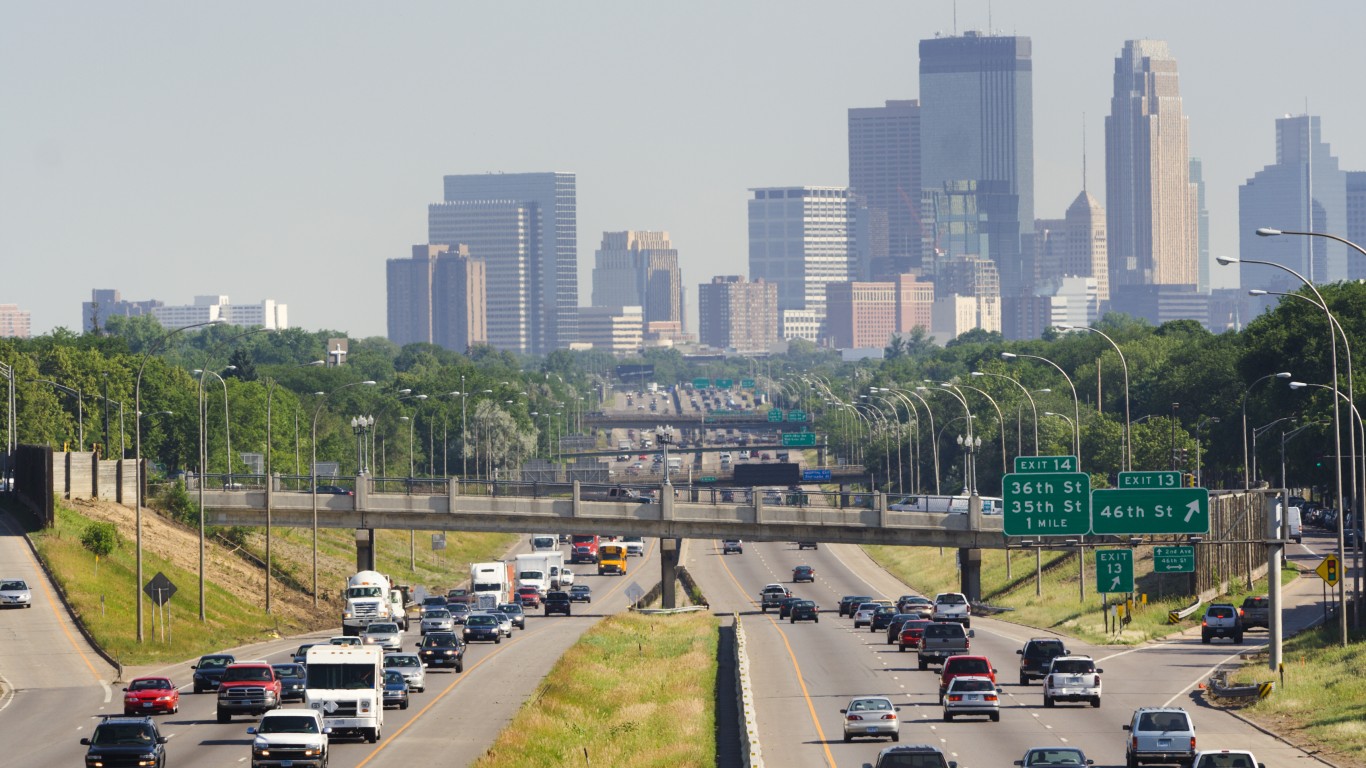
35. Minnesota
> Work zone fatality rate: 12.47 deaths per million licensed drivers
> Total work zone fatalities, 2016-2020: 51
> Vehicle occupant fatalities: 38
> Worker, pedestrian, and cyclist fatalities: 13
[in-text-ad]
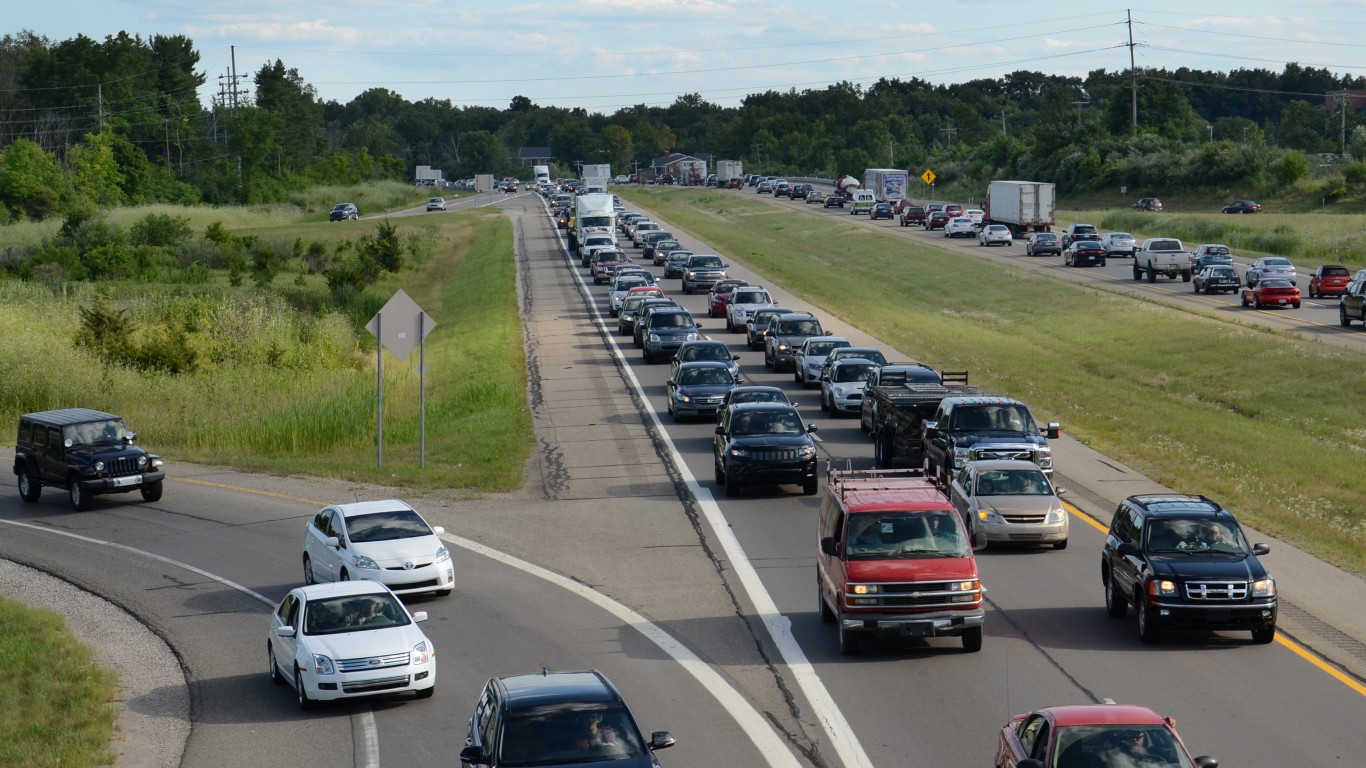
34. Michigan
> Work zone fatality rate: 12.81 deaths per million licensed drivers
> Total work zone fatalities, 2016-2020: 90
> Vehicle occupant fatalities: 68
> Worker, pedestrian, and cyclist fatalities: 22

33. Ohio
> Work zone fatality rate: 13.21 deaths per million licensed drivers
> Total work zone fatalities, 2016-2020: 107
> Vehicle occupant fatalities: 83
> Worker, pedestrian, and cyclist fatalities: 24
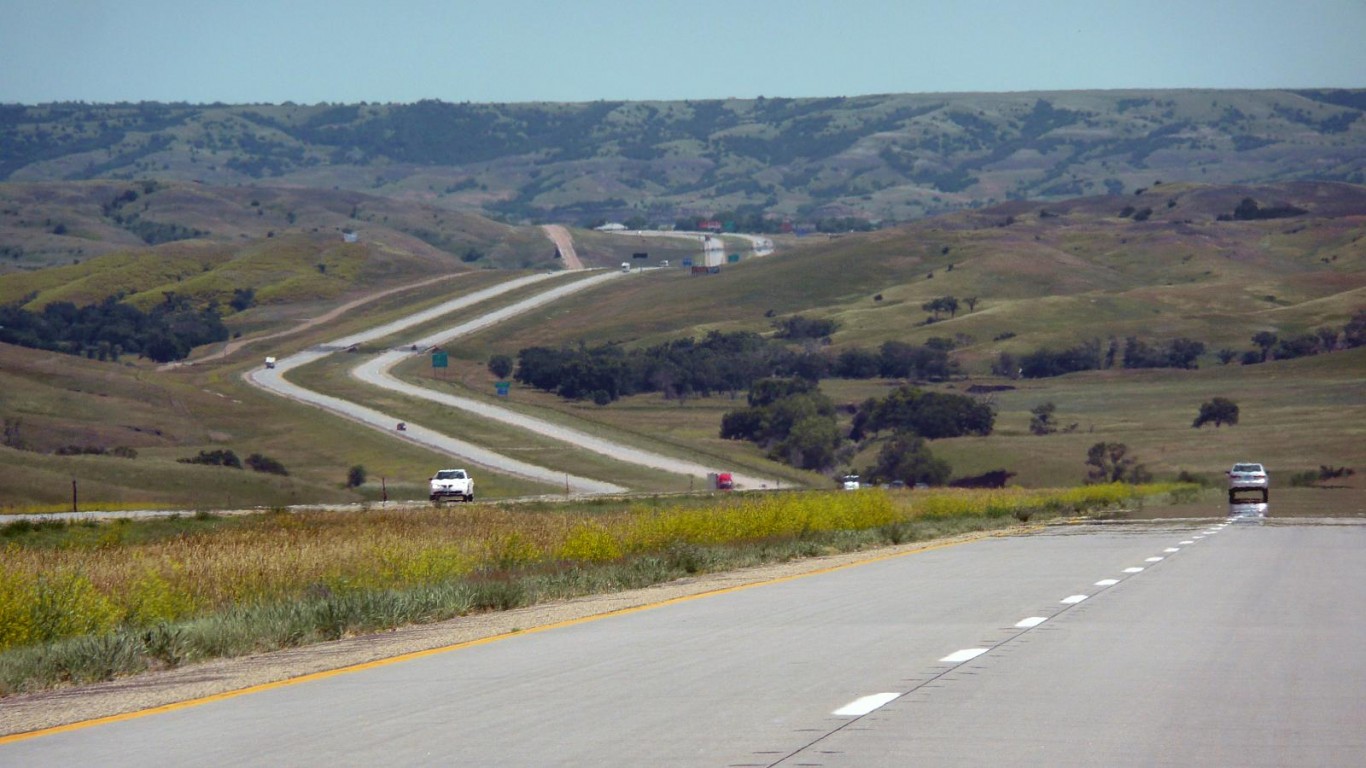
32. South Dakota
> Work zone fatality rate: 13.68 deaths per million licensed drivers
> Total work zone fatalities, 2016-2020: 9
> Vehicle occupant fatalities: 7
> Worker, pedestrian, and cyclist fatalities: 2
[in-text-ad-2]

31. California
> Work zone fatality rate: 13.74 deaths per million licensed drivers
> Total work zone fatalities, 2016-2020: 371
> Vehicle occupant fatalities: 291
> Worker, pedestrian, and cyclist fatalities: 80
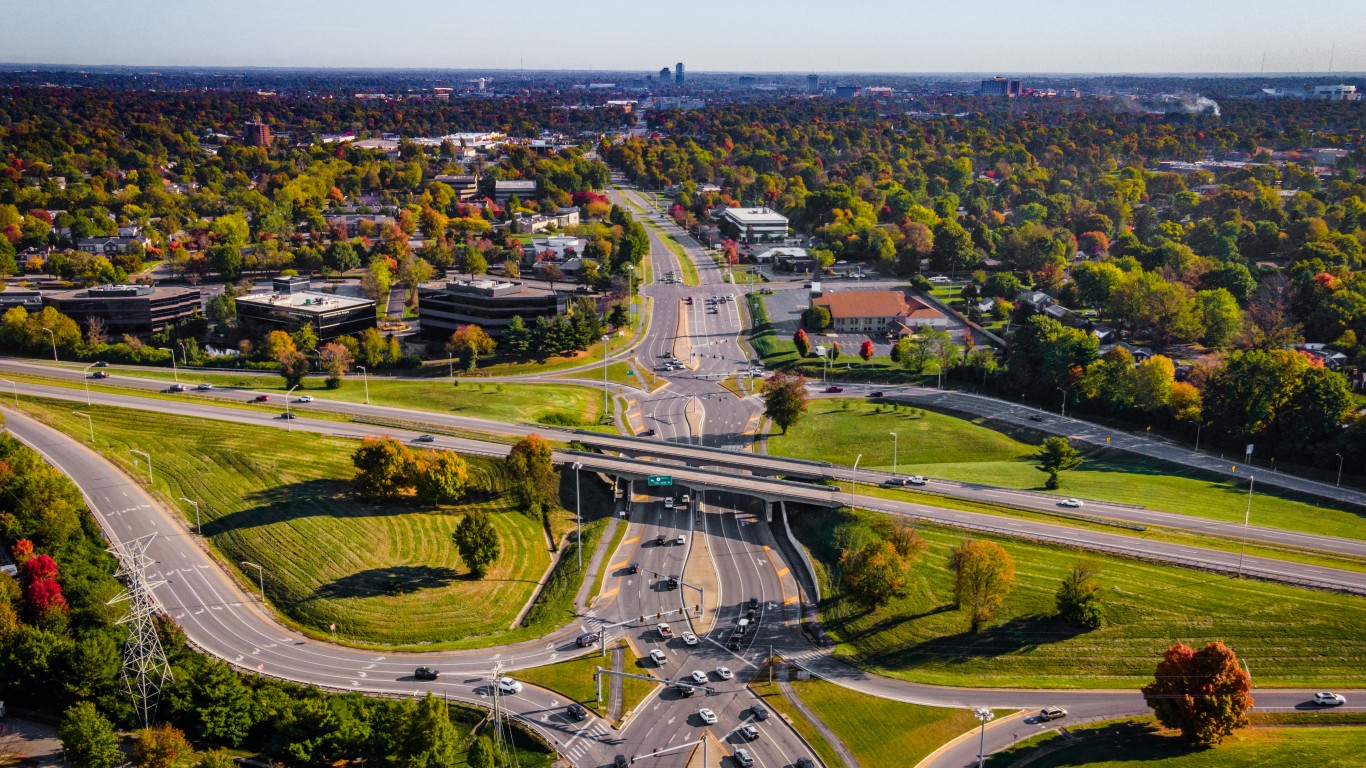
30. Kentucky
> Work zone fatality rate: 13.77 deaths per million licensed drivers
> Total work zone fatalities, 2016-2020: 40
> Vehicle occupant fatalities: 38
> Worker, pedestrian, and cyclist fatalities: 2
[in-text-ad]

29. South Carolina
> Work zone fatality rate: 14.34 deaths per million licensed drivers
> Total work zone fatalities, 2016-2020: 56
> Vehicle occupant fatalities: 47
> Worker, pedestrian, and cyclist fatalities: 9
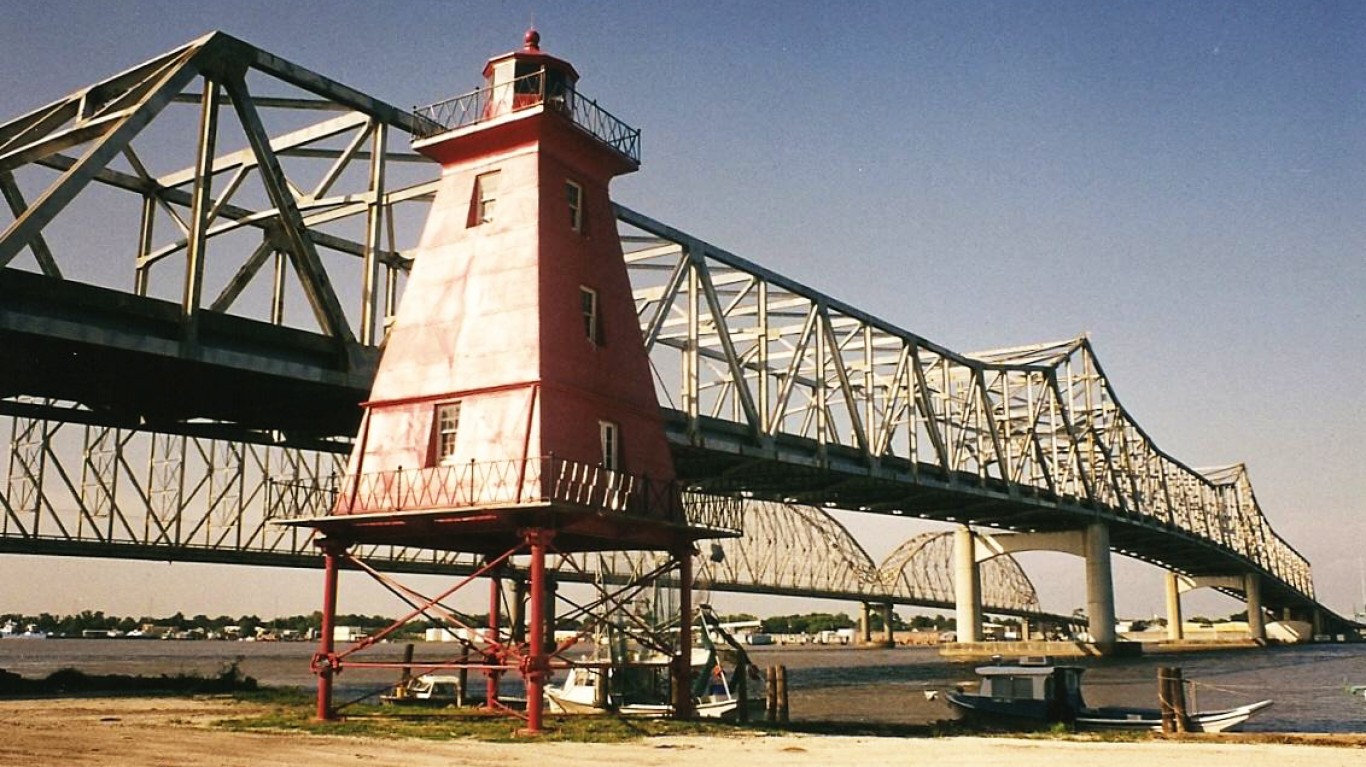
28. Louisiana
> Work zone fatality rate: 14.63 deaths per million licensed drivers
> Total work zone fatalities, 2016-2020: 50
> Vehicle occupant fatalities: 46
> Worker, pedestrian, and cyclist fatalities: 4
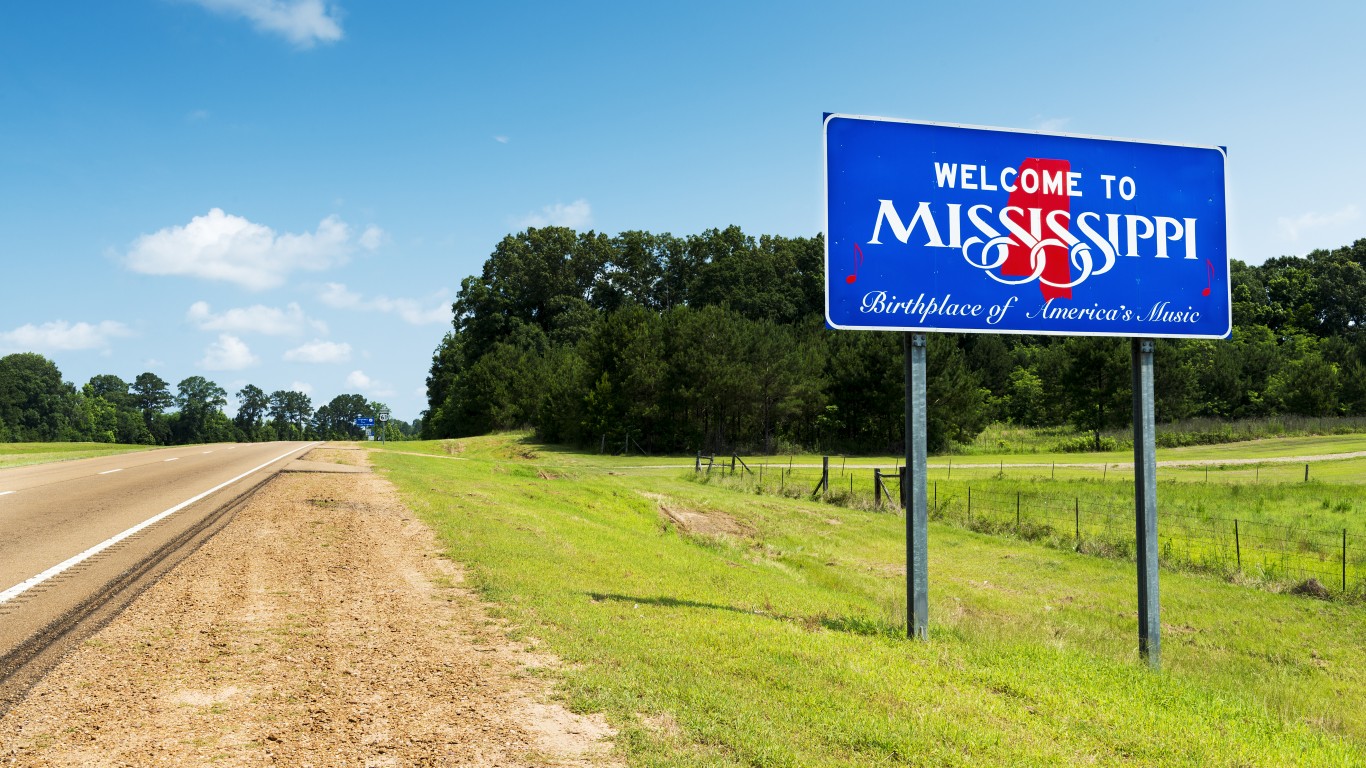
27. Mississippi
> Work zone fatality rate: 14.87 deaths per million licensed drivers
> Total work zone fatalities, 2016-2020: 30
> Vehicle occupant fatalities: 29
> Worker, pedestrian, and cyclist fatalities: 1
[in-text-ad-2]
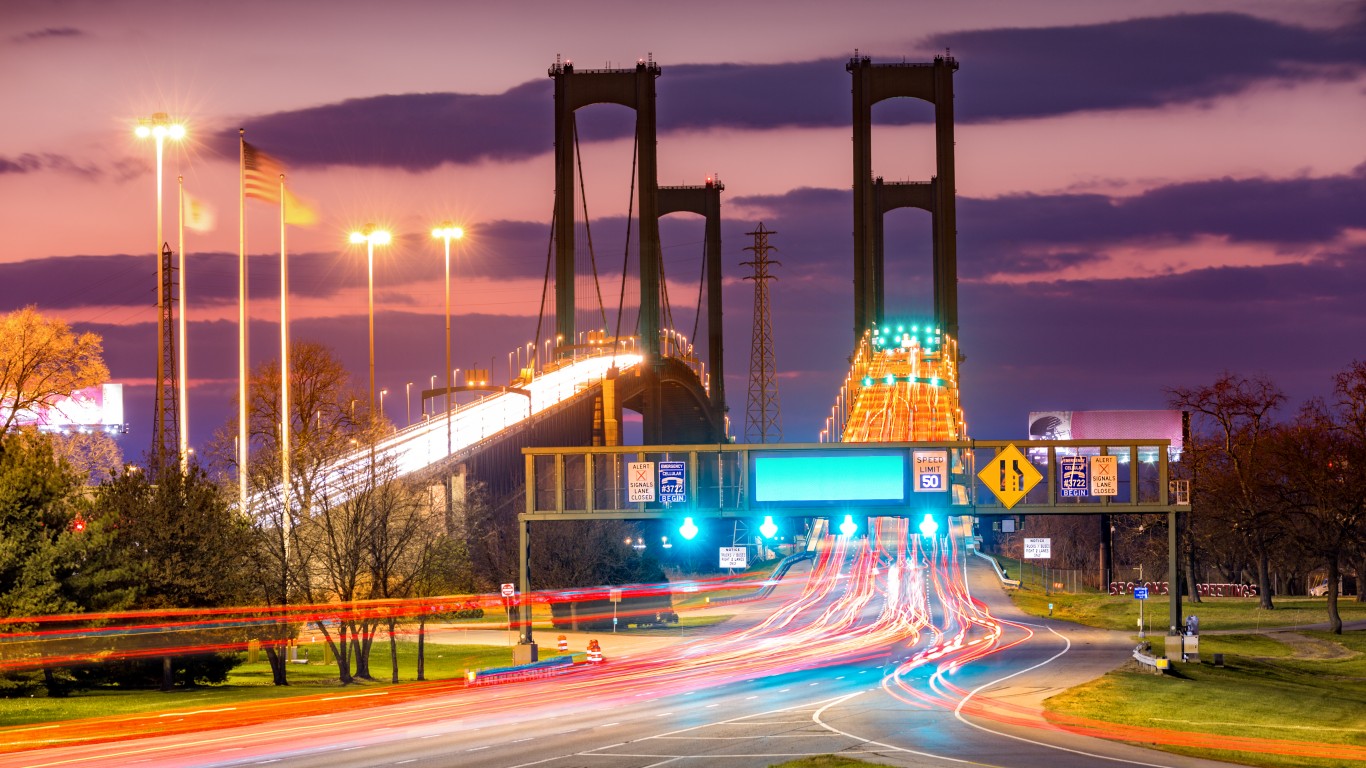
26. Delaware
> Work zone fatality rate: 15.68 deaths per million licensed drivers
> Total work zone fatalities, 2016-2020: 13
> Vehicle occupant fatalities: 12
> Worker, pedestrian, and cyclist fatalities: 1

25. Arizona
> Work zone fatality rate: 16.37 deaths per million licensed drivers
> Total work zone fatalities, 2016-2020: 93
> Vehicle occupant fatalities: 76
> Worker, pedestrian, and cyclist fatalities: 17
[in-text-ad]
24. Kansas
> Work zone fatality rate: 16.96 deaths per million licensed drivers
> Total work zone fatalities, 2016-2020: 34
> Vehicle occupant fatalities: 31
> Worker, pedestrian, and cyclist fatalities: 3
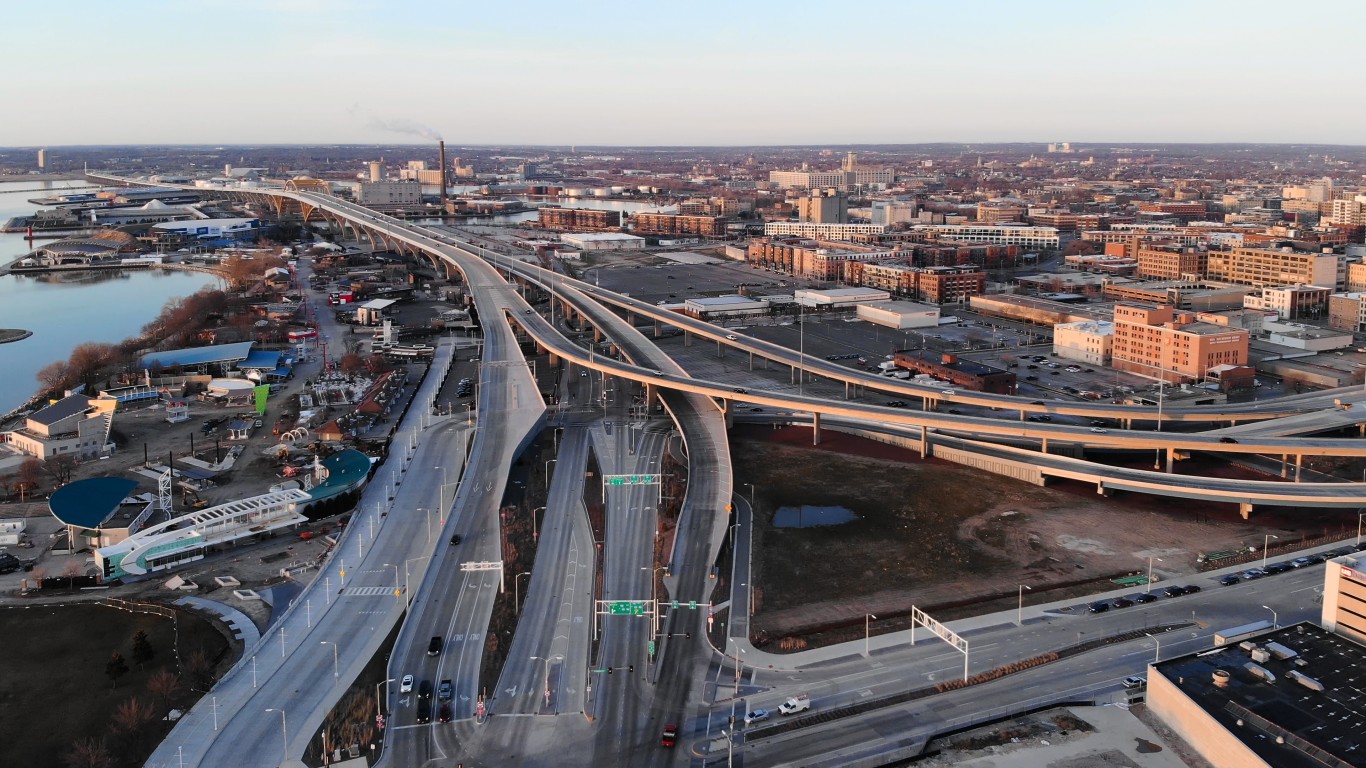
23. Wisconsin
> Work zone fatality rate: 17.15 deaths per million licensed drivers
> Total work zone fatalities, 2016-2020: 74
> Vehicle occupant fatalities: 66
> Worker, pedestrian, and cyclist fatalities: 8
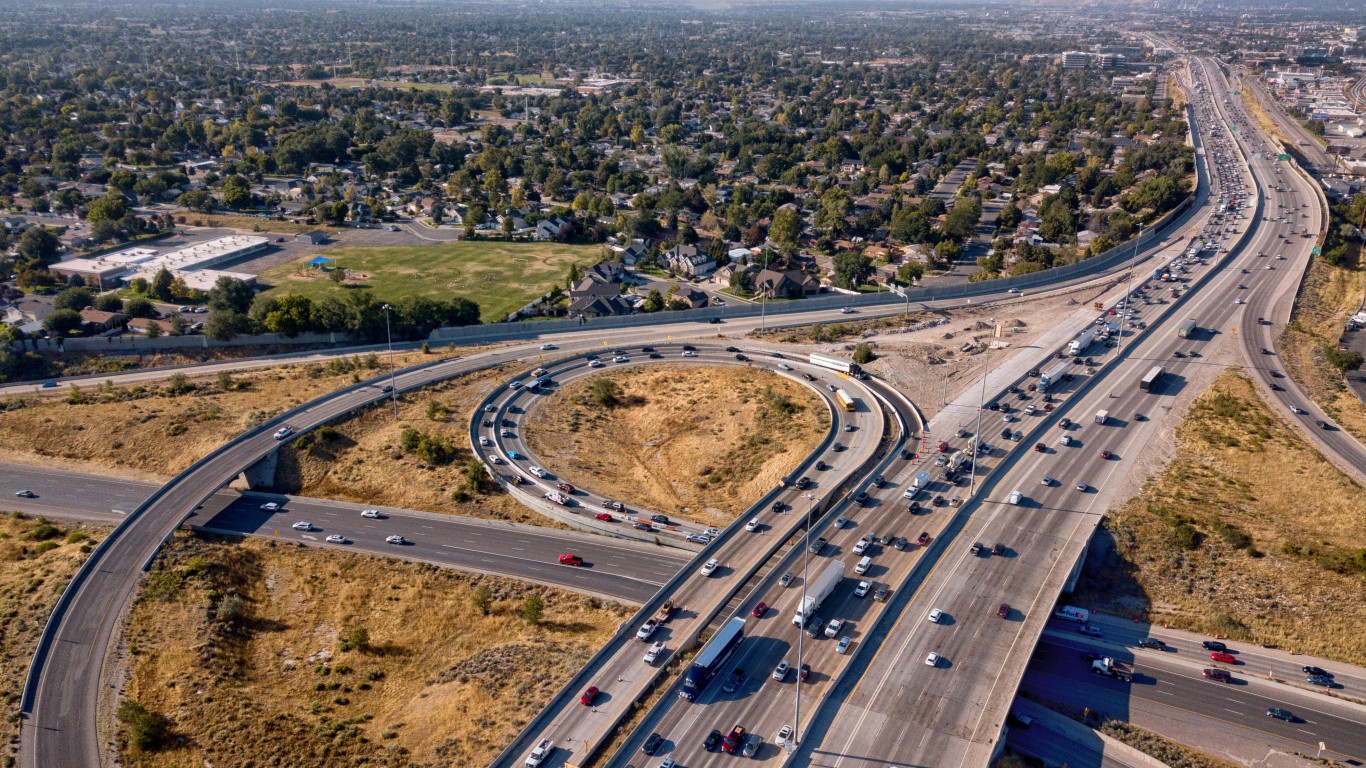
22. Utah
> Work zone fatality rate: 17.21 deaths per million licensed drivers
> Total work zone fatalities, 2016-2020: 37
> Vehicle occupant fatalities: 31
> Worker, pedestrian, and cyclist fatalities: 6
[in-text-ad-2]
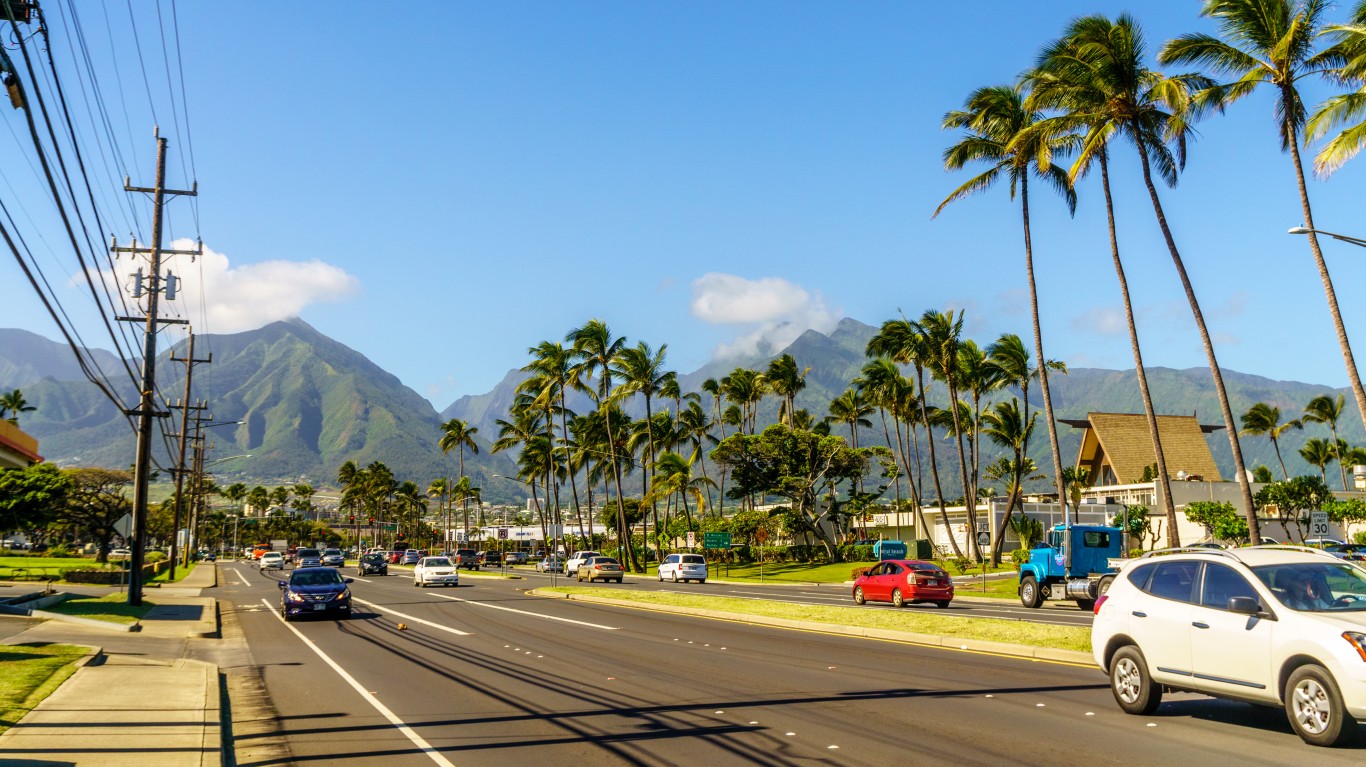
21. Hawaii
> Work zone fatality rate: 17.36 deaths per million licensed drivers
> Total work zone fatalities, 2016-2020: 16
> Vehicle occupant fatalities: 9
> Worker, pedestrian, and cyclist fatalities: 7
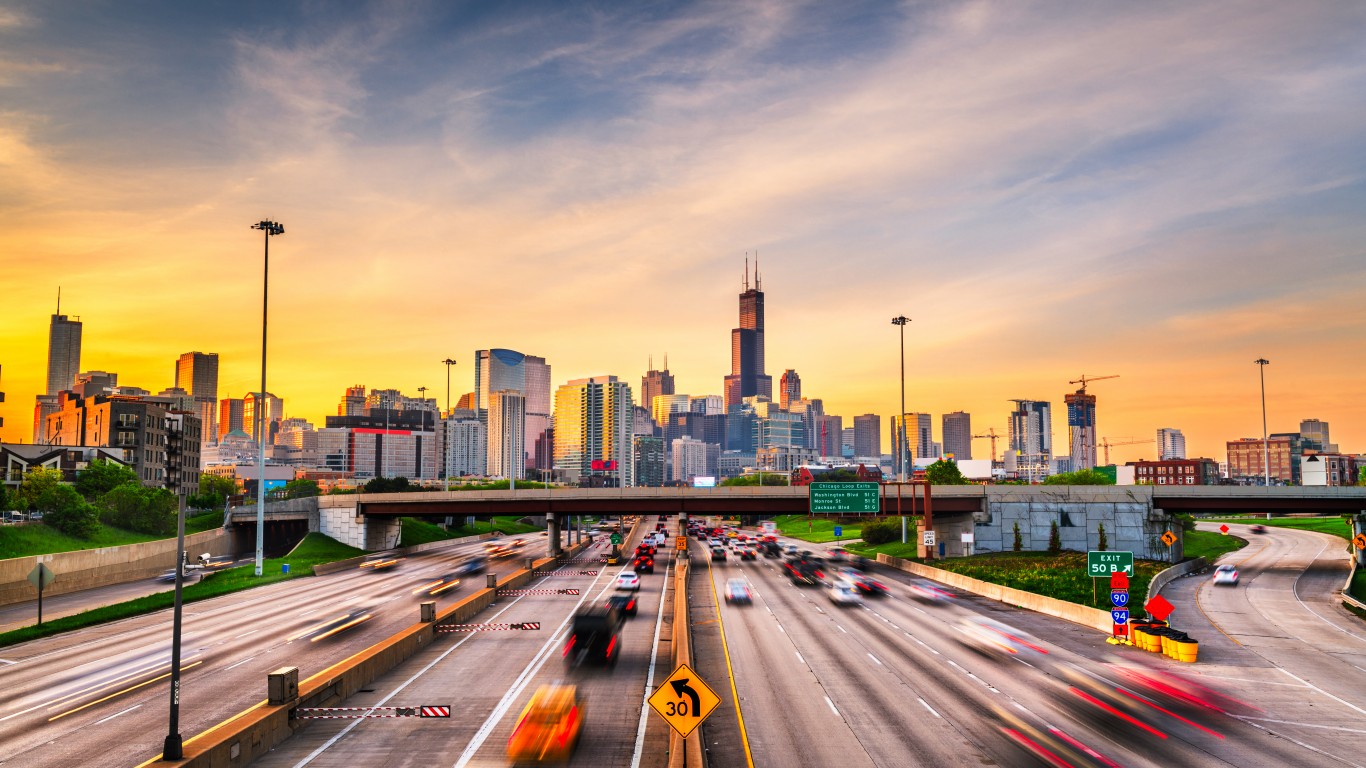
20. Illinois
> Work zone fatality rate: 18.24 deaths per million licensed drivers
> Total work zone fatalities, 2016-2020: 150
> Vehicle occupant fatalities: 138
> Worker, pedestrian, and cyclist fatalities: 12
[in-text-ad]
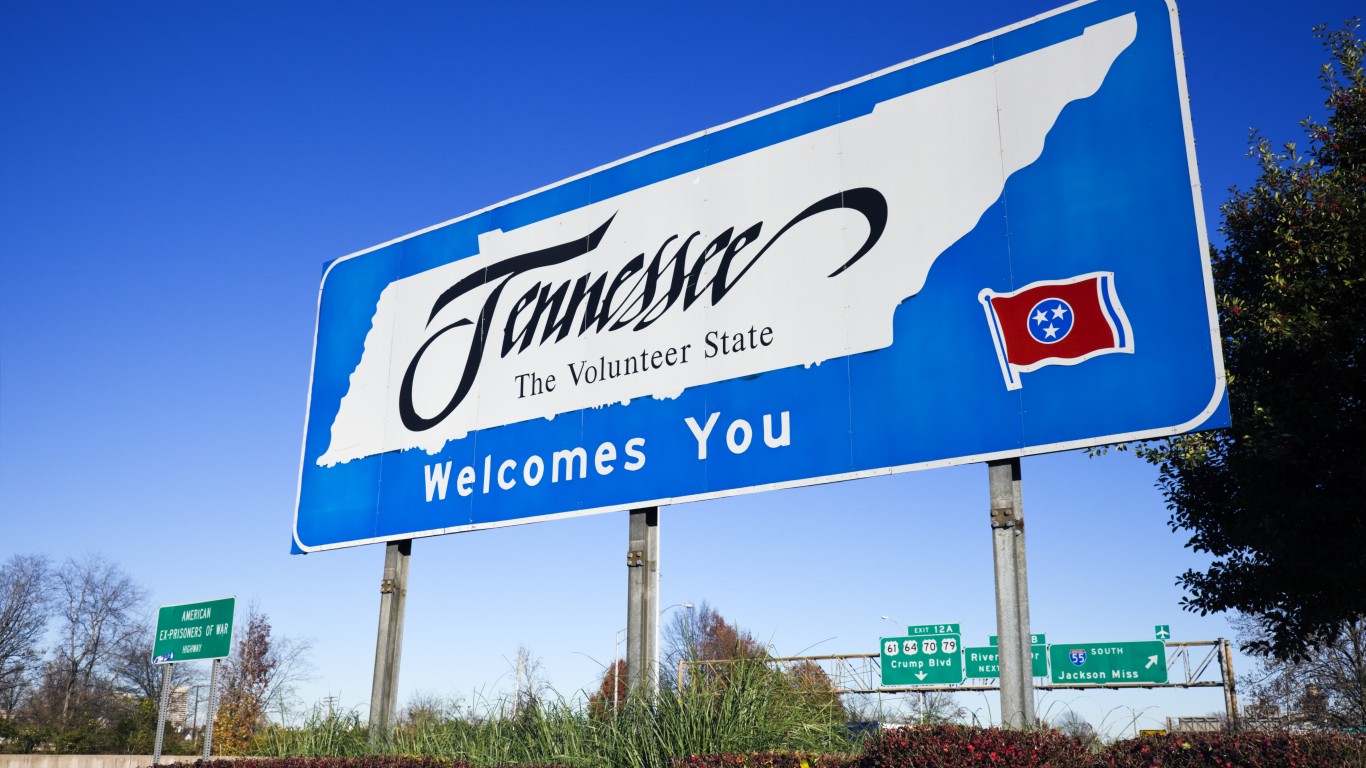
19. Tennessee
> Work zone fatality rate: 18.45 deaths per million licensed drivers
> Total work zone fatalities, 2016-2020: 90
> Vehicle occupant fatalities: 77
> Worker, pedestrian, and cyclist fatalities: 13

18. Idaho
> Work zone fatality rate: 19.45 deaths per million licensed drivers
> Total work zone fatalities, 2016-2020: 25
> Vehicle occupant fatalities: 25
> Worker, pedestrian, and cyclist fatalities: 0

17. Iowa
> Work zone fatality rate: 19.83 deaths per million licensed drivers
> Total work zone fatalities, 2016-2020: 45
> Vehicle occupant fatalities: 39
> Worker, pedestrian, and cyclist fatalities: 6
[in-text-ad-2]
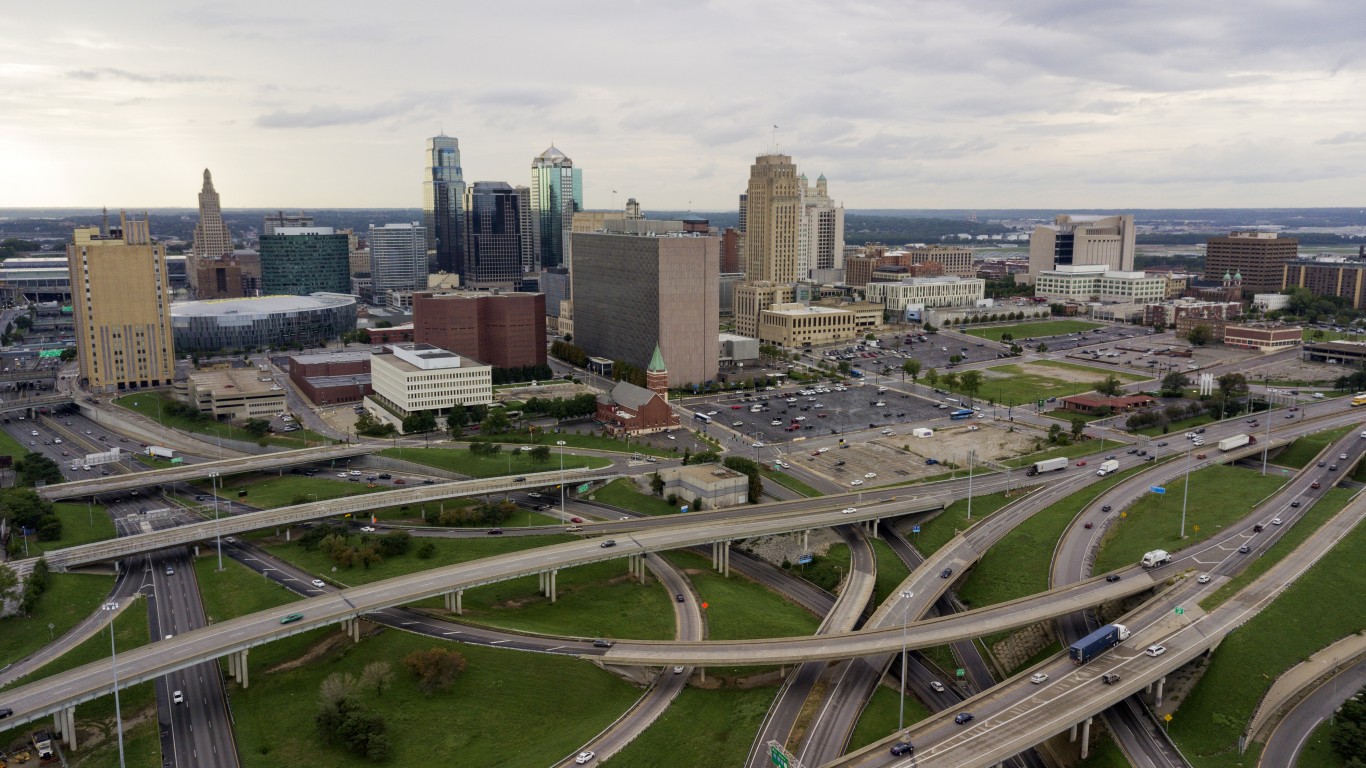
16. Missouri
> Work zone fatality rate: 20.19 deaths per million licensed drivers
> Total work zone fatalities, 2016-2020: 86
> Vehicle occupant fatalities: 76
> Worker, pedestrian, and cyclist fatalities: 10

15. Alaska
> Work zone fatality rate: 21.20 deaths per million licensed drivers
> Total work zone fatalities, 2016-2020: 11
> Vehicle occupant fatalities: 10
> Worker, pedestrian, and cyclist fatalities: 1
[in-text-ad]

14. West Virginia
> Work zone fatality rate: 21.78 deaths per million licensed drivers
> Total work zone fatalities, 2016-2020: 24
> Vehicle occupant fatalities: 19
> Worker, pedestrian, and cyclist fatalities: 5

13. Nevada
> Work zone fatality rate: 22.37 deaths per million licensed drivers
> Total work zone fatalities, 2016-2020: 46
> Vehicle occupant fatalities: 40
> Worker, pedestrian, and cyclist fatalities: 6
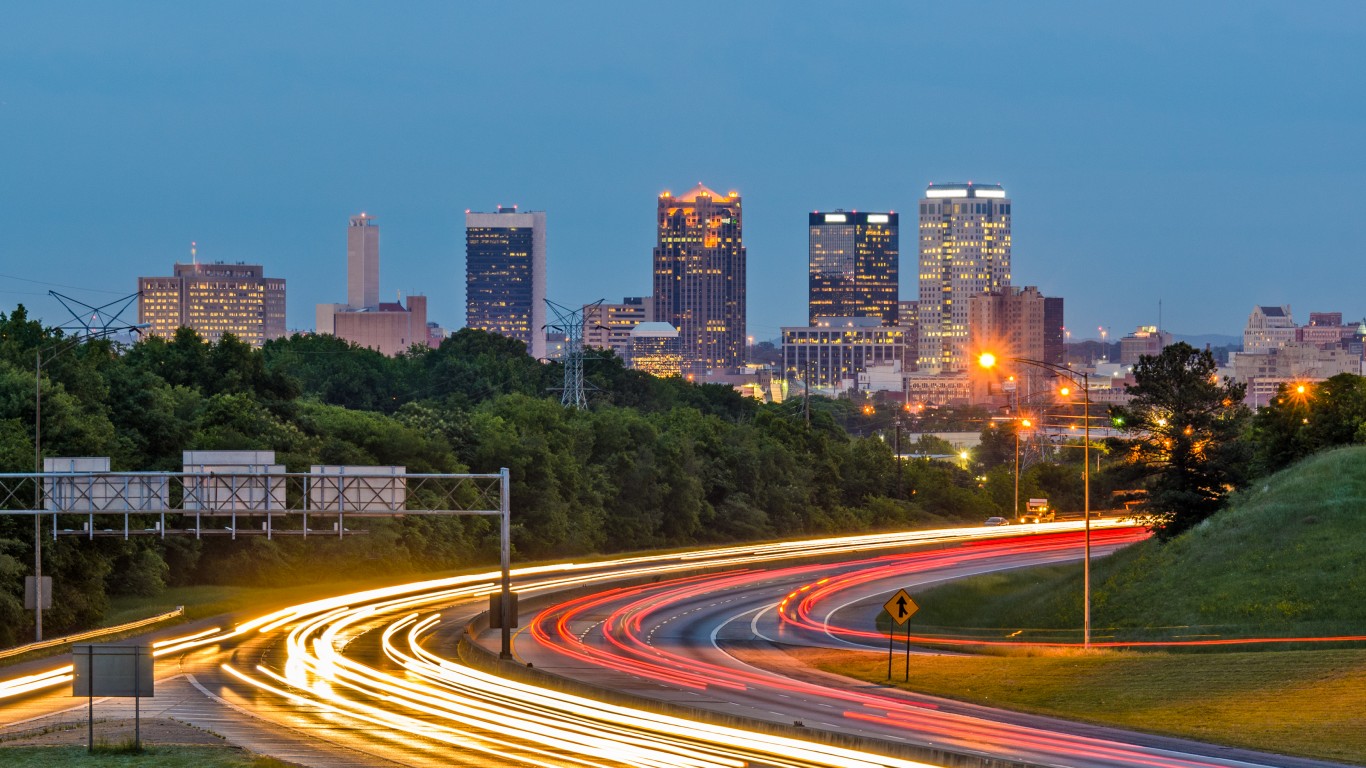
12. Alabama
> Work zone fatality rate: 23.75 deaths per million licensed drivers
> Total work zone fatalities, 2016-2020: 96
> Vehicle occupant fatalities: 74
> Worker, pedestrian, and cyclist fatalities: 22
[in-text-ad-2]
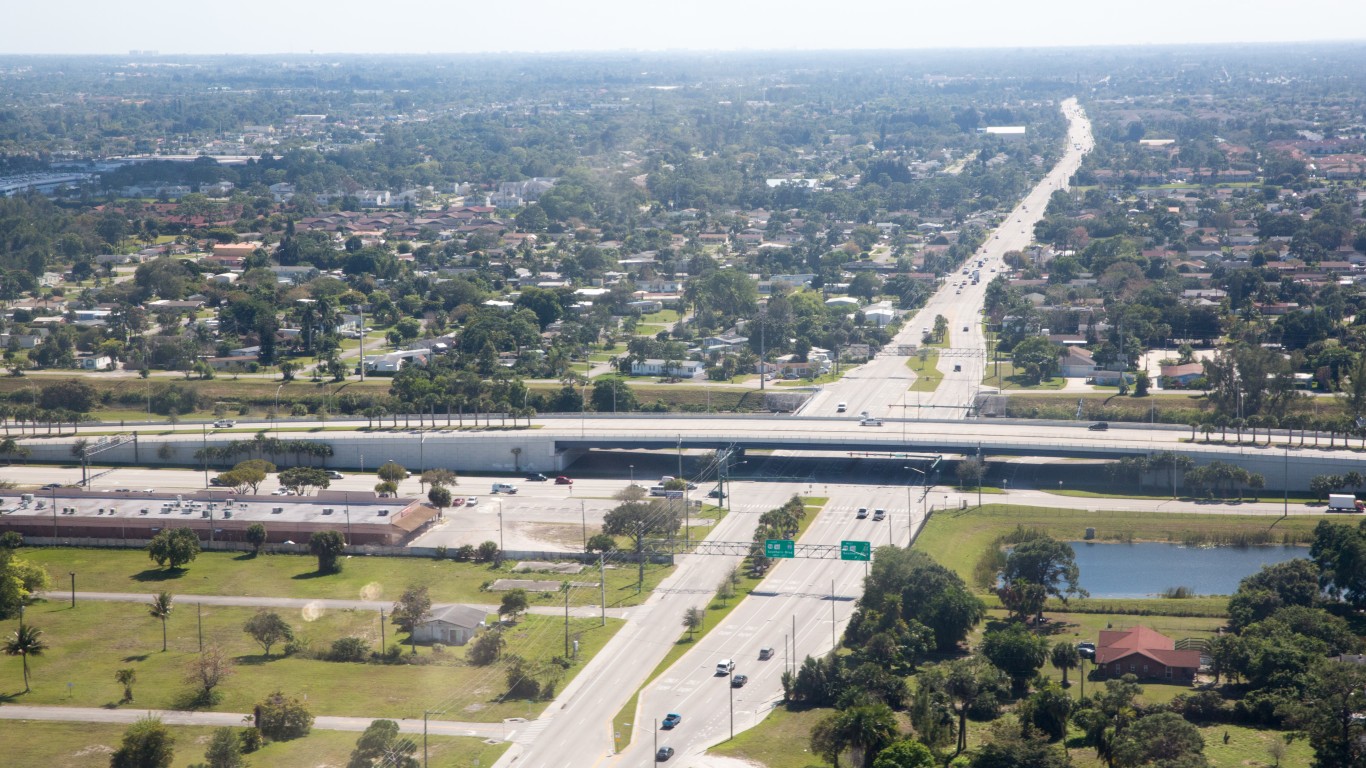
11. Florida
> Work zone fatality rate: 24.12 deaths per million licensed drivers
> Total work zone fatalities, 2016-2020: 379
> Vehicle occupant fatalities: 302
> Worker, pedestrian, and cyclist fatalities: 77
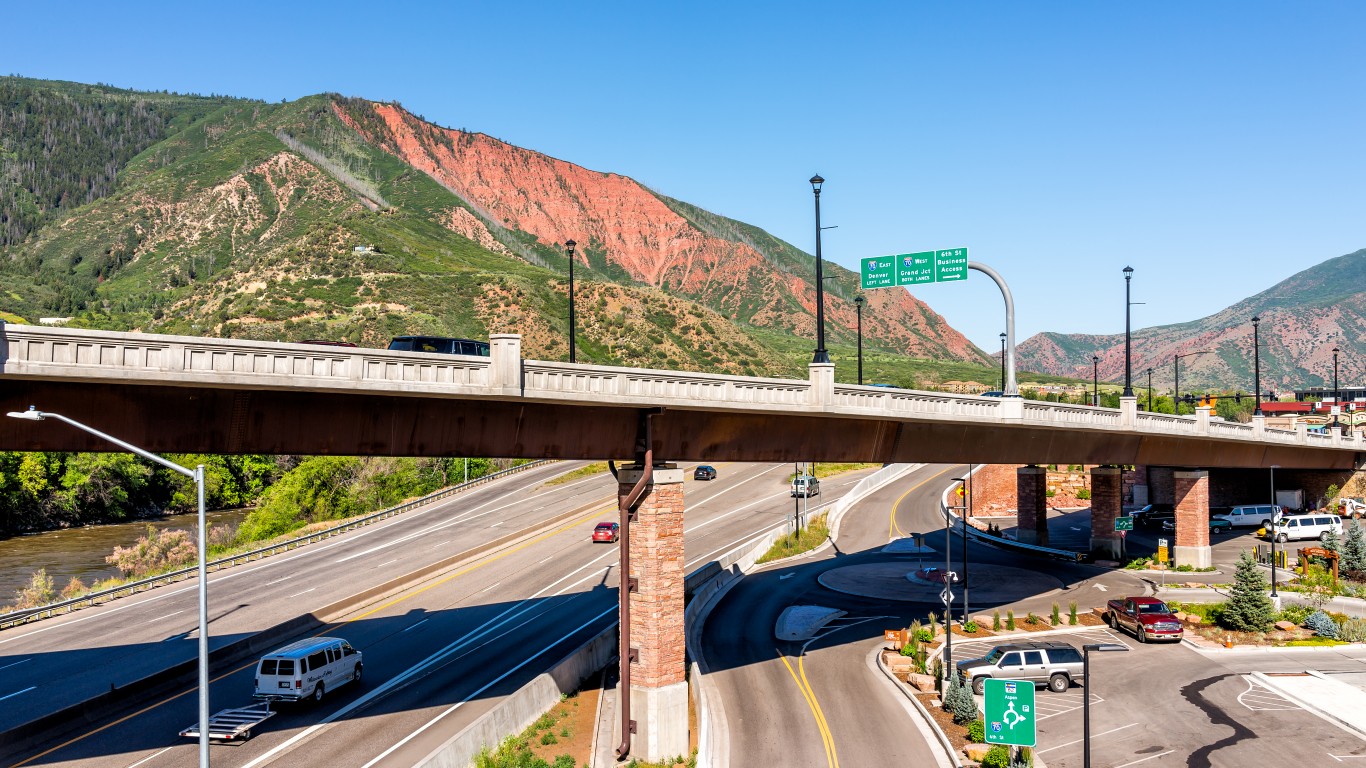
10. Montana
> Work zone fatality rate: 24.19 deaths per million licensed drivers
> Total work zone fatalities, 2016-2020: 20
> Vehicle occupant fatalities: 19
> Worker, pedestrian, and cyclist fatalities: 1
[in-text-ad]

9. New Mexico
> Work zone fatality rate: 25.12 deaths per million licensed drivers
> Total work zone fatalities, 2016-2020: 37
> Vehicle occupant fatalities: 26
> Worker, pedestrian, and cyclist fatalities: 11
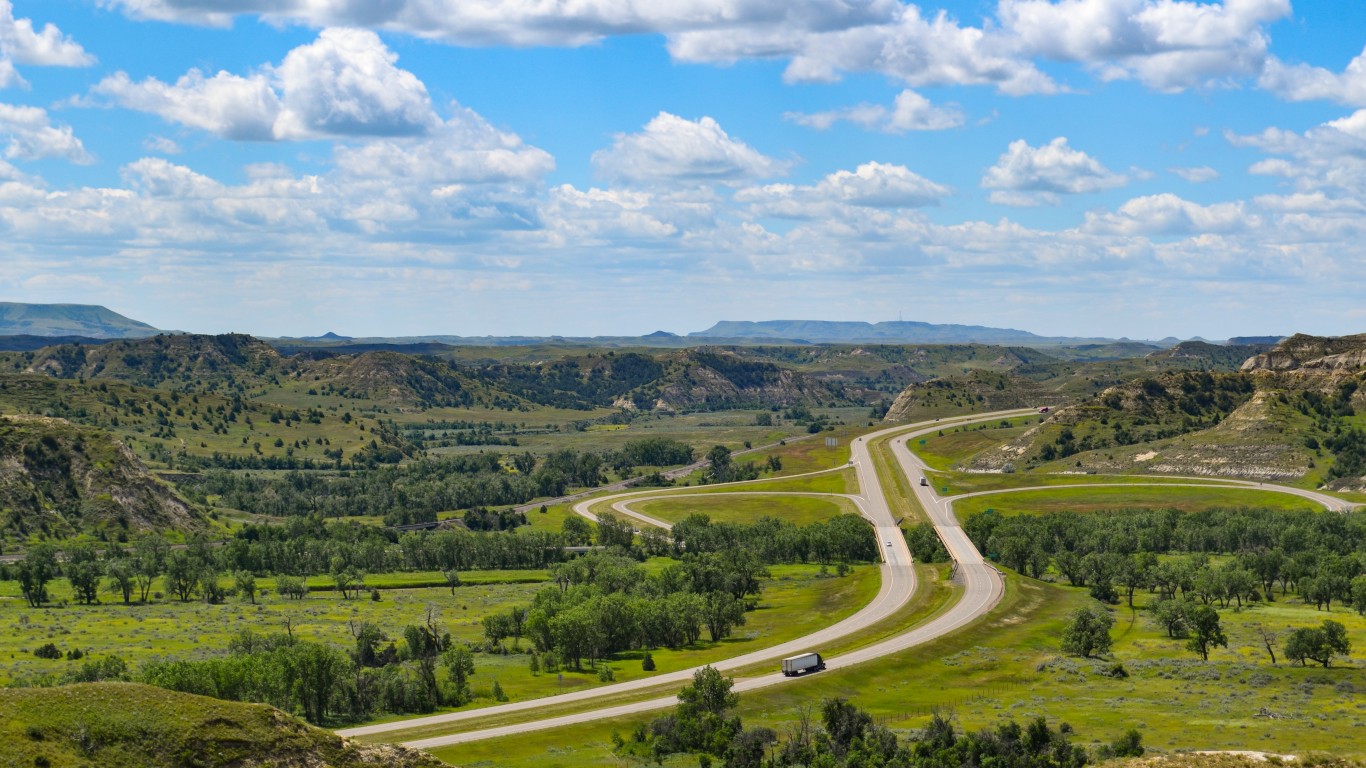
8. North Dakota
> Work zone fatality rate: 25.97 deaths per million licensed drivers
> Total work zone fatalities, 2016-2020: 14
> Vehicle occupant fatalities: 12
> Worker, pedestrian, and cyclist fatalities: 2
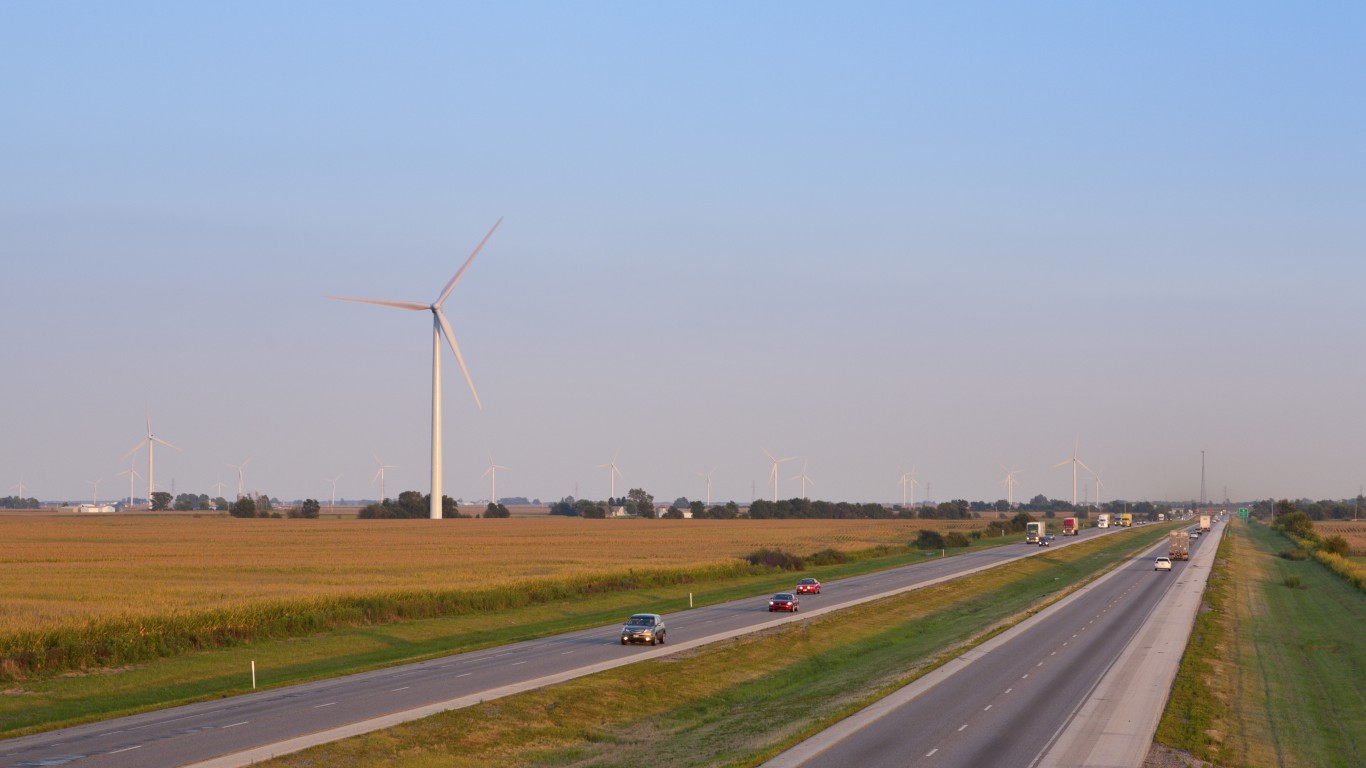
7. Indiana
> Work zone fatality rate: 27.80 deaths per million licensed drivers
> Total work zone fatalities, 2016-2020: 126
> Vehicle occupant fatalities: 107
> Worker, pedestrian, and cyclist fatalities: 19
[in-text-ad-2]
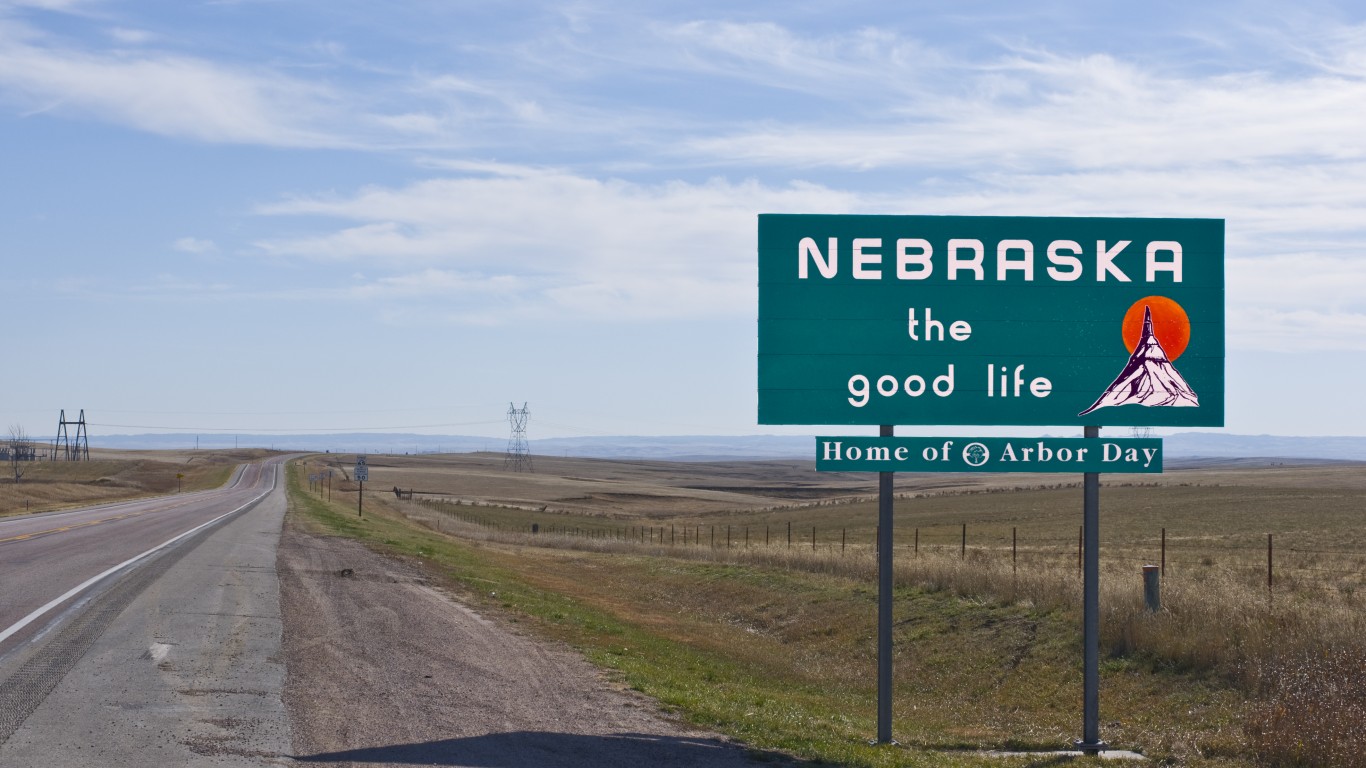
6. Nebraska
> Work zone fatality rate: 30.58 deaths per million licensed drivers
> Total work zone fatalities, 2016-2020: 44
> Vehicle occupant fatalities: 42
> Worker, pedestrian, and cyclist fatalities: 2
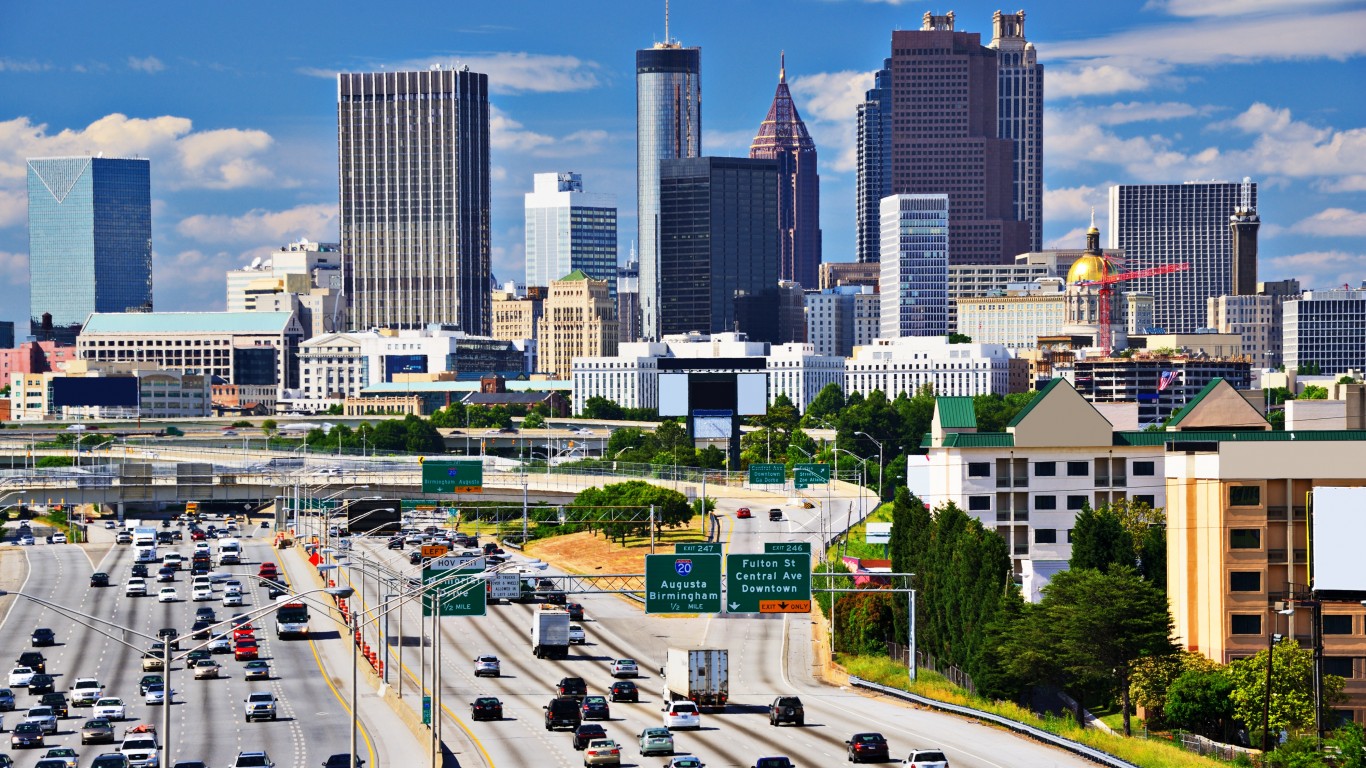
5. Georgia
> Work zone fatality rate: 32.31 deaths per million licensed drivers
> Total work zone fatalities, 2016-2020: 243
> Vehicle occupant fatalities: 188
> Worker, pedestrian, and cyclist fatalities: 55
[in-text-ad]
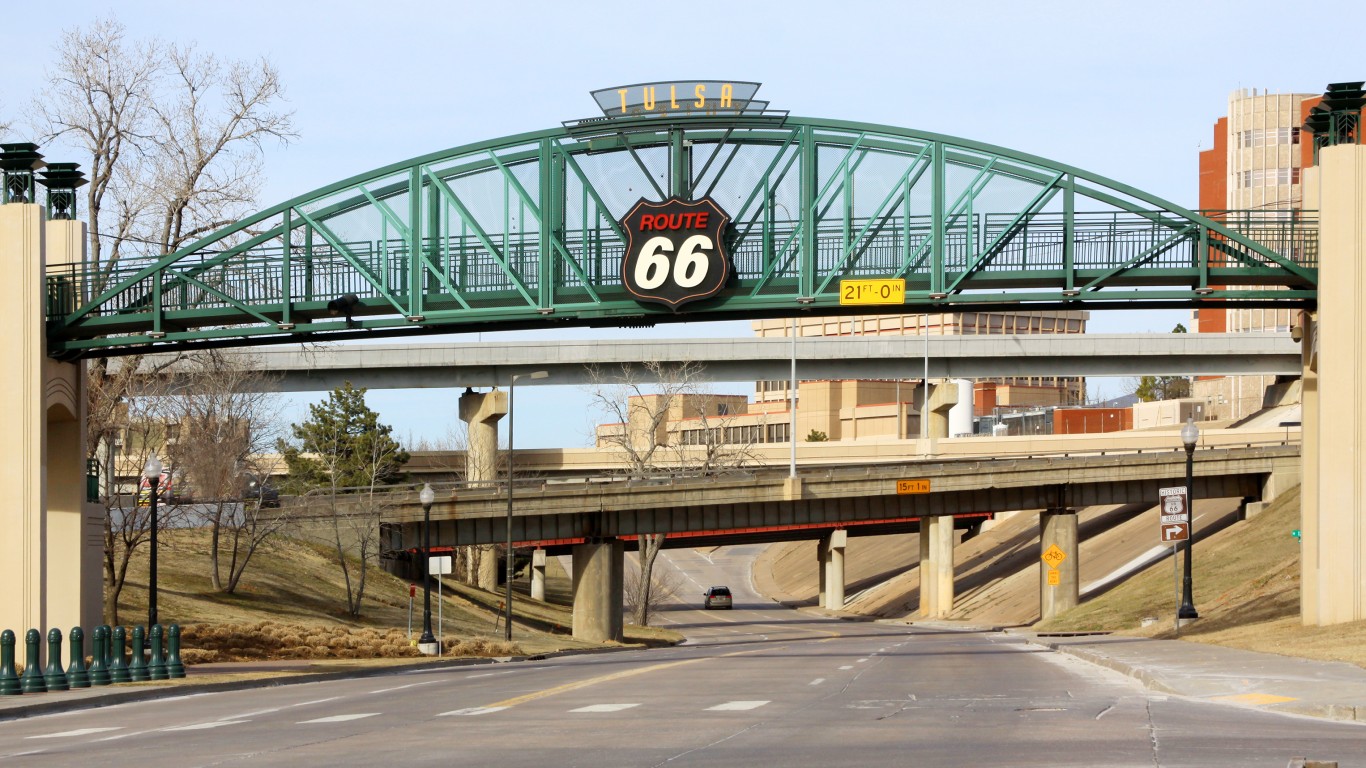
4. Oklahoma
> Work zone fatality rate: 32.54 deaths per million licensed drivers
> Total work zone fatalities, 2016-2020: 83
> Vehicle occupant fatalities: 76
> Worker, pedestrian, and cyclist fatalities: 7

3. Arkansas
> Work zone fatality rate: 37.14 deaths per million licensed drivers
> Total work zone fatalities, 2016-2020: 80
> Vehicle occupant fatalities: 68
> Worker, pedestrian, and cyclist fatalities: 12
2. Wyoming
> Work zone fatality rate: 44.47 deaths per million licensed drivers
> Total work zone fatalities, 2016-2020: 19
> Vehicle occupant fatalities: 0
> Worker, pedestrian, and cyclist fatalities: 0
[in-text-ad-2]
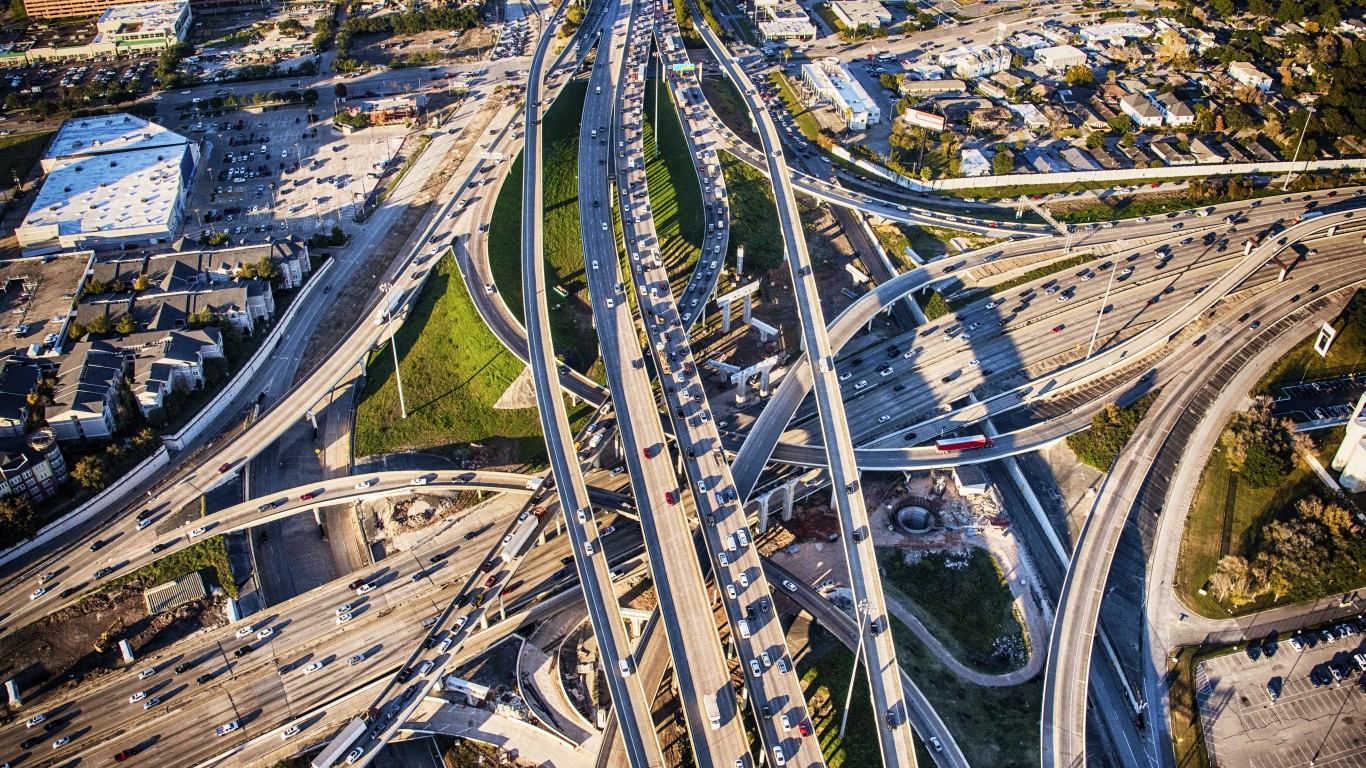
1. Texas
> Work zone fatality rate: 46.75 deaths per million licensed drivers
> Total work zone fatalities, 2016-2020: 826
> Vehicle occupant fatalities: 672
> Worker, pedestrian, and cyclist fatalities: 154
It’s Your Money, Your Future—Own It (sponsor)
Are you ahead, or behind on retirement? For families with more than $500,000 saved for retirement, finding a financial advisor who puts your interest first can be the difference, and today it’s easier than ever. SmartAsset’s free tool matches you with up to three fiduciary financial advisors who serve your area in minutes. Each advisor has been carefully vetted and must act in your best interests. Start your search now.
If you’ve saved and built a substantial nest egg for you and your family, don’t delay; get started right here and help your retirement dreams become a retirement reality.
Thank you for reading! Have some feedback for us?
Contact the 24/7 Wall St. editorial team.
 24/7 Wall St.
 24/7 Wall St.
 24/7 Wall St.
 24/7 Wall St.