Special Report
Nations Buying the Most Weapons and Their Biggest Suppliers

Published:
Last Updated:

The U.S. defense budget and global military expenditures have been increasing in recent years, reaching a record of over $2 trillion worldwide, according to the Stockholm International Peace Research Institute. Still, based on actual deliveries of major arms, the volume of international arms deals between 2017 to 2021 declined 4.6% from 2012 to 2016.
To determine the nations buying the most weapons and their biggest suppliers that buy the most weapons, 24/7 Wall St. reviewed SIPRI’s “Trends in International Arms Transfers 2021” report. Countries are ranked by the share of their imported arms out of global import volume from 2017 to 2021. All data is from the report. Because volume can fluctuate greatly from year to year, SIPRI tracks arms transfers in five-year periods.
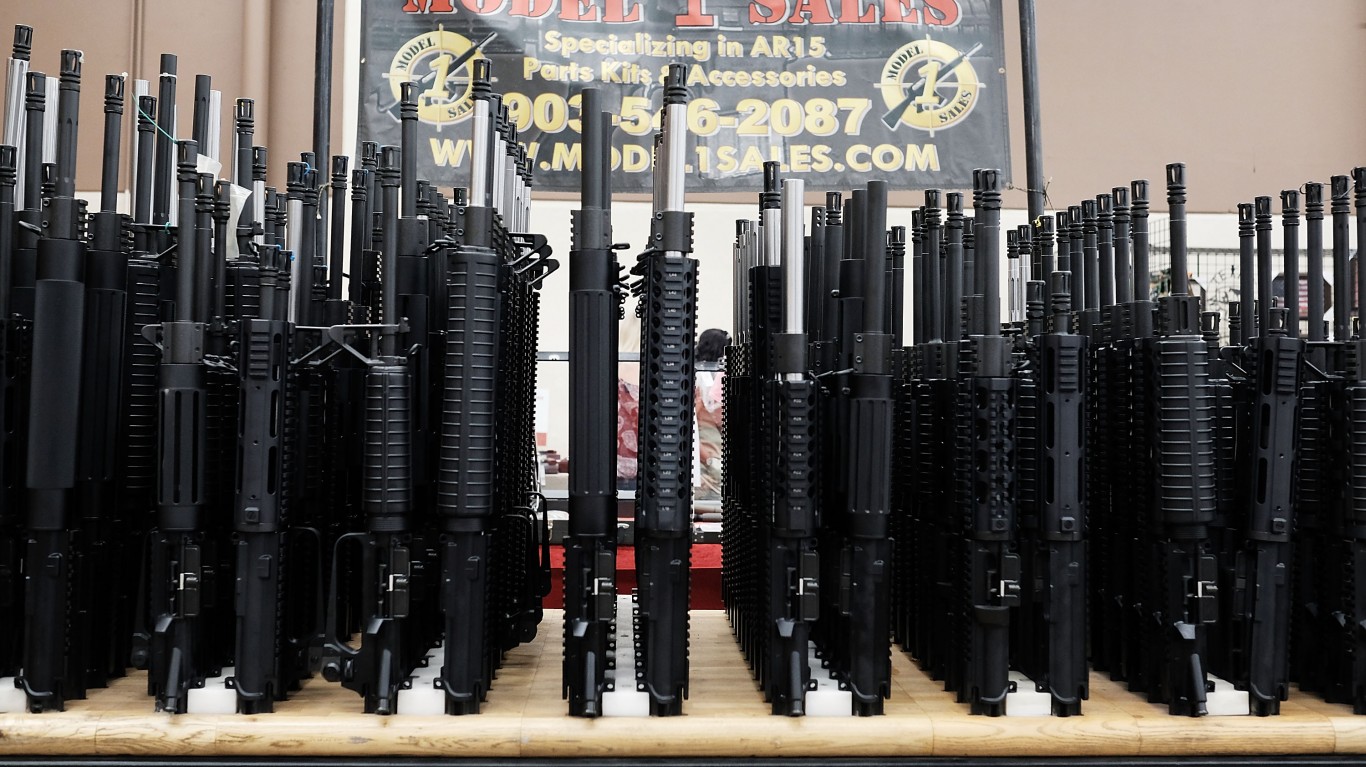
The U.S., Russia, France, China, and Germany ranked as the top five arms exporters from 2017 to 2021. China, however, was also one of the five largest importers during that time. Other top importers include India, Saudi Arabia, Egypt, and Australia. Those five received 38% of all imports of major arms volume. (See the bombs and missles used by the U.S. military. )
Regionally, Europe recorded a 19% hike in arms deals, followed by the Middle East at 2.8%. Transfers decreased to the Americas (-36%), Africa (-34%), and Asia and Oceania (-4.7%). (These are the regions of the world where military power is most concentrated.)
Saudi Arabia and India both received 11% of the global share of arms imports volume. France, which is a major arms exporter, along with Belarus, NATO, and Azerbaijan registered the lowest percent of weapon imports at 0.5%
In dollar terms, worldwide military spending is led by the U.S., China, India, and the U.K. In Europe, military spending has grown steadily since Russia’s 2014 annexation of Crimea, hitting $418 billion last year, according to SIPRI.
Click here to see the nations buying the most weapons and their biggest suppliers.

40. France
> Share of global imports: 0.5%
> Primary suppliers: USA (42%), UK (16%), Brazil (15%)
> Annual military expenditure: $56.6 billion
[in-text-ad]

39. Belarus
> Share of global imports: 0.5%
> Primary suppliers: Russia (100%), China (0.1%), â (-%)
> Annual military expenditure: $0.8 billion

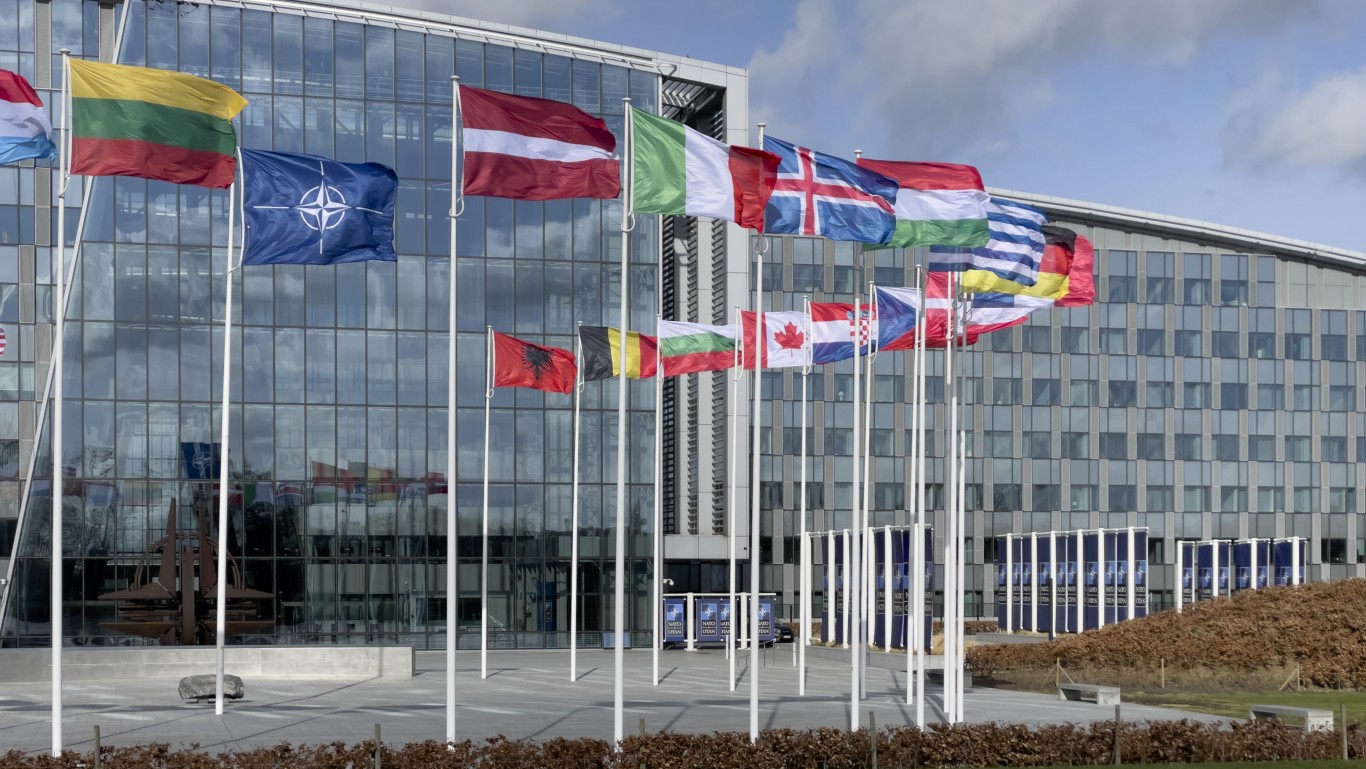
38. NATO
> Share of global imports: 0.5%
> Primary suppliers: France (69%), USA (26%), Spain (3.7%)
> Annual military expenditure: $- billion

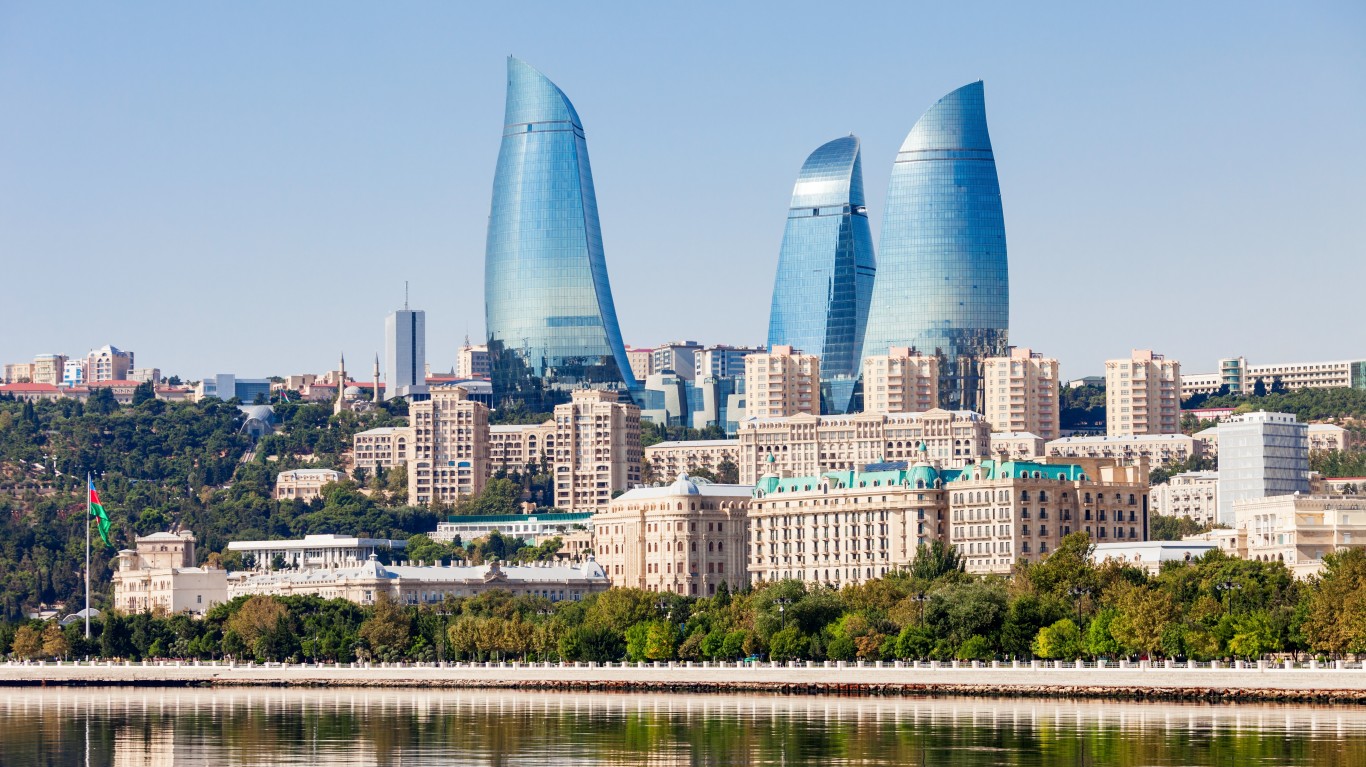
37. Azerbaijan
> Share of global imports: 0.5%
> Primary suppliers: Israel (61%), Russia (22%), Belarus (6.6%)
> Annual military expenditure: $2.7 billion
[in-text-ad-2]

36. Poland
> Share of global imports: 0.6%
> Primary suppliers: USA (35%), Italy (12%), South Korea (12%)
> Annual military expenditure: $13.7 billion

35. Myanmar
> Share of global imports: 0.6%
> Primary suppliers: China (36%), Russia (27%), India (17%)
> Annual military expenditure: $2.1 billion
[in-text-ad]

34. Taiwan
> Share of global imports: 0.7%
> Primary suppliers: USA (99%), Germany (0.4%), Italy (0.3%)
> Annual military expenditure: $13.0 billion

33. Brazil
> Share of global imports: 0.7%
> Primary suppliers: UK (19%), Sweden (18%), France (17%)
> Annual military expenditure: $19.2 billion

32. Jordan
> Share of global imports: 0.7%
> Primary suppliers: USA (37%), Netherlands (17%), UAE (14%)
> Annual military expenditure: $2.2 billion
[in-text-ad-2]

31. Kazakhstan
> Share of global imports: 0.8%
> Primary suppliers: Russia (91%), Spain (2.2%), China (2.1%)
> Annual military expenditure: $1.6 billion

30. Canada
> Share of global imports: 0.9%
> Primary suppliers: USA (43%), Australia (23%), Israel (12%)
> Annual military expenditure: $26.4 billion
[in-text-ad]

29. Philippines
> Share of global imports: 0.9%
> Primary suppliers: South Korea (53%), USA (16%), Israel (8.7%)
> Annual military expenditure: $4.1 billion

28. Kuwait
> Share of global imports: 0.9%
> Primary suppliers: USA (56%), France (26%), Italy (9.4%)
> Annual military expenditure: $9.0 billion

27. Oman
> Share of global imports: 0.9%
> Primary suppliers: UK (63%), Turkey (16%), Norway (8.1%)
> Annual military expenditure: $5.8 billion
[in-text-ad-2]

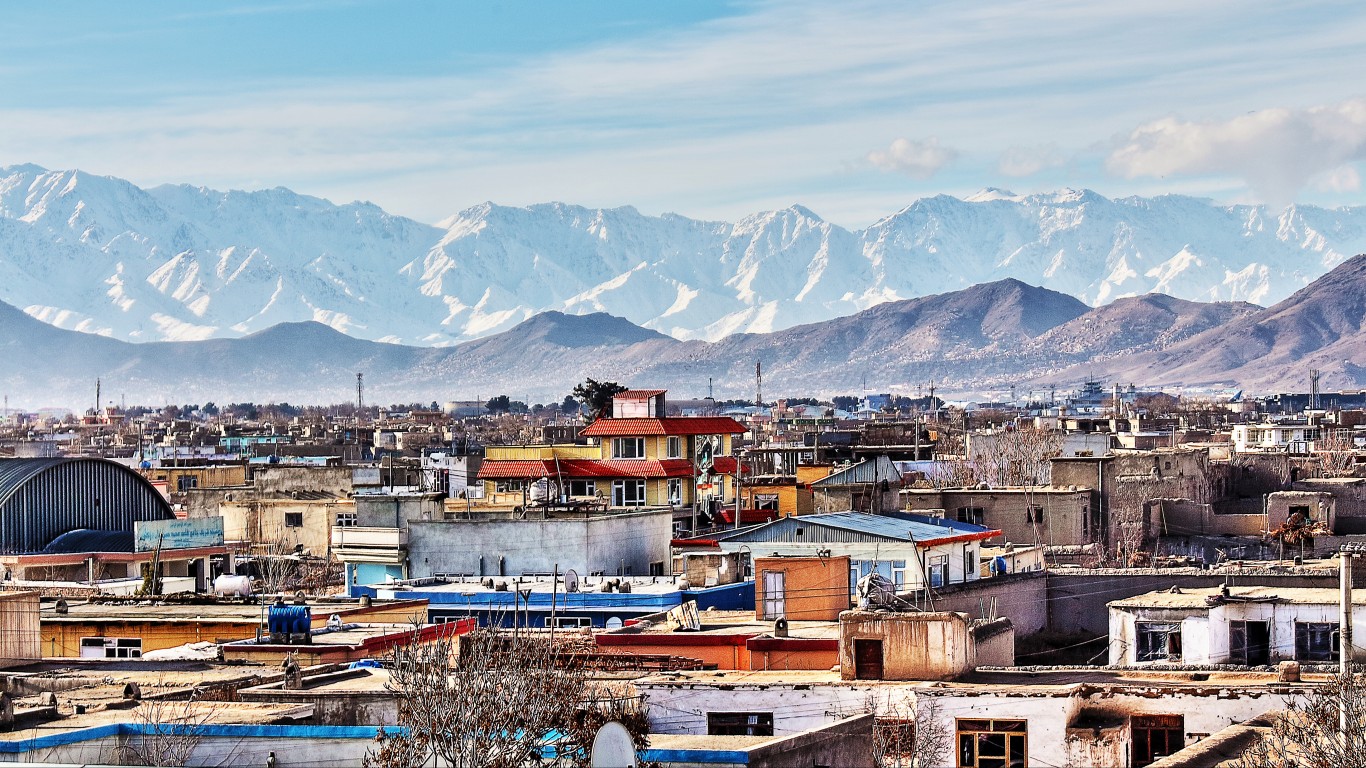
26. Afghanistan
> Share of global imports: 0.9%
> Primary suppliers: USA (97%), Brazil (2%), Belarus (1.1%)
> Annual military expenditure: $0.3 billion

25. Morocco
> Share of global imports: 1.0%
> Primary suppliers: USA (76%), China (14%), France (8.4%)
> Annual military expenditure: $5.4 billion
[in-text-ad]

24. Bangladesh
> Share of global imports: 1.0%
> Primary suppliers: China (71%), Russia (9.2%), UK (5.2%)
> Annual military expenditure: $4.9 billion

23. Thailand
> Share of global imports: 1.1%
> Primary suppliers: South Korea (28%), China (20%), Ukraine (9.9%)
> Annual military expenditure: $6.6 billion

22. Italy
> Share of global imports: 1.2%
> Primary suppliers: USA (72%), Germany (17%), Israel (5.8%)
> Annual military expenditure: $32.0 billion
[in-text-ad-2]

21. Iraq
> Share of global imports: 1.2%
> Primary suppliers: Russia (44%), USA (35%), Italy (10%)
> Annual military expenditure: $4.7 billion

20. Viet Nam
> Share of global imports: 1.3%
> Primary suppliers: Russia (56%), Israel (19%), South Korea (6.6%)
> Annual military expenditure: $- billion
[in-text-ad]

19. Netherlands
> Share of global imports: 1.3%
> Primary suppliers: USA (94%), Germany (5%), Australia (0.3%)
> Annual military expenditure: $13.8 billion

18. Singapore
> Share of global imports: 1.4%
> Primary suppliers: France (54%), USA (22%), Germany (7.9%)
> Annual military expenditure: $11.1 billion

17. Turkey
> Share of global imports: 1.5%
> Primary suppliers: Italy (30%), USA (22%), Spain (21%)
> Annual military expenditure: $15.5 billion
[in-text-ad-2]

16. Norway
> Share of global imports: 1.6%
> Primary suppliers: USA (83%), South Korea (10%), Italy (3.5%)
> Annual military expenditure: $8.3 billion

15. Indonesia
> Share of global imports: 1.7%
> Primary suppliers: South Korea (23%), USA (23%), Netherlands (19%)
> Annual military expenditure: $8.3 billion
[in-text-ad]

14. Israel
> Share of global imports: 1.9%
> Primary suppliers: USA (92%), Germany (6.9%), Italy (1%)
> Annual military expenditure: $24.3 billion
13. United States
> Share of global imports: 2.4%
> Primary suppliers: UK (23%), Netherlands (13%), France (12%)
> Annual military expenditure: $800.7 billion

12. United Kingdom
> Share of global imports: 2.5%
> Primary suppliers: USA (77%), South Korea (16%), Germany (3.2%)
> Annual military expenditure: $68.4 billion
[in-text-ad-2]

11. Algeria
> Share of global imports: 2.6%
> Primary suppliers: Russia (81%), Germany (6.4%), France (3.7%)
> Annual military expenditure: $9.1 billion

10. Japan
> Share of global imports: 2.6%
> Primary suppliers: USA (98%), UK (1.7%), Sweden (0.7%)
> Annual military expenditure: $54.1 billion
[in-text-ad]

9. UAE
> Share of global imports: 2.8%
> Primary suppliers: USA (61%), France (6.2%), Russia (5.3%)
> Annual military expenditure: $- billion

8. Pakistan
> Share of global imports: 3.0%
> Primary suppliers: China (72%), Sweden (6.4%), Russia (5.6%)
> Annual military expenditure: $11.3 billion

7. South Korea
> Share of global imports: 4.1%
> Primary suppliers: USA (63%), Germany (27%), France (7.8%)
> Annual military expenditure: $50.2 billion
[in-text-ad-2]

6. Qatar
> Share of global imports: 4.6%
> Primary suppliers: USA (46%), France (36%), Italy (6.1%)
> Annual military expenditure: $11.6 billion

5. China
> Share of global imports: 4.8%
> Primary suppliers: Russia (81%), France (9.1%), Ukraine (5.9%)
> Annual military expenditure: $293.4 billion
[in-text-ad]

4. Australia
> Share of global imports: 5.4%
> Primary suppliers: USA (67%), Spain (24%), Switzerland (3.3%)
> Annual military expenditure: $31.8 billion

3. Egypt
> Share of global imports: 5.7%
> Primary suppliers: Russia (41%), France (21%), Italy (15%)
> Annual military expenditure: $5.2 billion

2. Saudi Arabia
> Share of global imports: 11.0%
> Primary suppliers: USA (82%), France (5.1%), UK (5%)
> Annual military expenditure: $55.6 billion
[in-text-ad-2]

1. India
> Share of global imports: 11.0%
> Primary suppliers: Russia (46%), France (27%), USA (12%)
> Annual military expenditure: $76.6 billion
Thank you for reading! Have some feedback for us?
Contact the 24/7 Wall St. editorial team.