Special Report
States Where The Most People Have Died in Car Accidents This Year
Published:
Last Updated:

Traffic deaths are on the rise in the United States, according to a recent report from the National Highway Traffic Safety Administration. An estimated 20,175 people were killed in motor vehicle crashes from January through June 2022, up 0.5% from the same period in 2021 and the most in the first half of any year since 2006. (Here is a look at the deadliest year for car wrecks since seat belts became law.)
The latest increase in traffic fatalities comes as Americans are spending more time on the road. In the first six months of the year, vehicle miles traveled, or VMT, topped the figure from the first half of last year by 43.2 billion. While the increase in traffic fatalities is partially attributable to increased roadway travel, it also represents the continuation of a troubling long-term trend.
Deaths on American roads rose significantly for 10 consecutive quarters, from the end of 2014 to the beginning of 2017 – and again for seven consecutive quarters, from mid 2020 to early 2022. A recent survey conducted by the AAA Foundation for Traffic Safety found that, in recent years, the trend is partially the result of rising instances of risky behavior among motorists – including speeding, distracted driving, and driving under the influence of alcohol. (Here is a look at when you’re most likely to die in a drunk driving accident in every state.)
So far this year, some states stand out for having especially high traffic fatality rates. Using preliminary fatality estimates from the NHTSA, 24/7 Wall St. identified the states where the most people have died in car crashes so far this year. States are ranked by the number of traffic fatalities for every 100 million vehicle miles traveled.
In each of the 19 states on this list, the traffic fatality rate exceeds the national rate of 1.27 deaths for every 100 million VMT. These states are disproportionately located in the South, though a handful are also in the West.
Despite having higher than average traffic fatality rates, a little over half of these states actually reported a year-over-year decline in the total number of estimated roadway fatalities. In three states on this list, however, estimated traffic deaths are up over 10% from last year.
Click here to see states where the most people have died in car accidents this year.

19. California
> Traffic fatality rate, first half of 2022: 1.29 deaths per 100M miles traveled
> Total traffic fatalities, first half of 2022: 2,149 (2nd most of 50 states)
> Est. year-over-year change in total deaths: +1.7% (25th largest increase of 50 states)
[in-text-ad]
18. Colorado
> Traffic fatality rate, first half of 2022: 1.32 deaths per 100M miles traveled
> Total traffic fatalities, first half of 2022: 339 (22nd most of 50 states)
> Est. year-over-year change in total deaths: +10.3% (15th largest increase of 50 states)
17. Kentucky
> Traffic fatality rate, first half of 2022: 1.34 deaths per 100M miles traveled
> Total traffic fatalities, first half of 2022: 335 (23rd most of 50 states)
> Est. year-over-year change in total deaths: -11.5% (9th largest decrease of 50 states)

16. Alabama
> Traffic fatality rate, first half of 2022: 1.36 deaths per 100M miles traveled
> Total traffic fatalities, first half of 2022: 486 (13th most of 50 states)
> Est. year-over-year change in total deaths: -1.4% (19th largest decrease of 50 states)
[in-text-ad-2]

15. Nevada
> Traffic fatality rate, first half of 2022: 1.39 deaths per 100M miles traveled
> Total traffic fatalities, first half of 2022: 194 (18th fewest of 50 states)
> Est. year-over-year change in total deaths: +4.0% (22nd largest increase of 50 states)

14. Georgia
> Traffic fatality rate, first half of 2022: 1.40 deaths per 100M miles traveled
> Total traffic fatalities, first half of 2022: 901 (4th most of 50 states)
> Est. year-over-year change in total deaths: +0.9% (28th largest increase of 50 states)
[in-text-ad]
13. Kansas
> Traffic fatality rate, first half of 2022: 1.41 deaths per 100M miles traveled
> Total traffic fatalities, first half of 2022: 205 (21st fewest of 50 states)
> Est. year-over-year change in total deaths: +14.3% (13th largest increase of 50 states)

12. West Virginia
> Traffic fatality rate, first half of 2022: 1.43 deaths per 100M miles traveled
> Total traffic fatalities, first half of 2022: 121 (13th fewest of 50 states)
> Est. year-over-year change in total deaths: -4.2% (17th largest decrease of 50 states)

11. North Carolina
> Traffic fatality rate, first half of 2022: 1.44 deaths per 100M miles traveled
> Total traffic fatalities, first half of 2022: 806 (5th most of 50 states)
> Est. year-over-year change in total deaths: +1.4% (27th largest increase of 50 states)
[in-text-ad-2]
10. Oregon
> Traffic fatality rate, first half of 2022: 1.45 deaths per 100M miles traveled
> Total traffic fatalities, first half of 2022: 250 (23rd fewest of 50 states)
> Est. year-over-year change in total deaths: -5.1% (15th largest decrease of 50 states)

9. Texas
> Traffic fatality rate, first half of 2022: 1.50 deaths per 100M miles traveled
> Total traffic fatalities, first half of 2022: 2,183 (the most of 50 states)
> Est. year-over-year change in total deaths: +4.0% (23rd largest increase of 50 states)
[in-text-ad]
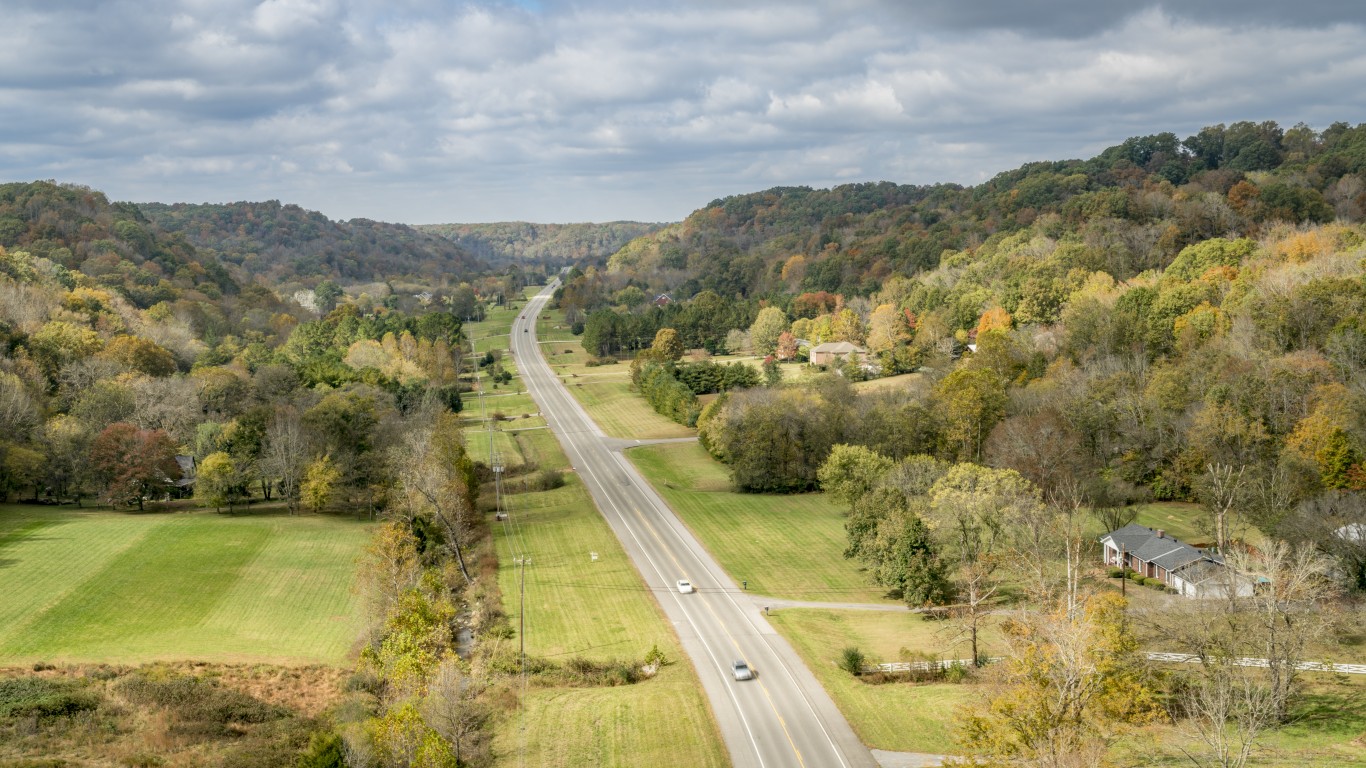
8. Tennessee
> Traffic fatality rate, first half of 2022: 1.56 deaths per 100M miles traveled
> Total traffic fatalities, first half of 2022: 636 (6th most of 50 states)
> Est. year-over-year change in total deaths: -6.1% (14th largest decrease of 50 states)

7. Delaware
> Traffic fatality rate, first half of 2022: 1.58 deaths per 100M miles traveled
> Total traffic fatalities, first half of 2022: 76 (10th fewest of 50 states)
> Est. year-over-year change in total deaths: +40.7% (3rd largest increase of 50 states)
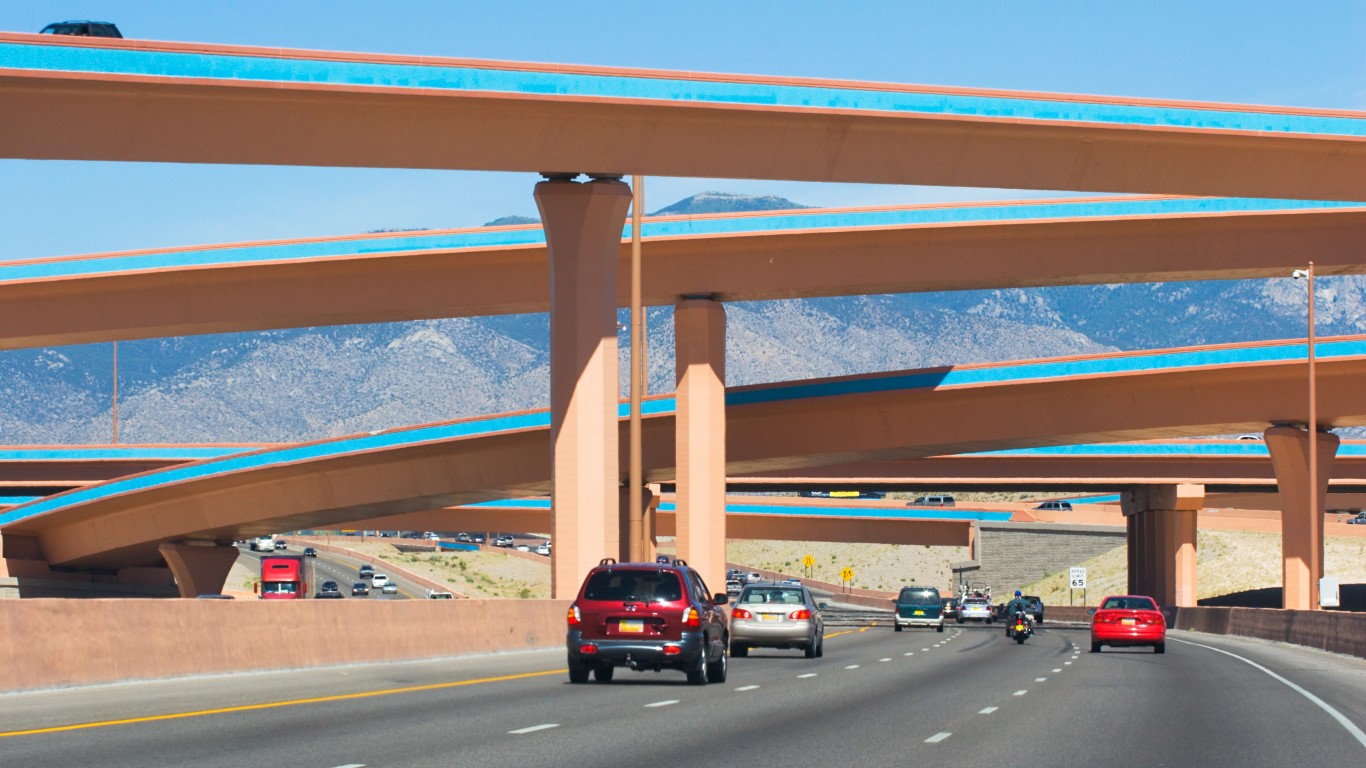
6. New Mexico
> Traffic fatality rate, first half of 2022: 1.58 deaths per 100M miles traveled
> Total traffic fatalities, first half of 2022: 210 (22nd fewest of 50 states)
> Est. year-over-year change in total deaths: -2.0% (18th largest decrease of 50 states)
[in-text-ad-2]
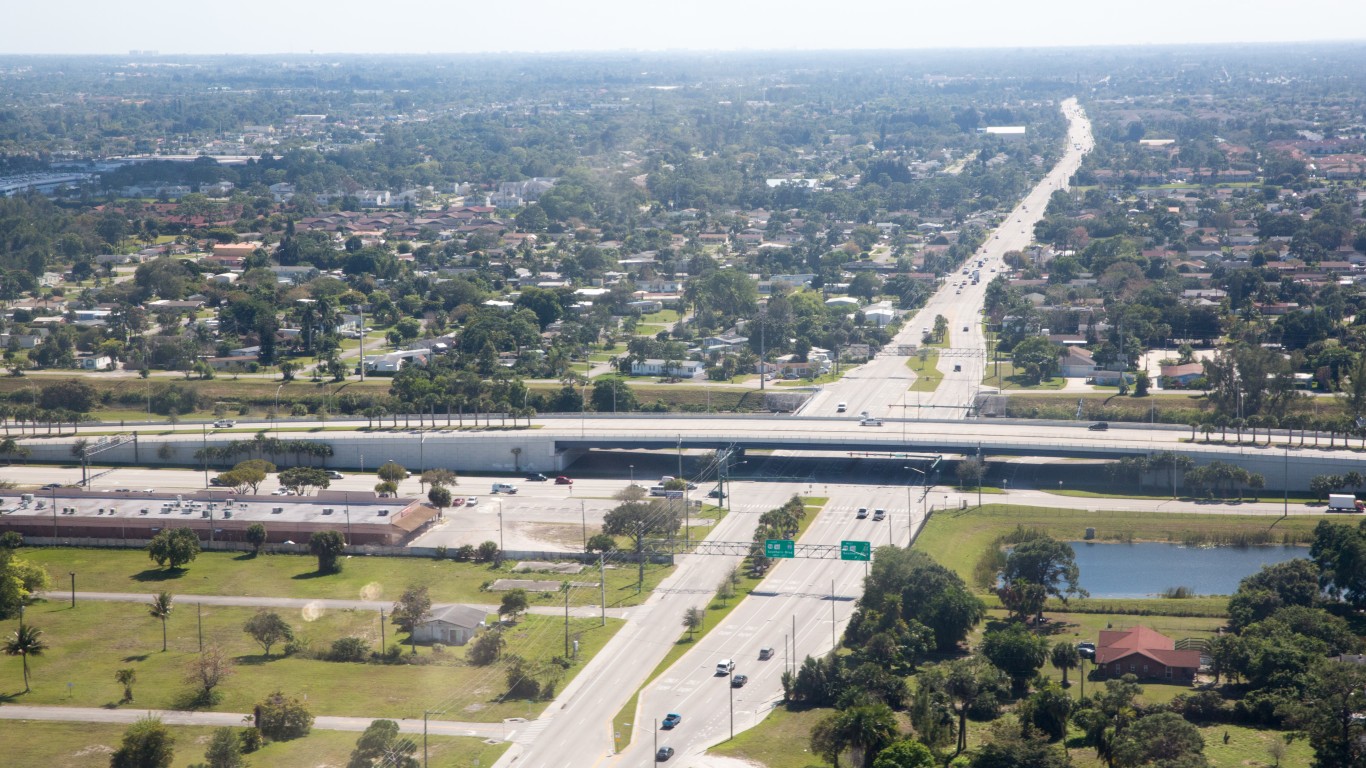
5. Florida
> Traffic fatality rate, first half of 2022: 1.58 deaths per 100M miles traveled
> Total traffic fatalities, first half of 2022: 1,951 (3rd most of 50 states)
> Est. year-over-year change in total deaths: +2.0% (24th largest increase of 50 states)
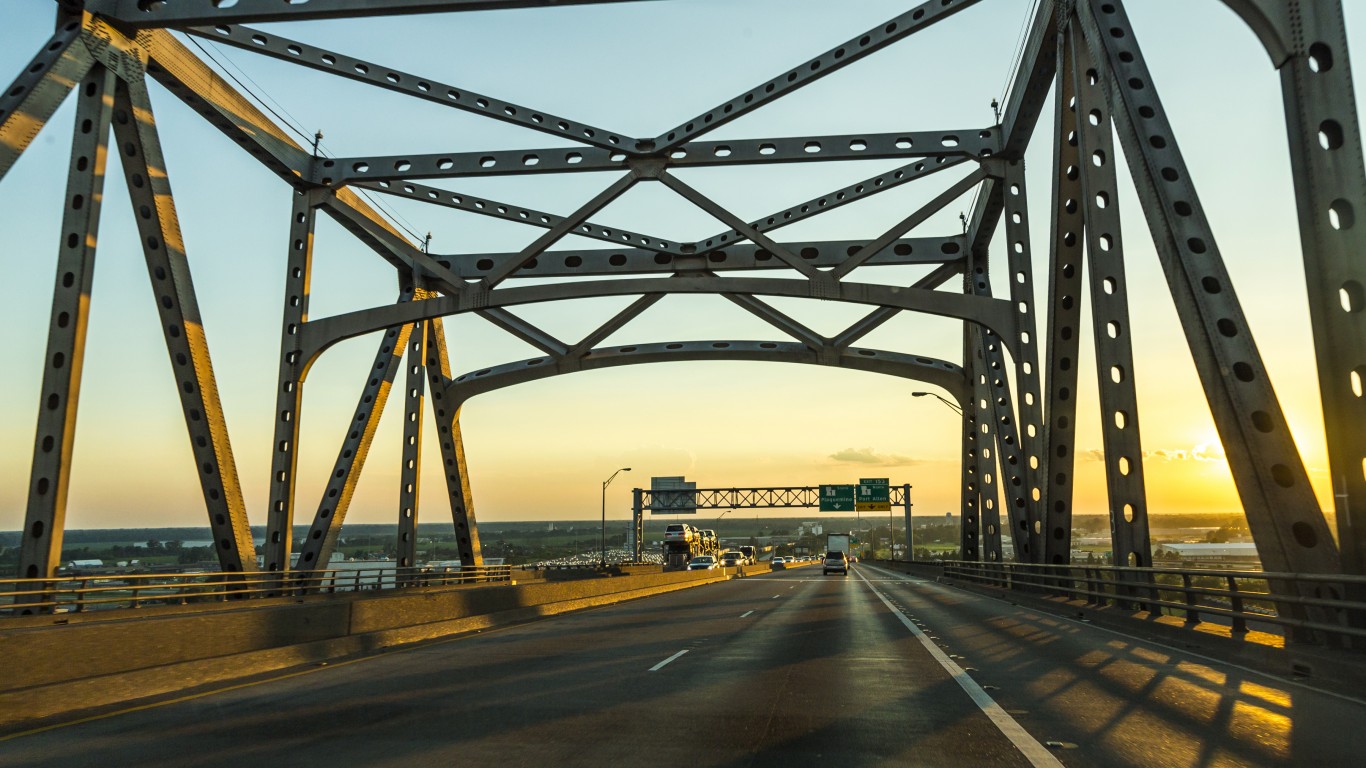
4. Louisiana
> Traffic fatality rate, first half of 2022: 1.59 deaths per 100M miles traveled
> Total traffic fatalities, first half of 2022: 432 (18th most of 50 states)
> Est. year-over-year change in total deaths: -6.3% (13th largest decrease of 50 states)
[in-text-ad]

3. Arkansas
> Traffic fatality rate, first half of 2022: 1.63 deaths per 100M miles traveled
> Total traffic fatalities, first half of 2022: 286 (24th most of 50 states)
> Est. year-over-year change in total deaths: -13.7% (8th largest decrease of 50 states)
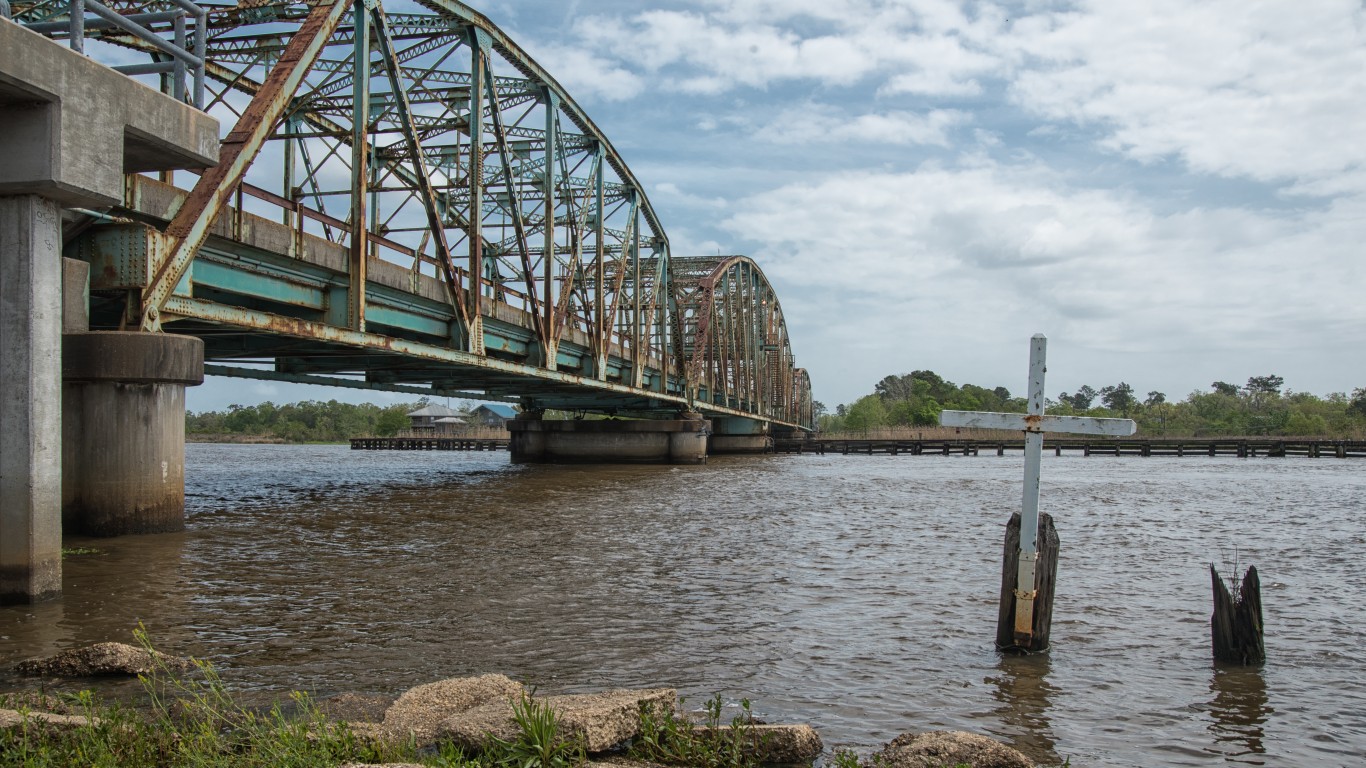
2. Mississippi
> Traffic fatality rate, first half of 2022: 1.64 deaths per 100M miles traveled
> Total traffic fatalities, first half of 2022: 341 (21st most of 50 states)
> Est. year-over-year change in total deaths: -10.3% (11th largest decrease of 50 states)

1. South Carolina
> Traffic fatality rate, first half of 2022: 1.71 deaths per 100M miles traveled
> Total traffic fatalities, first half of 2022: 517 (10th most of 50 states)
> Est. year-over-year change in total deaths: -9.2% (12th largest decrease of 50 states)
Thank you for reading! Have some feedback for us?
Contact the 24/7 Wall St. editorial team.