President Richard Nixon declared a “war on drugs” in June 1971, ramping up law enforcement efforts and enacting harsher penalties for drug offenses. These policies were ostensibly designed to curb rising rates of recreational drug use. But now, half a century later, the measures have proven to be an abject failure.
According to the Centers for Disease Control and Prevention, drug overdose deaths increased nearly every year in the United States over the last two decades, topping 100,000 for the first time in 2021. Meanwhile, American prison populations have swelled with nonviolent drug offenders. Over 45% of federal prison inmates today are incarcerated for drug offenses.
While the war on drugs remains ongoing, public support for it has faded. As of July 2022, 19 states and Washington, D.C. have legalized recreational marijuana use. Similarly, many state and local governments have reduced drug penalties in recent years, shifting their focus to treatment programs rather than incarceration. (Here is a look at the states where the most prisoners are exonerated.)
Still, in many parts of the country, drug offenses remain a target for law enforcement. Using 2020 data from the FBI, 24/7 Wall St. identified the 25 cities in Texas with the most drug offenses. Cities are ranked by the number of drug violation incidents reported by law enforcement for every 100,000 people. Only cities with populations of at least 25,000 were considered.
Drug crimes are classified by the FBI as crimes against society, a broad category that also includes animal cruelty, gambling offenses, prostitution, and weapons violations. In every city on this list, drug crimes accounted for over 75% of all crimes against society in 2020 – and in 10 of these places, they accounted for over 20% of the total number of reported crimes. (Here is a look at the county with the worst drug problem in every state.)
Among the places on this list, rates of drug violations range from 858 incidents per 100,000 people to over 1,400 per 100,000. Nine of these cities fall within the Dallas-Fort Worth metro area, including four that are located partially or entirely within Tarrant County.
Click here to see cities in Texas reporting the most drug offenses.
Click here to see our detailed methodology.

25. Tyler, TX
> Drug offenses in 2020: 858 per 100,000 people (928 total)
> Drug offenses as a share of all crimes against society: 87.7%
> Drug offenses as a share of all crime: 12.4%
> Location: Smith County
> Population: 108,139
[in-text-ad]

24. Cleburne, TX
> Drug offenses in 2020: 880 per 100,000 people (277 total)
> Drug offenses as a share of all crimes against society: 92.3%
> Drug offenses as a share of all crime: 16.7%
> Location: Johnson County
> Population: 31,486
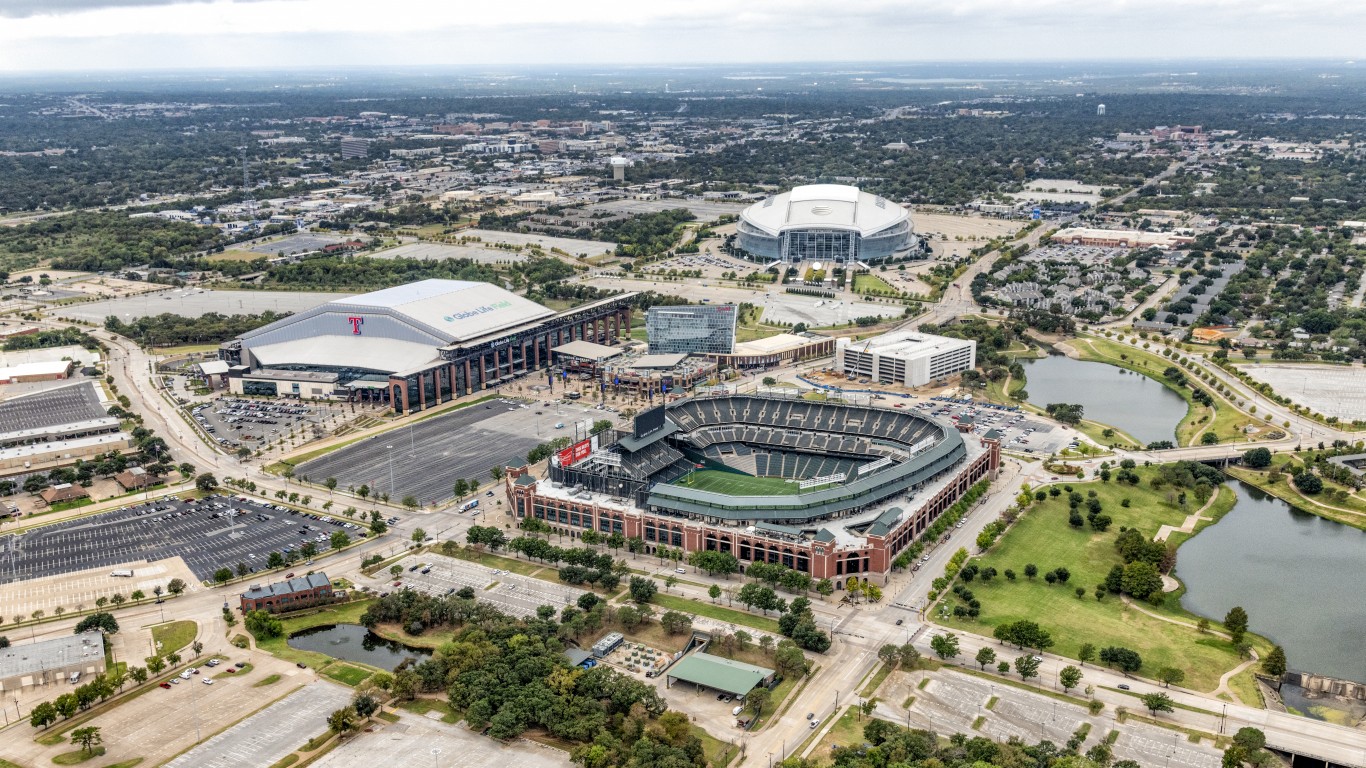
23. Arlington, TX
> Drug offenses in 2020: 887 per 100,000 people (3,571 total)
> Drug offenses as a share of all crimes against society: 84.9%
> Drug offenses as a share of all crime: 12.5%
> Location: Tarrant County
> Population: 402,700
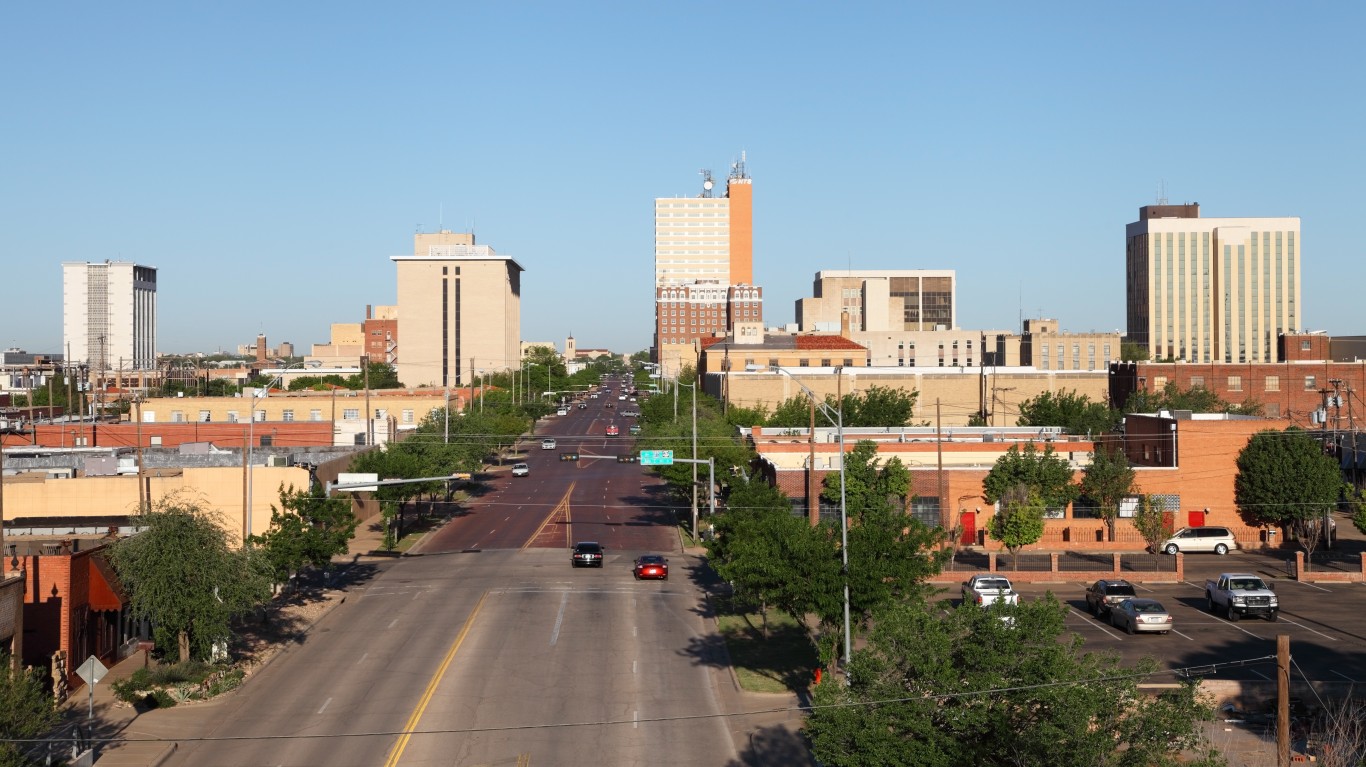
22. Lubbock, TX
> Drug offenses in 2020: 899 per 100,000 people (2,358 total)
> Drug offenses as a share of all crimes against society: 78.5%
> Drug offenses as a share of all crime: 8.1%
> Location: Lubbock County
> Population: 262,146
[in-text-ad-2]

21. Corpus Christi, TX
> Drug offenses in 2020: 921 per 100,000 people (3,032 total)
> Drug offenses as a share of all crimes against society: 83.0%
> Drug offenses as a share of all crime: 10.2%
> Location: Nueces, Aransas, Kleberg, and San Patricio Counties
> Population: 329,050

20. Plano, TX
> Drug offenses in 2020: 925 per 100,000 people (2,690 total)
> Drug offenses as a share of all crimes against society: 92.3%
> Drug offenses as a share of all crime: 22.6%
> Location: Collin and Denton Counties
> Population: 290,786
[in-text-ad]
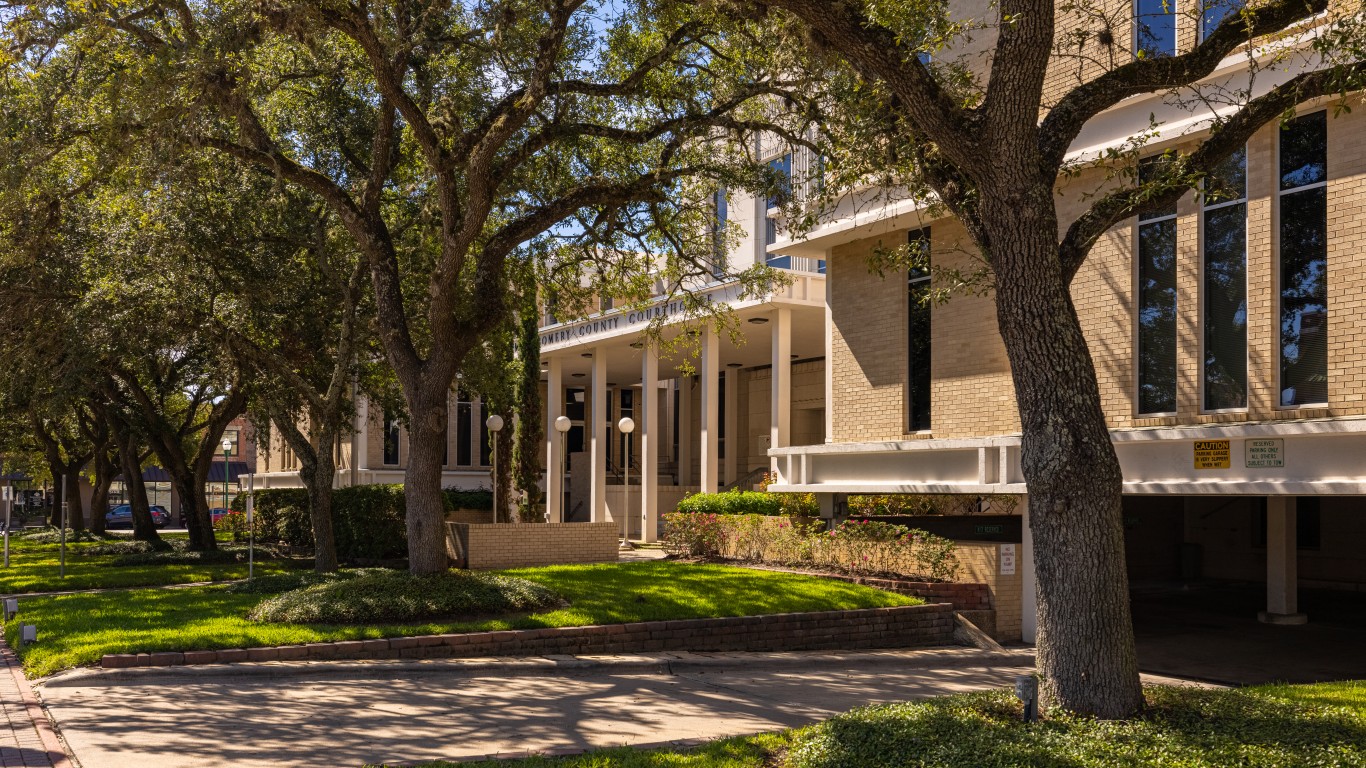
19. Conroe, TX
> Drug offenses in 2020: 936 per 100,000 people (884 total)
> Drug offenses as a share of all crimes against society: 90.9%
> Drug offenses as a share of all crime: 18.6%
> Location: Montgomery County
> Population: 94,451
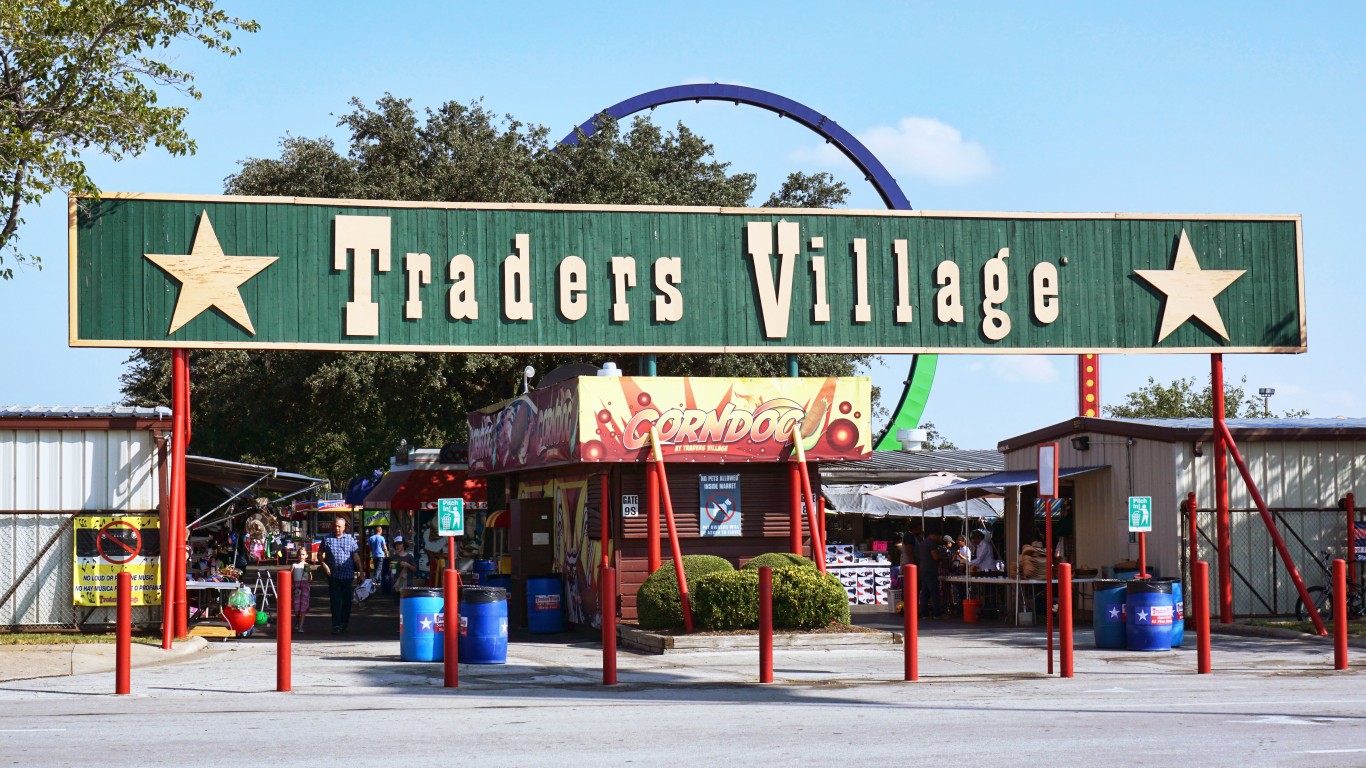
18. Grand Prairie, TX
> Drug offenses in 2020: 943 per 100,000 people (1,858 total)
> Drug offenses as a share of all crimes against society: 88.6%
> Drug offenses as a share of all crime: 20.2%
> Location: Dallas, Tarrant, and Ellis Counties
> Population: 196,990

17. La Porte, TX
> Drug offenses in 2020: 946 per 100,000 people (332 total)
> Drug offenses as a share of all crimes against society: 86.0%
> Drug offenses as a share of all crime: 21.9%
> Location: Harris County
> Population: 35,102
[in-text-ad-2]
16. Sherman, TX
> Drug offenses in 2020: 964 per 100,000 people (430 total)
> Drug offenses as a share of all crimes against society: 90.1%
> Drug offenses as a share of all crime: 15.1%
> Location: Grayson County
> Population: 44,611
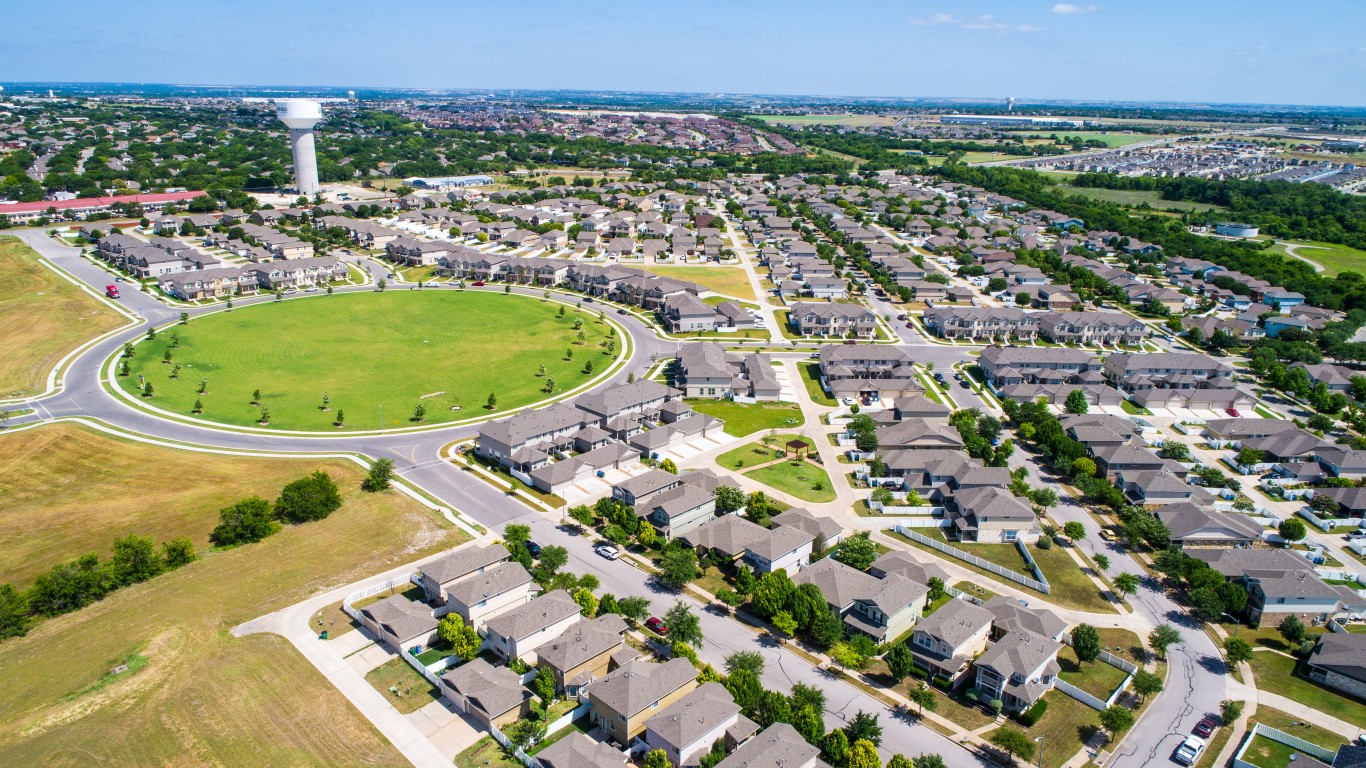
15. Pflugerville, TX
> Drug offenses in 2020: 1,007 per 100,000 people (680 total)
> Drug offenses as a share of all crimes against society: 92.1%
> Drug offenses as a share of all crime: 26.9%
> Location: Travis and Williamson Counties
> Population: 67,559
[in-text-ad]

14. Lewisville, TX
> Drug offenses in 2020: 1,039 per 100,000 people (1,151 total)
> Drug offenses as a share of all crimes against society: 85.3%
> Drug offenses as a share of all crime: 19.2%
> Location: Denton and Dallas Counties
> Population: 110,800

13. Irving, TX
> Drug offenses in 2020: 1,048 per 100,000 people (2,547 total)
> Drug offenses as a share of all crimes against society: 86.7%
> Drug offenses as a share of all crime: 15.4%
> Location: Dallas County
> Population: 242,976
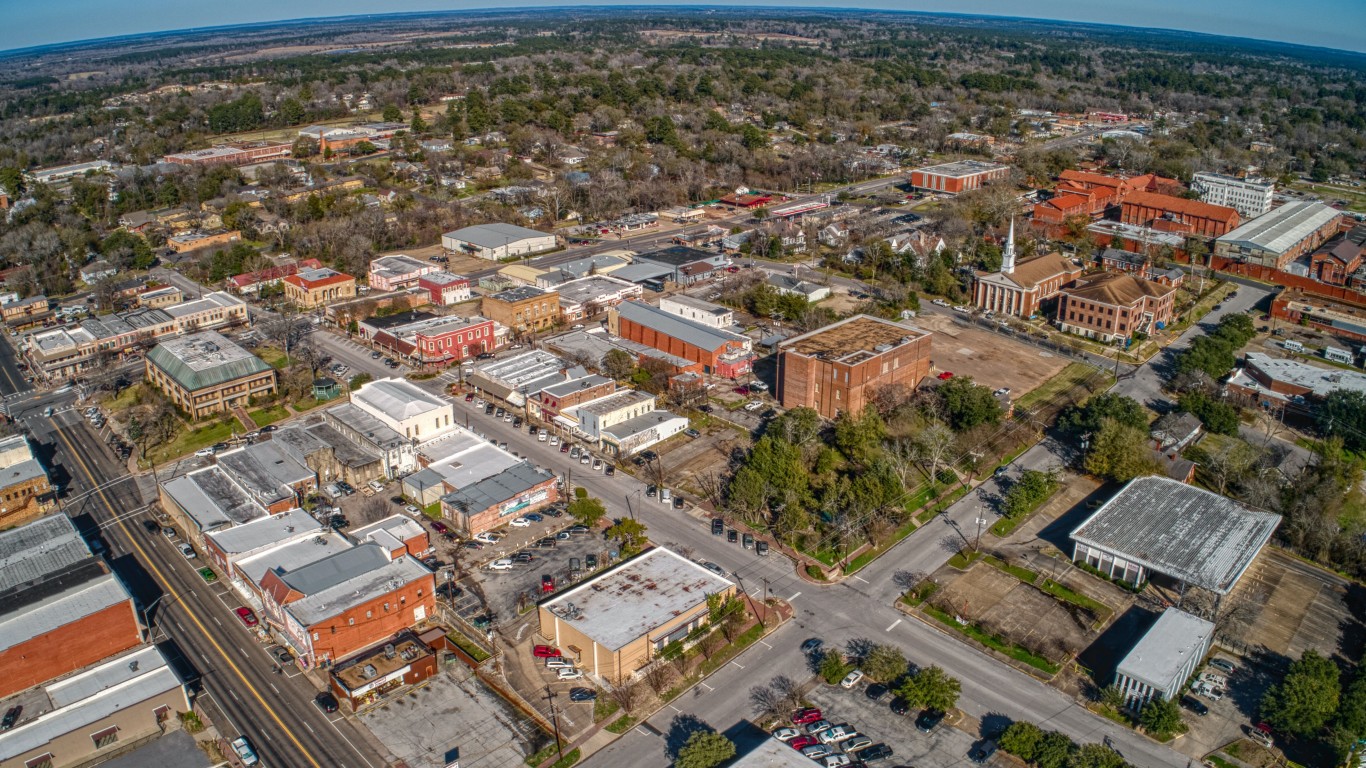
12. Huntsville, TX
> Drug offenses in 2020: 1,102 per 100,000 people (470 total)
> Drug offenses as a share of all crimes against society: 87.2%
> Drug offenses as a share of all crime: 21.3%
> Location: Walker County
> Population: 42,648
[in-text-ad-2]
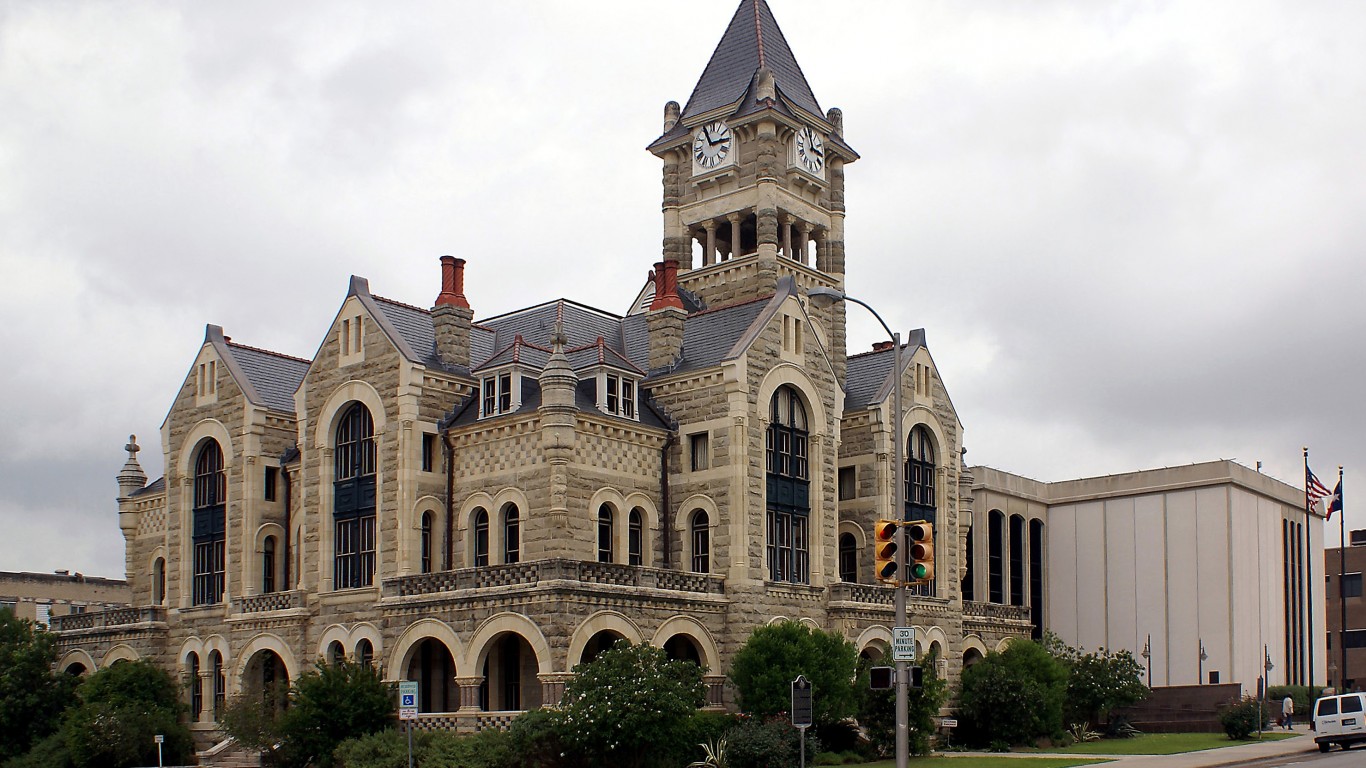
11. Victoria, TX
> Drug offenses in 2020: 1,130 per 100,000 people (762 total)
> Drug offenses as a share of all crimes against society: 86.4%
> Drug offenses as a share of all crime: 15.8%
> Location: Victoria County
> Population: 67,407
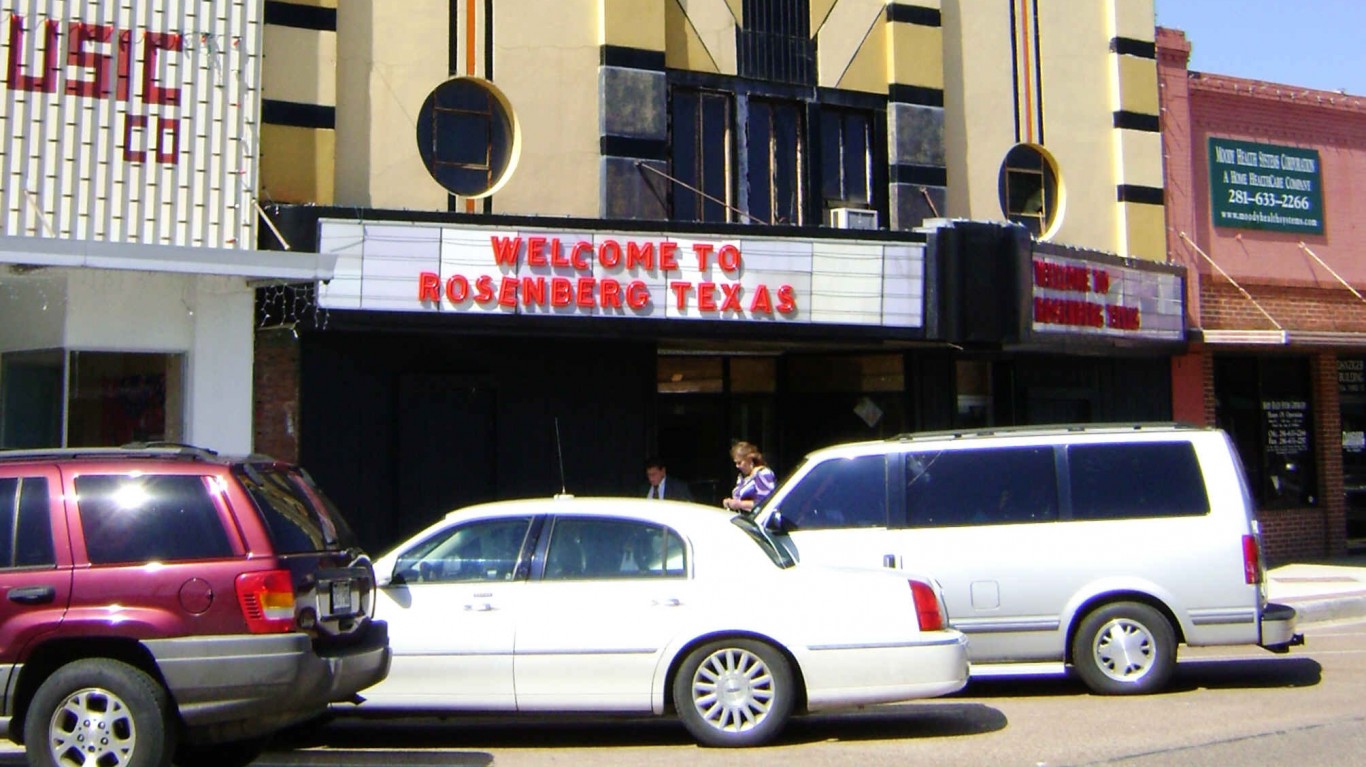
10. Rosenberg, TX
> Drug offenses in 2020: 1,195 per 100,000 people (468 total)
> Drug offenses as a share of all crimes against society: 89.0%
> Drug offenses as a share of all crime: 19.6%
> Location: Fort Bend County
> Population: 39,162
[in-text-ad]
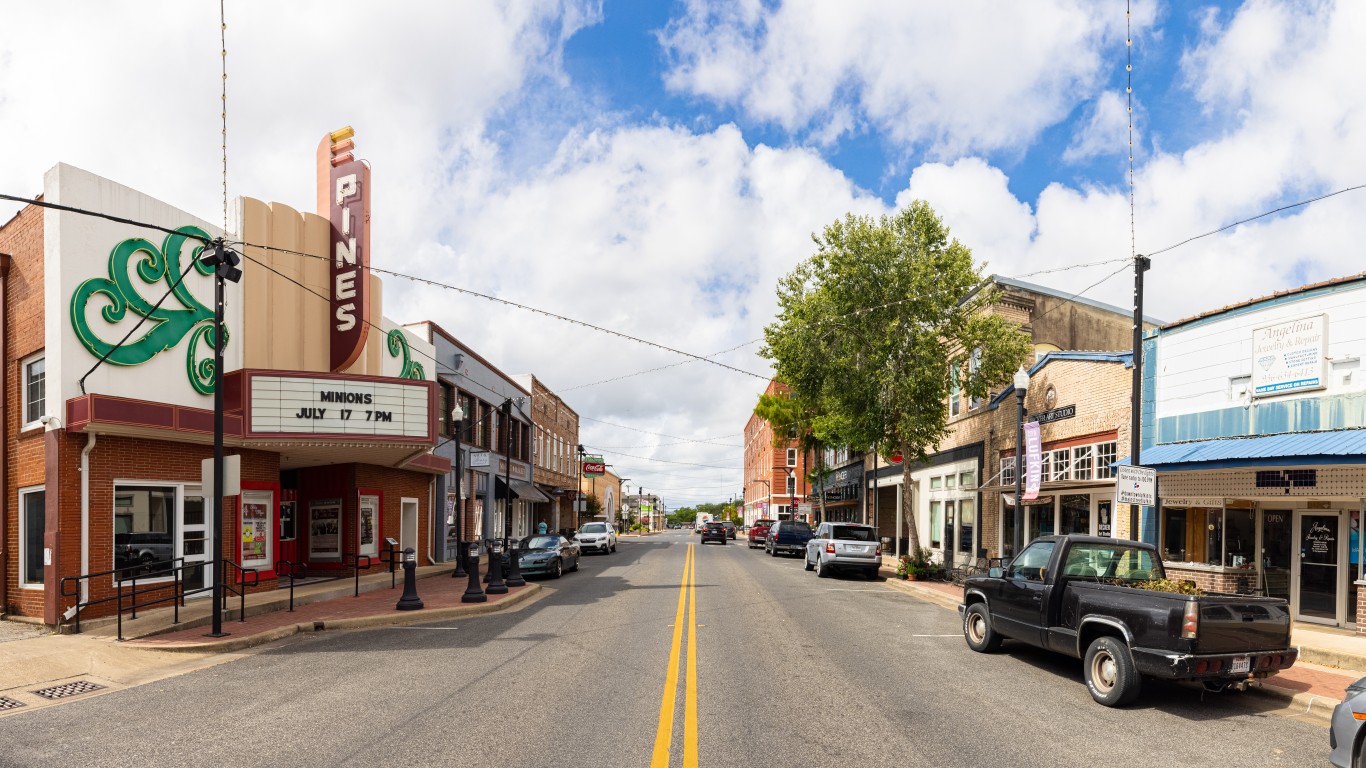
9. Lufkin, TX
> Drug offenses in 2020: 1,251 per 100,000 people (438 total)
> Drug offenses as a share of all crimes against society: 86.9%
> Drug offenses as a share of all crime: N/A
> Location: Angelina County
> Population: 35,007

8. Richardson, TX
> Drug offenses in 2020: 1,324 per 100,000 people (1,644 total)
> Drug offenses as a share of all crimes against society: 92.6%
> Drug offenses as a share of all crime: 29.4%
> Location: Dallas and Collin Counties
> Population: 124,190
7. Nacogdoches, TX
> Drug offenses in 2020: 1,338 per 100,000 people (440 total)
> Drug offenses as a share of all crimes against society: 87.3%
> Drug offenses as a share of all crime: 17.3%
> Location: Nacogdoches County
> Population: 32,873
[in-text-ad-2]
6. Longview, TX
> Drug offenses in 2020: 1,358 per 100,000 people (1,110 total)
> Drug offenses as a share of all crimes against society: 81.7%
> Drug offenses as a share of all crime: 19.0%
> Location: Gregg and Harrison Counties
> Population: 81,751
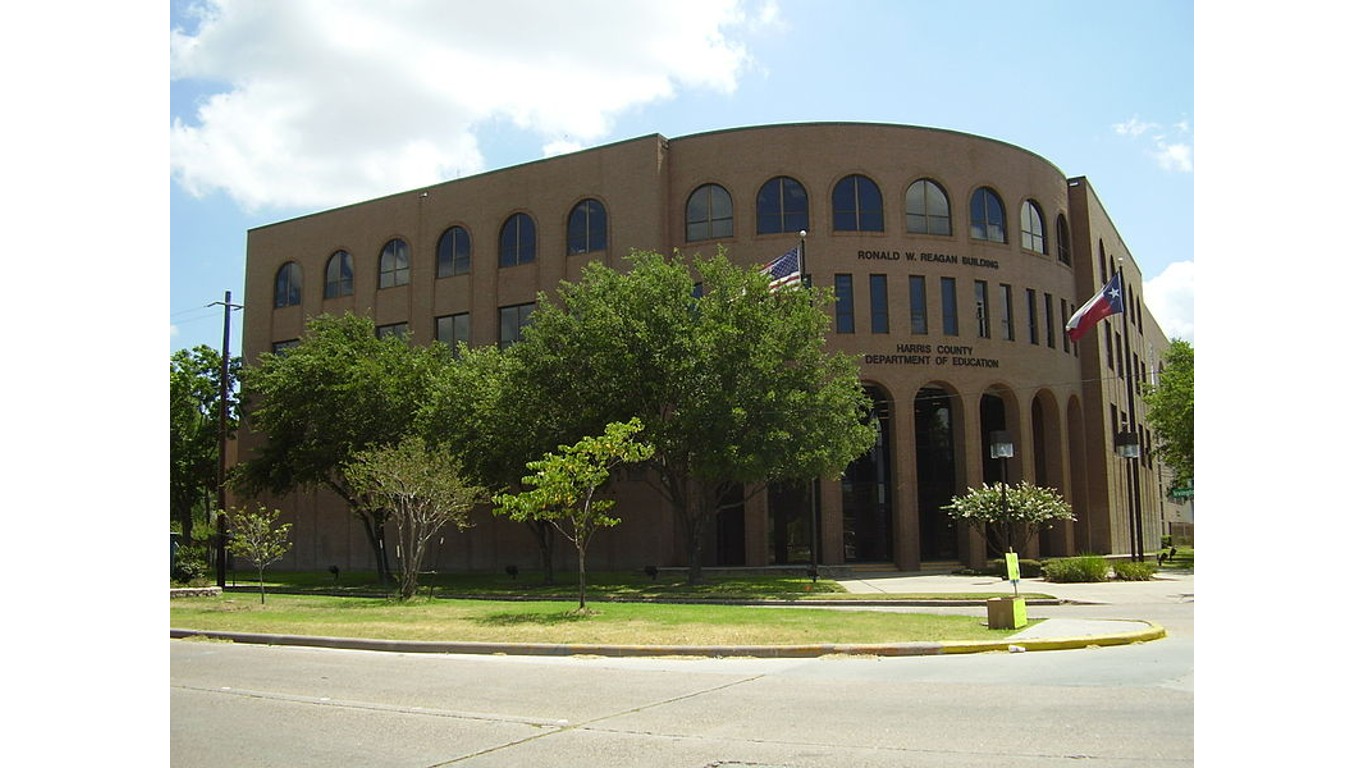
5. Deer Park, TX
> Drug offenses in 2020: 1,365 per 100,000 people (459 total)
> Drug offenses as a share of all crimes against society: 87.1%
> Drug offenses as a share of all crime: 26.7%
> Location: Harris County
> Population: 33,631
[in-text-ad]
4. Denison, TX
> Drug offenses in 2020: 1,435 per 100,000 people (371 total)
> Drug offenses as a share of all crimes against society: 88.8%
> Drug offenses as a share of all crime: 24.7%
> Location: Grayson County
> Population: 25,858
3. Hurst, TX
> Drug offenses in 2020: 1,461 per 100,000 people (567 total)
> Drug offenses as a share of all crimes against society: 91.0%
> Drug offenses as a share of all crime: 21.6%
> Location: Tarrant County
> Population: 38,796

2. Bedford, TX
> Drug offenses in 2020: 1,469 per 100,000 people (724 total)
> Drug offenses as a share of all crimes against society: 93.5%
> Drug offenses as a share of all crime: 24.4%
> Location: Tarrant County
> Population: 49,274
[in-text-ad-2]

1. San Angelo, TX
> Drug offenses in 2020: 1,477 per 100,000 people (1,504 total)
> Drug offenses as a share of all crimes against society: 95.2%
> Drug offenses as a share of all crime: 17.1%
> Location: Tom Green County
> Population: 101,860
Methodology
To identify the cities in Texas with the most drug offenses, 24/7 Wall St. reviewed data compiled by the FBI’s Uniform Crime Reporting Program. Cities are ranked by the number of drug or narcotic violations reported for every 100,000 people in 2020. According to the FBI, a drug violation or offense is the unlawful cultivation, manufacture, distribution, sale, purchase, use, possession, transportation, or importation of any controlled drug or narcotic substance
Only the 89 Texas cities that submitted data to the FBI and had populations of at least 25,000 were considered. All population figures are FBI estimates.
We also calculated drug crimes as a share of all crimes and as a share of crimes against society. Drug crimes are classified as crimes against society – a specific category of crime in which individuals or property are not harmed. Other forms of crimes against society include animal cruelty, gambling offenses, prostitution, and weapons violations.
It’s Your Money, Your Future—Own It (sponsor)
Are you ahead, or behind on retirement? For families with more than $500,000 saved for retirement, finding a financial advisor who puts your interest first can be the difference, and today it’s easier than ever. SmartAsset’s free tool matches you with up to three fiduciary financial advisors who serve your area in minutes. Each advisor has been carefully vetted and must act in your best interests. Start your search now.
If you’ve saved and built a substantial nest egg for you and your family, don’t delay; get started right here and help your retirement dreams become a retirement reality.
Thank you for reading! Have some feedback for us?
Contact the 24/7 Wall St. editorial team.
 24/7 Wall St.
 24/7 Wall St.
 24/7 Wall St.