
Exercise has been shown to be a crucial factor in maintaining a healthy weight as it helps lose body fat and build muscle tissue. Physical activity is also linked to better quality of life. Some research shows that even just 15 minutes of exercise a day provides benefits including lower risk of heart disease, diabetes, and some common types of cancer. And you don’t have to join a gym to get those benefits. Here are, for instance, 30 reasons why walking is the best exercise.
Exercise trends vary considerably across the country, from state to state as well as from city to city. Using data from County Health Rankings & Roadmaps, a Robert Wood Johnson Foundation and University of Wisconsin Population Health Institute joint program, 24/7 Tempo identified the least physically active metropolitan area in each state.
Metro areas are ranked by the share of adults 20 or older who never exercise in their leisure time. Four states – Delaware, New Hampshire, Rhode Island, and Vermont – have only one metro area each, so those areas are ranked as least active in their state by default only. (Nationwide instead of state by state, these are the 50 U.S. cities getting the least exercise.)
Click here to see the city that hates exercise the most in every state
Click here to see the full methodology
About a quarter of Americans report that they do not get any physical activity at all in their leisure time, according to the County Health Rankings. And while there’s no absolute correlation between frequency of physical activity and obesity, diabetes, and other conditions, in general the places whose population gets out and moves around are healthier. For instance, Mississippi – the state where residents report the lowest levels of physical activity – also has the highest obesity rate. And Colorado, with the second lowest level of physical inactivity in the U.S., has the lowest obesity rate in the country.

Alabama: Dothan
> Adults who don’t exercise: 35.7% (Alabama: 30.8%)
> Pop. with access to places for physical activity: 56.3% (Alabama: 56.6%)
> Adult obesity rate: 39.2% (Alabama: 36.3%)
> Adults with diabetes: 12.5% (Alabama: 12.2%)
> Adults reporting poor or fair health: 23.6% (Alabama: 21.4%)
> Avg. physically unhealthy days: 5.0 per month (Alabama: 4.8 per month)
[in-text-ad]

Alaska: Fairbanks
> Adults who don’t exercise: 22.2% (Alaska: 21.6%)
> Pop. with access to places for physical activity: 47.1% (Alaska: 64.9%)
> Adult obesity rate: 30.4% (Alaska: 30.7%)
> Adults with diabetes: 8.1% (Alaska: 7.1%)
> Adults reporting poor or fair health: 15.9% (Alaska: 15.7%)
> Avg. physically unhealthy days: 3.5 per month (Alaska: 3.6 per month)

Arizona: Lake Havasu City-Kingman
> Adults who don’t exercise: 31.1% (Arizona: 23.6%)
> Pop. with access to places for physical activity: 53.7% (Arizona: 81.9%)
> Adult obesity rate: 32.3% (Arizona: 31.9%)
> Adults with diabetes: 10.2% (Arizona: 9.8%)
> Adults reporting poor or fair health: 21.2% (Arizona: 18.3%)
> Avg. physically unhealthy days: 4.5 per month (Arizona: 4.0 per month)
Arkansas: Pine Bluff
> Adults who don’t exercise: 36.8% (Arkansas: 30.4%)
> Pop. with access to places for physical activity: 42.6% (Arkansas: 55.7%)
> Adult obesity rate: 41.2% (Arkansas: 38.0%)
> Adults with diabetes: 14.2% (Arkansas: 12.1%)
> Adults reporting poor or fair health: 26.9% (Arkansas: 24.1%)
> Avg. physically unhealthy days: 5.3 per month (Arkansas: 5.0 per month)
[in-text-ad-2]

California: El Centro
> Adults who don’t exercise: 33.3% (California: 22.3%)
> Pop. with access to places for physical activity: 81.1% (California: 92.9%)
> Adult obesity rate: 35.9% (California: 26.2%)
> Adults with diabetes: 14.6% (California: 9.4%)
> Adults reporting poor or fair health: 28.8% (California: 17.8%)
> Avg. physically unhealthy days: 4.9 per month (California: 3.7 per month)

Colorado: Pueblo
> Adults who don’t exercise: 24.0% (Colorado: 18.7%)
> Pop. with access to places for physical activity: 81.0% (Colorado: 88.4%)
> Adult obesity rate: 30.6% (Colorado: 23.6%)
> Adults with diabetes: 9.8% (Colorado: 6.6%)
> Adults reporting poor or fair health: 19.9% (Colorado: 13.7%)
> Avg. physically unhealthy days: 4.0 per month (Colorado: 3.3 per month)
[in-text-ad]
Connecticut: Norwich-New London
> Adults who don’t exercise: 24.9% (Connecticut: 23.3%)
> Pop. with access to places for physical activity: 84.0% (Connecticut: 88.8%)
> Adult obesity rate: 30.8% (Connecticut: 29.1%)
> Adults with diabetes: 8.2% (Connecticut: 8.2%)
> Adults reporting poor or fair health: 14.1% (Connecticut: 14.3%)
> Avg. physically unhealthy days: 3.5 per month (Connecticut: 3.4 per month)

Delaware: Dover
> Adults who don’t exercise: 31.0% (Delaware: 25.3%)
> Pop. with access to places for physical activity: 51.4% (Delaware: 79.9%)
> Adult obesity rate: 41.2% (Delaware: 34.2%)
> Adults with diabetes: 11.8% (Delaware: 10.9%)
> Adults reporting poor or fair health: 19.9% (Delaware: 18.0%)
> Avg. physically unhealthy days: 4.3 per month (Delaware: 3.8 per month)

Florida: Lakeland-Winter Haven
> Adults who don’t exercise: 32.8% (Florida: 25.9%)
> Pop. with access to places for physical activity: 74.2% (Florida: 86.9%)
> Adult obesity rate: 36.6% (Florida: 26.3%)
> Adults with diabetes: 12.4% (Florida: 9.4%)
> Adults reporting poor or fair health: 24.0% (Florida: 17.8%)
> Avg. physically unhealthy days: 4.8 per month (Florida: 4.0 per month)
[in-text-ad-2]

Georgia: Albany
> Adults who don’t exercise: 35.3% (Georgia: 27.4%)
> Pop. with access to places for physical activity: 55.1% (Georgia: 69.8%)
> Adult obesity rate: 37.4% (Georgia: 33.4%)
> Adults with diabetes: 14.6% (Georgia: 11.1%)
> Adults reporting poor or fair health: 25.1% (Georgia: 19.3%)
> Avg. physically unhealthy days: 5.1 per month (Georgia: 4.1 per month)

Hawaii: Urban Honolulu
> Adults who don’t exercise: 25.1% (Hawaii: 23.9%)
> Pop. with access to places for physical activity: 95.1% (Hawaii: 90.0%)
> Adult obesity rate: 25.4% (Hawaii: 25.5%)
> Adults with diabetes: 9.7% (Hawaii: 9.3%)
> Adults reporting poor or fair health: 16.6% (Hawaii: 15.3%)
> Avg. physically unhealthy days: 3.3 per month (Hawaii: 3.3 per month)
[in-text-ad]

Idaho: Twin Falls
> Adults who don’t exercise: 29.4% (Idaho: 23.3%)
> Pop. with access to places for physical activity: 58.4% (Idaho: 67.1%)
> Adult obesity rate: 33.4% (Idaho: 29.5%)
> Adults with diabetes: 10.9% (Idaho: 9.2%)
> Adults reporting poor or fair health: 20.4% (Idaho: 15.1%)
> Avg. physically unhealthy days: 4.6 per month (Idaho: 3.9 per month)
Illinois: Danville
> Adults who don’t exercise: 31.1% (Illinois: 25.1%)
> Pop. with access to places for physical activity: 62.8% (Illinois: 86.8%)
> Adult obesity rate: 39.1% (Illinois: 31.5%)
> Adults with diabetes: 11.1% (Illinois: 10.0%)
> Adults reporting poor or fair health: 21.2% (Illinois: 17.1%)
> Avg. physically unhealthy days: 4.4 per month (Illinois: 3.6 per month)

Indiana: Michigan City-La Porte
> Adults who don’t exercise: 33.6% (Indiana: 30.6%)
> Pop. with access to places for physical activity: 65.4% (Indiana: 68.4%)
> Adult obesity rate: 37.1% (Indiana: 35.4%)
> Adults with diabetes: 12.0% (Indiana: 11.1%)
> Adults reporting poor or fair health: 22.0% (Indiana: 18.9%)
> Avg. physically unhealthy days: 4.5 per month (Indiana: 4.1 per month)
[in-text-ad-2]

Iowa: Sioux City
> Adults who don’t exercise: 31.4% (Iowa: 26.1%)
> Pop. with access to places for physical activity: 82.9% (Iowa: 72.7%)
> Adult obesity rate: 39.2% (Iowa: 34.3%)
> Adults with diabetes: 10.5% (Iowa: 9.0%)
> Adults reporting poor or fair health: 17.2% (Iowa: 13.6%)
> Avg. physically unhealthy days: 3.5 per month (Iowa: 3.1 per month)

Kansas: Topeka
> Adults who don’t exercise: 29.5% (Kansas: 26.7%)
> Pop. with access to places for physical activity: 73.3% (Kansas: 73.3%)
> Adult obesity rate: 38.1% (Kansas: 35.6%)
> Adults with diabetes: 10.3% (Kansas: 9.7%)
> Adults reporting poor or fair health: 17.7% (Kansas: 17.1%)
> Avg. physically unhealthy days: 3.5 per month (Kansas: 3.6 per month)
[in-text-ad]

Kentucky: Elizabethtown-Fort Knox
> Adults who don’t exercise: 33.1% (Kentucky: 31.6%)
> Pop. with access to places for physical activity: 55.0% (Kentucky: 65.8%)
> Adult obesity rate: 36.8% (Kentucky: 36.4%)
> Adults with diabetes: 11.4% (Kentucky: 11.7%)
> Adults reporting poor or fair health: 21.6% (Kentucky: 22.0%)
> Avg. physically unhealthy days: 4.7 per month (Kentucky: 5.0 per month)
Louisiana: Houma-Thibodaux
> Adults who don’t exercise: 36.1% (Louisiana: 31.5%)
> Pop. with access to places for physical activity: 70.5% (Louisiana: 71.9%)
> Adult obesity rate: 39.2% (Louisiana: 36.2%)
> Adults with diabetes: 11.6% (Louisiana: 11.3%)
> Adults reporting poor or fair health: 24.2% (Louisiana: 21.7%)
> Avg. physically unhealthy days: 4.8 per month (Louisiana: 4.6 per month)

Maine: Bangor
> Adults who don’t exercise: 33.5% (Maine: 29.5%)
> Pop. with access to places for physical activity: 53.5% (Maine: 56.6%)
> Adult obesity rate: 34.7% (Maine: 31.4%)
> Adults with diabetes: 9.5% (Maine: 8.7%)
> Adults reporting poor or fair health: 18.5% (Maine: 17.2%)
> Avg. physically unhealthy days: 4.3 per month (Maine: 4.2 per month)
[in-text-ad-2]

Maryland: Cumberland
> Adults who don’t exercise: 31.1% (Maryland: 23.0%)
> Pop. with access to places for physical activity: 58.7% (Maryland: 88.2%)
> Adult obesity rate: 38.8% (Maryland: 32.0%)
> Adults with diabetes: 11.3% (Maryland: 9.8%)
> Adults reporting poor or fair health: 20.1% (Maryland: 14.0%)
> Avg. physically unhealthy days: 4.5 per month (Maryland: 3.2 per month)

Massachusetts: Springfield
> Adults who don’t exercise: 29.6% (Massachusetts: 26.0%)
> Pop. with access to places for physical activity: 83.6% (Massachusetts: 89.4%)
> Adult obesity rate: 28.6% (Massachusetts: 25.4%)
> Adults with diabetes: 9.0% (Massachusetts: 7.4%)
> Adults reporting poor or fair health: 17.7% (Massachusetts: 13.4%)
> Avg. physically unhealthy days: 4.0 per month (Massachusetts: 3.4 per month)
[in-text-ad]

Michigan: Muskegon
> Adults who don’t exercise: 30.3% (Michigan: 24.6%)
> Pop. with access to places for physical activity: 67.5% (Michigan: 77.1%)
> Adult obesity rate: 40.1% (Michigan: 35.8%)
> Adults with diabetes: 10.3% (Michigan: 9.5%)
> Adults reporting poor or fair health: 20.3% (Michigan: 18.2%)
> Avg. physically unhealthy days: 4.6 per month (Michigan: 4.2 per month)

Minnesota: St. Cloud
> Adults who don’t exercise: 23.4% (Minnesota: 19.7%)
> Pop. with access to places for physical activity: 63.3% (Minnesota: 80.7%)
> Adult obesity rate: 34.7% (Minnesota: 30.0%)
> Adults with diabetes: 8.5% (Minnesota: 7.8%)
> Adults reporting poor or fair health: 15.0% (Minnesota: 13.3%)
> Avg. physically unhealthy days: 3.4 per month (Minnesota: 3.1 per month)

Mississippi: Hattiesburg
> Adults who don’t exercise: 37.4% (Mississippi: 36.9%)
> Pop. with access to places for physical activity: 57.8% (Mississippi: 51.6%)
> Adult obesity rate: 41.1% (Mississippi: 41.2%)
> Adults with diabetes: 12.1% (Mississippi: 13.3%)
> Adults reporting poor or fair health: 22.7% (Mississippi: 22.0%)
> Avg. physically unhealthy days: 4.3 per month (Mississippi: 4.1 per month)
[in-text-ad-2]
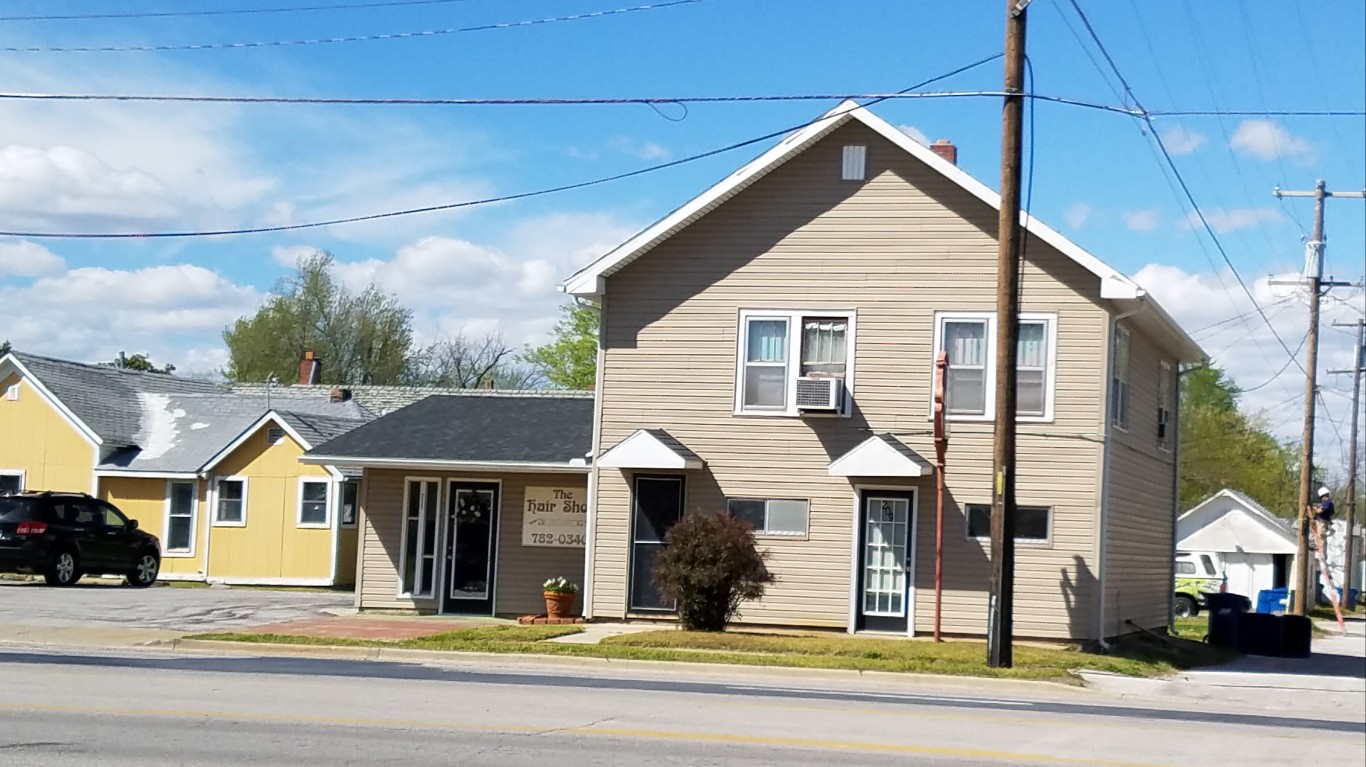
Missouri: Joplin
> Adults who don’t exercise: 34.2% (Missouri: 29.6%)
> Pop. with access to places for physical activity: 57.6% (Missouri: 70.5%)
> Adult obesity rate: 37.8% (Missouri: 34.6%)
> Adults with diabetes: 10.0% (Missouri: 9.0%)
> Adults reporting poor or fair health: 21.3% (Missouri: 17.6%)
> Avg. physically unhealthy days: 4.6 per month (Missouri: 4.0 per month)

Montana: Billings
> Adults who don’t exercise: 22.3% (Montana: 18.6%)
> Pop. with access to places for physical activity: 73.7% (Montana: 66.9%)
> Adult obesity rate: 31.8% (Montana: 28.0%)
> Adults with diabetes: 7.4% (Montana: 6.4%)
> Adults reporting poor or fair health: 14.7% (Montana: 14.4%)
> Avg. physically unhealthy days: 3.8 per month (Montana: 4.1 per month)
[in-text-ad]

Nebraska: Grand Island
> Adults who don’t exercise: 32.8% (Nebraska: 26.6%)
> Pop. with access to places for physical activity: 75.7% (Nebraska: 78.2%)
> Adult obesity rate: 40.2% (Nebraska: 34.3%)
> Adults with diabetes: 10.2% (Nebraska: 9.1%)
> Adults reporting poor or fair health: 17.4% (Nebraska: 13.9%)
> Avg. physically unhealthy days: 3.5 per month (Nebraska: 3.3 per month)

Nevada: Las Vegas-Henderson-Paradise
> Adults who don’t exercise: 27.2% (Nevada: 25.6%)
> Pop. with access to places for physical activity: 95.6% (Nevada: 90.3%)
> Adult obesity rate: 30.1% (Nevada: 30.5%)
> Adults with diabetes: 10.7% (Nevada: 9.9%)
> Adults reporting poor or fair health: 20.8% (Nevada: 20.1%)
> Avg. physically unhealthy days: 4.1 per month (Nevada: 4.2 per month)

New Hampshire: Manchester-Nashua
> Adults who don’t exercise: 22.0% (New Hampshire: 21.1%)
> Pop. with access to places for physical activity: 77.6% (New Hampshire: 73.9%)
> Adult obesity rate: 32.2% (New Hampshire: 32.1%)
> Adults with diabetes: 8.0% (New Hampshire: 8.0%)
> Adults reporting poor or fair health: 14.2% (New Hampshire: 14.3%)
> Avg. physically unhealthy days: 3.4 per month (New Hampshire: 3.9 per month)
[in-text-ad-2]

New Jersey: Vineland-Bridgeton
> Adults who don’t exercise: 36.3% (New Jersey: 27.9%)
> Pop. with access to places for physical activity: 69.2% (New Jersey: 91.3%)
> Adult obesity rate: 39.7% (New Jersey: 25.5%)
> Adults with diabetes: 12.2% (New Jersey: 9.5%)
> Adults reporting poor or fair health: 25.2% (New Jersey: 15.5%)
> Avg. physically unhealthy days: 5.3 per month (New Jersey: 3.7 per month)

New Mexico: Las Cruces
> Adults who don’t exercise: 28.3% (New Mexico: 24.8%)
> Pop. with access to places for physical activity: 68.9% (New Mexico: 72.0%)
> Adult obesity rate: 34.7% (New Mexico: 32.2%)
> Adults with diabetes: 13.2% (New Mexico: 10.9%)
> Adults reporting poor or fair health: 24.8% (New Mexico: 20.0%)
> Avg. physically unhealthy days: 4.6 per month (New Mexico: 4.2 per month)
[in-text-ad]
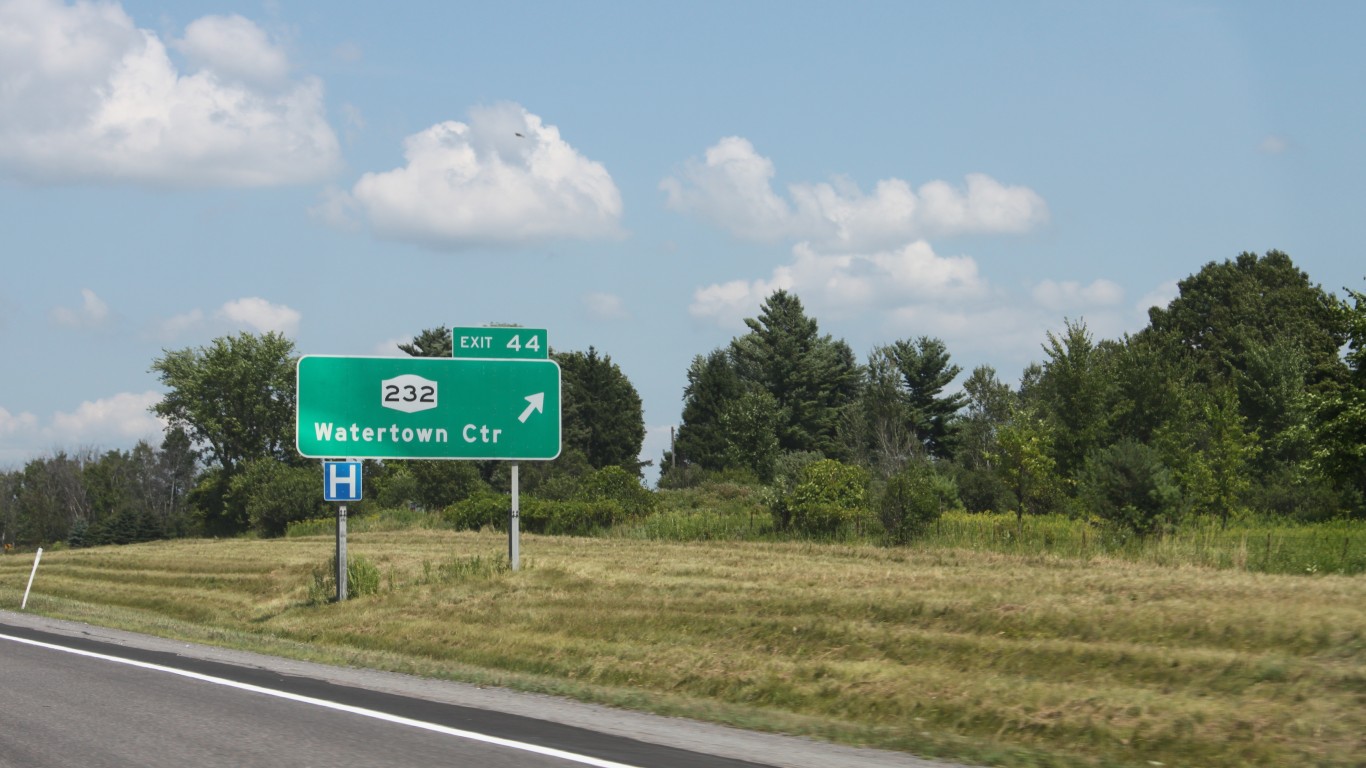
New York: Watertown-Fort Drum
> Adults who don’t exercise: 29.9% (New York: 27.0%)
> Pop. with access to places for physical activity: 52.2% (New York: 88.2%)
> Adult obesity rate: 33.5% (New York: 27.2%)
> Adults with diabetes: 9.7% (New York: 9.4%)
> Adults reporting poor or fair health: 18.7% (New York: 16.4%)
> Avg. physically unhealthy days: 4.1 per month (New York: 3.6 per month)
North Carolina: Rocky Mount
> Adults who don’t exercise: 32.1% (North Carolina: 25.9%)
> Pop. with access to places for physical activity: 48.9% (North Carolina: 67.6%)
> Adult obesity rate: 37.0% (North Carolina: 34.0%)
> Adults with diabetes: 13.5% (North Carolina: 10.5%)
> Adults reporting poor or fair health: 24.1% (North Carolina: 18.5%)
> Avg. physically unhealthy days: 4.4 per month (North Carolina: 3.7 per month)
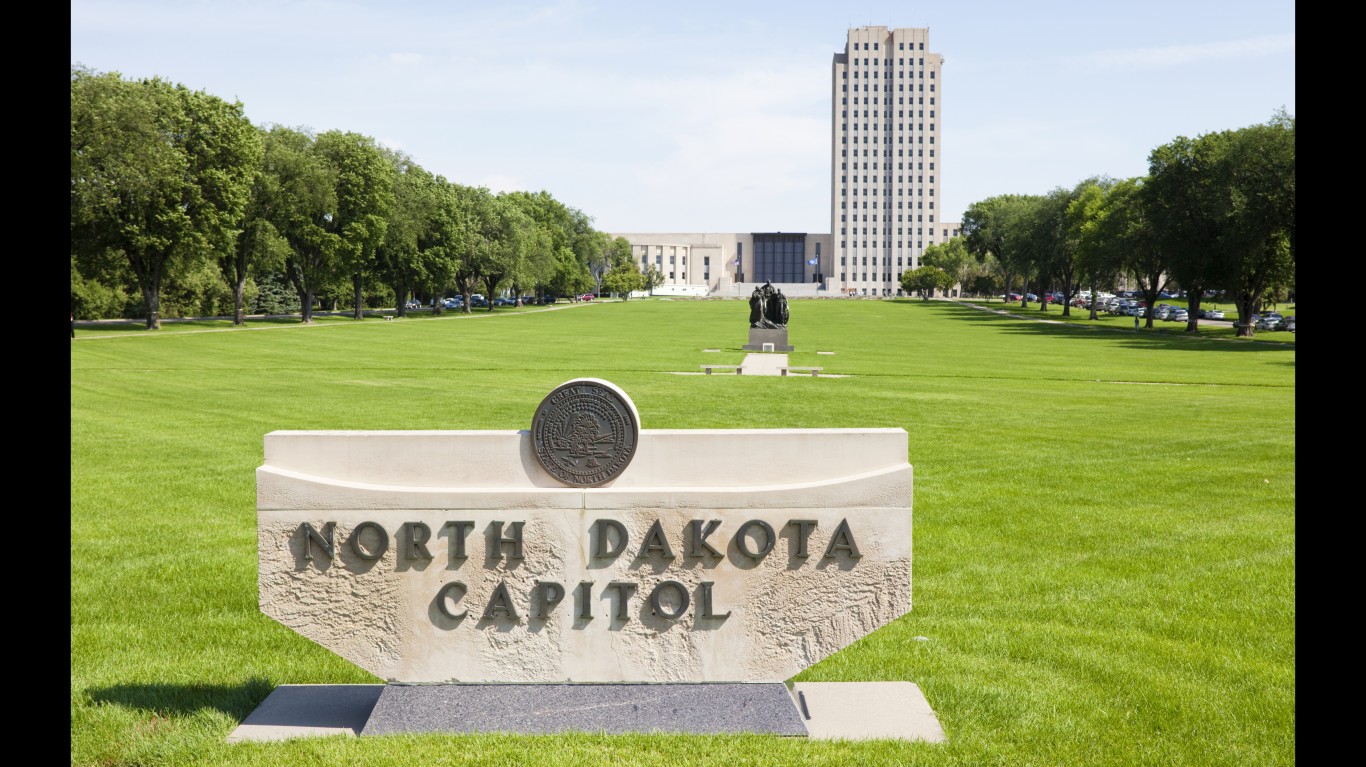
North Dakota: Bismarck
> Adults who don’t exercise: 26.1% (North Dakota: 27.9%)
> Pop. with access to places for physical activity: 69.6% (North Dakota: 64.5%)
> Adult obesity rate: 33.2% (North Dakota: 35.8%)
> Adults with diabetes: 7.8% (North Dakota: 8.2%)
> Adults reporting poor or fair health: 13.6% (North Dakota: 13.3%)
> Avg. physically unhealthy days: 3.1 per month (North Dakota: 3.1 per month)
[in-text-ad-2]

Ohio: Lima
> Adults who don’t exercise: 34.0% (Ohio: 27.6%)
> Pop. with access to places for physical activity: 73.5% (Ohio: 77.2%)
> Adult obesity rate: 39.3% (Ohio: 34.6%)
> Adults with diabetes: 11.7% (Ohio: 10.3%)
> Adults reporting poor or fair health: 20.1% (Ohio: 18.1%)
> Avg. physically unhealthy days: 4.5 per month (Ohio: 4.2 per month)

Oklahoma: Lawton
> Adults who don’t exercise: 39.0% (Oklahoma: 33.4%)
> Pop. with access to places for physical activity: 50.4% (Oklahoma: 65.2%)
> Adult obesity rate: 42.1% (Oklahoma: 37.1%)
> Adults with diabetes: 11.8% (Oklahoma: 11.0%)
> Adults reporting poor or fair health: 23.0% (Oklahoma: 21.3%)
> Avg. physically unhealthy days: 4.4 per month (Oklahoma: 4.6 per month)
[in-text-ad]

Oregon: Grants Pass
> Adults who don’t exercise: 28.5% (Oregon: 23.5%)
> Pop. with access to places for physical activity: 69.0% (Oregon: 83.8%)
> Adult obesity rate: 32.8% (Oregon: 28.8%)
> Adults with diabetes: 9.6% (Oregon: 7.5%)
> Adults reporting poor or fair health: 20.9% (Oregon: 17.4%)
> Avg. physically unhealthy days: 4.7 per month (Oregon: 3.9 per month)
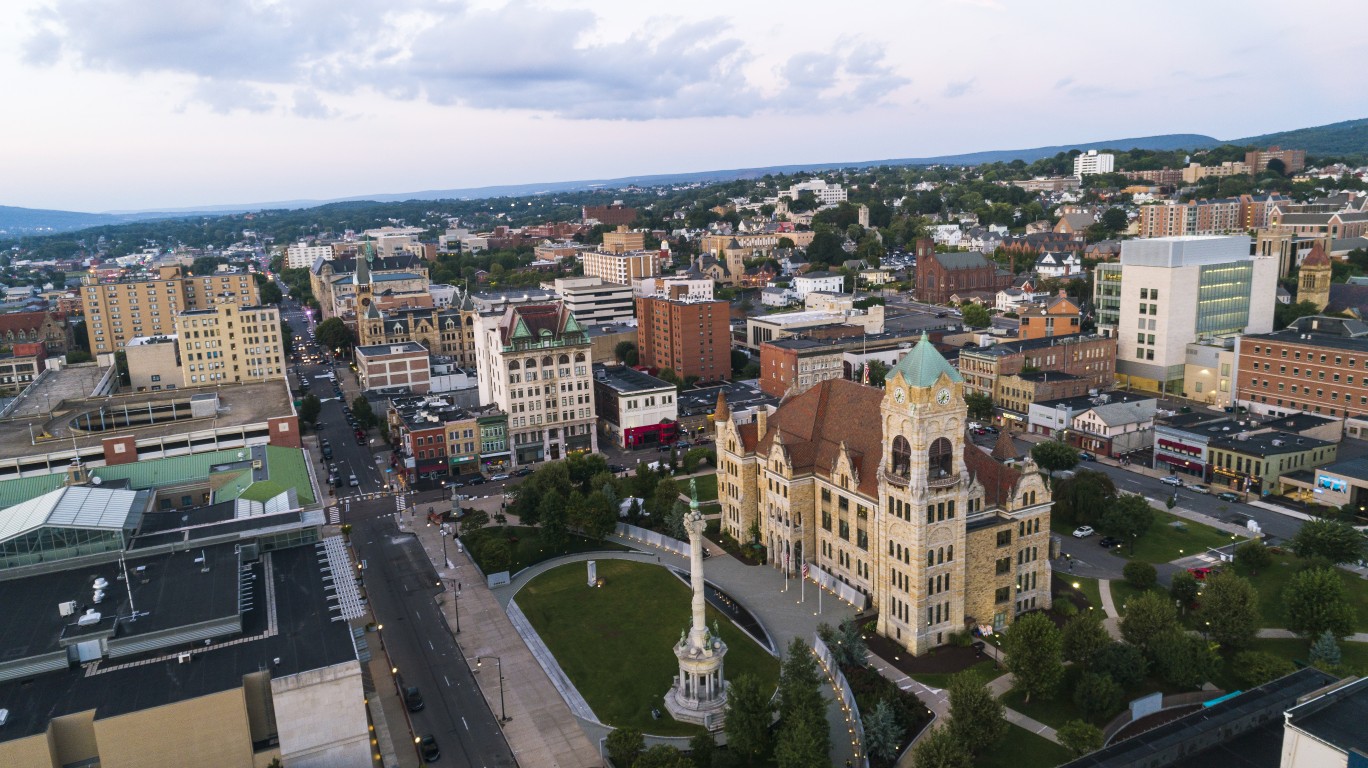
Pennsylvania: Scranton-Wilkes-Barre
> Adults who don’t exercise: 29.4% (Pennsylvania: 24.6%)
> Pop. with access to places for physical activity: 73.9% (Pennsylvania: 78.4%)
> Adult obesity rate: 33.8% (Pennsylvania: 33.1%)
> Adults with diabetes: 9.4% (Pennsylvania: 9.2%)
> Adults reporting poor or fair health: 19.7% (Pennsylvania: 17.6%)
> Avg. physically unhealthy days: 4.3 per month (Pennsylvania: 3.9 per month)

Rhode Island: Providence-Warwick
> Adults who don’t exercise: 27.8% (Rhode Island: 26.0%)
> Pop. with access to places for physical activity: 87.3% (Rhode Island: 87.5%)
> Adult obesity rate: 31.0% (Rhode Island: 30.1%)
> Adults with diabetes: 9.2% (Rhode Island: 9.1%)
> Adults reporting poor or fair health: 17.4% (Rhode Island: 16.3%)
> Avg. physically unhealthy days: 4.0 per month (Rhode Island: 4.0 per month)
[in-text-ad-2]

South Carolina: Sumter
> Adults who don’t exercise: 33.5% (South Carolina: 28.5%)
> Pop. with access to places for physical activity: 61.5% (South Carolina: 65.3%)
> Adult obesity rate: 40.1% (South Carolina: 35.5%)
> Adults with diabetes: 13.8% (South Carolina: 11.5%)
> Adults reporting poor or fair health: 23.8% (South Carolina: 17.8%)
> Avg. physically unhealthy days: 4.7 per month (South Carolina: 4.1 per month)

South Dakota: Rapid City
> Adults who don’t exercise: 29.7% (South Dakota: 28.9%)
> Pop. with access to places for physical activity: 78.4% (South Dakota: 66.0%)
> Adult obesity rate: 29.6% (South Dakota: 33.1%)
> Adults with diabetes: 8.1% (South Dakota: 9.3%)
> Adults reporting poor or fair health: 14.7% (South Dakota: 15.1%)
> Avg. physically unhealthy days: 3.2 per month (South Dakota: 3.4 per month)
[in-text-ad]

Tennessee: Jackson
> Adults who don’t exercise: 33.7% (Tennessee: 29.0%)
> Pop. with access to places for physical activity: 46.3% (Tennessee: 62.2%)
> Adult obesity rate: 40.1% (Tennessee: 36.6%)
> Adults with diabetes: 12.9% (Tennessee: 12.0%)
> Adults reporting poor or fair health: 24.0% (Tennessee: 20.3%)
> Avg. physically unhealthy days: 5.0 per month (Tennessee: 4.5 per month)

Texas: Laredo
> Adults who don’t exercise: 38.9% (Texas: 26.9%)
> Pop. with access to places for physical activity: 92.3% (Texas: 80.1%)
> Adult obesity rate: 41.8% (Texas: 34.1%)
> Adults with diabetes: 17.8% (Texas: 11.8%)
> Adults reporting poor or fair health: 34.2% (Texas: 20.9%)
> Avg. physically unhealthy days: 5.0 per month (Texas: 3.6 per month)

Utah: Ogden-Clearfield
> Adults who don’t exercise: 21.4% (Utah: 18.7%)
> Pop. with access to places for physical activity: 83.9% (Utah: 82.9%)
> Adult obesity rate: 34.7% (Utah: 29.9%)
> Adults with diabetes: 9.1% (Utah: 8.3%)
> Adults reporting poor or fair health: 16.0% (Utah: 14.8%)
> Avg. physically unhealthy days: 3.6 per month (Utah: 3.8 per month)
[in-text-ad-2]

Vermont: Burlington-South Burlington
> Adults who don’t exercise: 18.7% (Vermont: 19.3%)
> Pop. with access to places for physical activity: 69.0% (Vermont: 62.5%)
> Adult obesity rate: 25.2% (Vermont: 27.1%)
> Adults with diabetes: 6.8% (Vermont: 7.3%)
> Adults reporting poor or fair health: 12.0% (Vermont: 12.6%)
> Avg. physically unhealthy days: 3.4 per month (Vermont: 3.7 per month)

Virginia: Harrisonburg
> Adults who don’t exercise: 30.4% (Virginia: 24.8%)
> Pop. with access to places for physical activity: 67.3% (Virginia: 77.8%)
> Adult obesity rate: 35.5% (Virginia: 31.8%)
> Adults with diabetes: 10.8% (Virginia: 9.8%)
> Adults reporting poor or fair health: 20.6% (Virginia: 16.1%)
> Avg. physically unhealthy days: 4.3 per month (Virginia: 3.7 per month)
[in-text-ad]

Washington: Yakima
> Adults who don’t exercise: 28.6% (Washington: 18.9%)
> Pop. with access to places for physical activity: 62.5% (Washington: 78.8%)
> Adult obesity rate: 37.1% (Washington: 28.2%)
> Adults with diabetes: 13.0% (Washington: 8.5%)
> Adults reporting poor or fair health: 25.7% (Washington: 15.7%)
> Avg. physically unhealthy days: 4.9 per month (Washington: 3.9 per month)

West Virginia: Beckley
> Adults who don’t exercise: 35.4% (West Virginia: 29.5%)
> Pop. with access to places for physical activity: 50.4% (West Virginia: 49.9%)
> Adult obesity rate: 40.4% (West Virginia: 39.7%)
> Adults with diabetes: 13.1% (West Virginia: 13.0%)
> Adults reporting poor or fair health: 26.9% (West Virginia: 24.3%)
> Avg. physically unhealthy days: 5.7 per month (West Virginia: 5.3 per month)
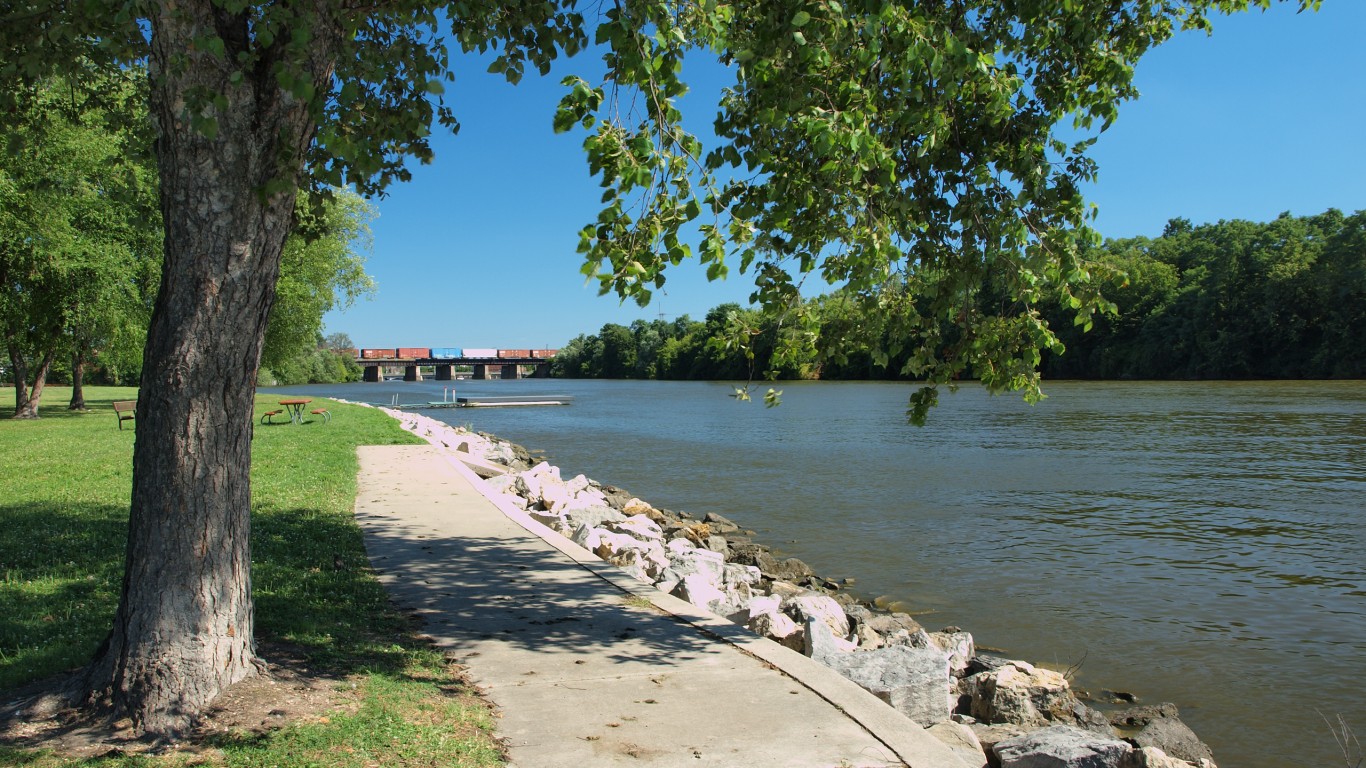
Wisconsin: Janesville-Beloit
> Adults who don’t exercise: 25.6% (Wisconsin: 22.3%)
> Pop. with access to places for physical activity: 83.5% (Wisconsin: 77.8%)
> Adult obesity rate: 36.5% (Wisconsin: 34.3%)
> Adults with diabetes: 8.5% (Wisconsin: 7.4%)
> Adults reporting poor or fair health: 16.3% (Wisconsin: 15.0%)
> Avg. physically unhealthy days: 3.7 per month (Wisconsin: 3.6 per month)
[in-text-ad-2]

Wyoming: Casper
> Adults who don’t exercise: 26.0% (Wyoming: 24.0%)
> Pop. with access to places for physical activity: 83.5% (Wyoming: 73.1%)
> Adult obesity rate: 31.1% (Wyoming: 29.6%)
> Adults with diabetes: 7.9% (Wyoming: 6.8%)
> Adults reporting poor or fair health: 15.8% (Wyoming: 15.7%)
> Avg. physically unhealthy days: 3.5 per month (Wyoming: 3.5 per month)
Methodology
To determine the city that hates exercise the most in every state, 24/7 Tempo reviewed adult physical inactivity rates from the Robert Wood Johnson Foundation and the University of Wisconsin Population Health Institute joint program’s 2022 County Health Rankings & Roadmaps report.
The physical inactivity rate is defined as the share of adults 20 years and older who report no leisure-time physical activity. While the CHR report is from 2022, physical inactivity figures published in the report are from 2019.
We considered the 384 metropolitan statistical areas delineated by the United States Office of Management and Budget and used by the Census Bureau for our ranking and ranked metros within their state based on their adult physical inactivity rate. Since many metros cross state lines, the metro was assigned to the state of its first-listed principal city. Thus, the Washington-Arlington-Alexandria, DC-VA-MD-WV metro area was excluded as it is principally in the District of Columbia.
Additional information on the share of the population with adequate access to locations for physical activity, the share of adults 20 years and older who report a body mass index of 30 kg/m2 or higher (adult obesity rate), the share of adults 20 years and older with diagnosed diabetes, the share of adults reporting poor or fair health, and the average number of physically unhealthy days reported in the past 30 days also came from the 2022 CHR.
Want to Retire Early? Start Here (Sponsor)
Want retirement to come a few years earlier than you’d planned? Or are you ready to retire now, but want an extra set of eyes on your finances?
Now you can speak with up to 3 financial experts in your area for FREE. By simply clicking here you can begin to match with financial professionals who can help you build your plan to retire early. And the best part? The first conversation with them is free.
Click here to match with up to 3 financial pros who would be excited to help you make financial decisions.
Have questions about retirement or personal finance? Email us at [email protected]!
By emailing your questions to 24/7 Wall St., you agree to have them published anonymously on a673b.bigscoots-temp.com.
By submitting your story, you understand and agree that we may use your story, or versions of it, in all media and platforms, including via third parties.
Thank you for reading! Have some feedback for us?
Contact the 24/7 Wall St. editorial team.

 24/7 Wall St.
 24/7 Wall St.
 24/7 Wall St.
