Special Report
States Where Inflation Is Causing the Most Stress
Published:
Last Updated:

Inflation has been surging to multi-decade highs in the U,S. According to the congressional Joint Economic Committee, prices climbed by 13.3% between January 2021 and July 2022, resulting in a $717 increase in monthly expenses for the average American household. Driven by a number of factors – including Russia’s invasion of Ukraine and supply chain constraints tied to the COVID-19 pandemic – the inflation crisis is weighing heavy on American consumers.
A recent survey conducted by the U.S. Census Bureau found that 46.9% of American adults have found inflation to be “very stressful” in the last two months, and another 27.5% have found it to be “moderately stressful.” Meanwhile, only 5.2% of adults say inflation is “not at all stressful.” (Here is a look at what is getting more expensive at stores in America.)
Of course, inflation rates and other economic conditions vary across the country, and in some states, Americans are far more likely to be feeling the pinch.
Using survey data collected between Oct. 5 and Oct.17, 2022 by the Census Bureau’s Household Pulse Survey, 24/7 Wall St. identified the states where inflation is causing the most stress. States are ranked by the share of adults who have found inflation to be very stressful. Among the 50 states, the share of the 18 and older people who are very stressed by inflation ranges from 34% to about 58%.
In 11 states, over half of all adults find inflation to be very stressful, and in each of them, the inflation rate between January 2021 and July 2022 exceeds the 13.3% national average. Residents of these states are also less likely to be equipped to absorb rising costs, as in each one, the median household income is below the $69,717 national median, while the poverty rate exceeds the 12.8% national rate. (Here is a look at the states where Americans make the least money.)
It is important to note that in some parts of the country where inflation is less of a concern based on the survey, inflation rates also exceed the national average. Still, in each of the eight states where fewer than 40% of adults report high levels of stress regarding inflation, the poverty rate is below the national rate. And in all but one, the September unemployment rate was below the 3.5% national jobless rate.
Click here to see states where inflation is causing the most stress.
Click here to see our detailed methodology.
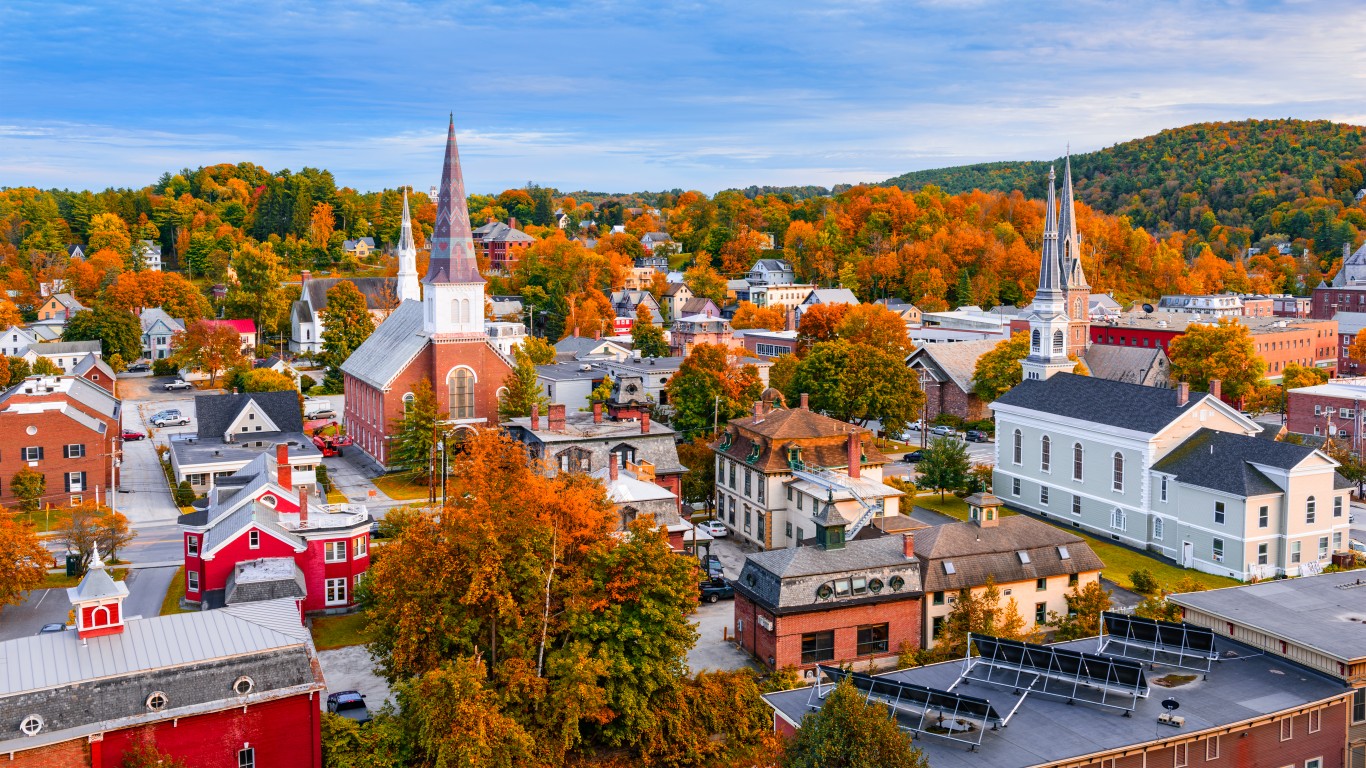
50. Vermont
> Adults who find inflation very stressful: 34.0% (157,408 total)
> Adults who find inflation moderately stressful: 32.7% – 6th highest (151,543 total)
> Price inflation from Jan. 2021 to July 2022: +10.7% (+$586 in avg. monthly household expenses)
> 2021 median household income: $72,431 – 16th highest
> 2021 poverty rate: 10.3% – 9th lowest
> Sept. 2022 unemployment: 2.1%
[in-text-ad]
49. Montana
> Adults who find inflation very stressful: 35.8% (267,505 total)
> Adults who find inflation moderately stressful: 33.3% – 4th highest (248,889 total)
> Price inflation from Jan. 2021 to July 2022: +15.4% (+$790 in avg. monthly household expenses)
> 2021 median household income: $63,249 – 16th lowest
> 2021 poverty rate: 11.9% – 24th lowest
> Sept. 2022 unemployment: 2.9%
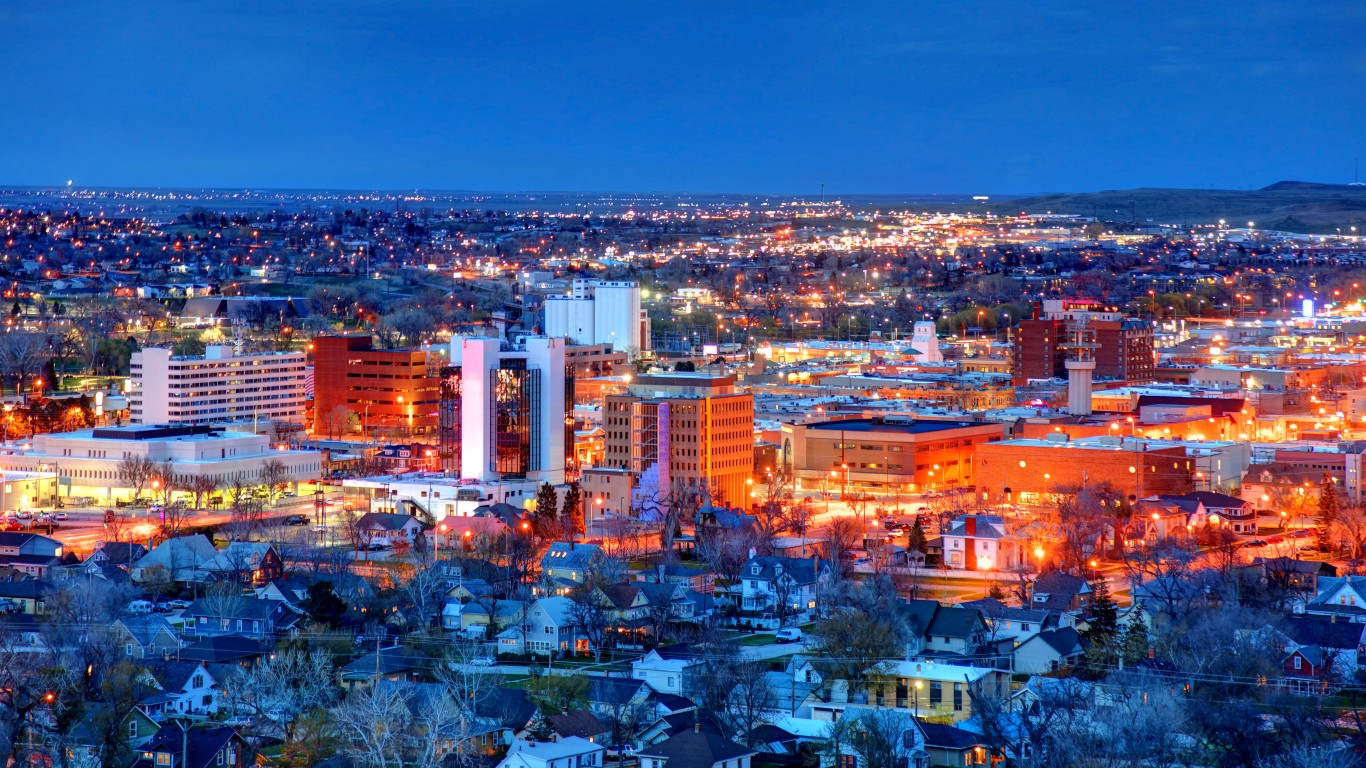
48. South Dakota
> Adults who find inflation very stressful: 36.5% (209,284 total)
> Adults who find inflation moderately stressful: 33.0% – 5th highest (189,357 total)
> Price inflation from Jan. 2021 to July 2022: +13.8% (+$759 in avg. monthly household expenses)
> 2021 median household income: $66,143 – 22nd lowest
> 2021 poverty rate: 12.3% – 22nd highest
> Sept. 2022 unemployment: 2.3%
47. Minnesota
> Adults who find inflation very stressful: 37.4% (1,434,251 total)
> Adults who find inflation moderately stressful: 25.2% – 7th lowest (966,189 total)
> Price inflation from Jan. 2021 to July 2022: +13.8% (+$831 in avg. monthly household expenses)
> 2021 median household income: $77,720 – 13th highest
> 2021 poverty rate: 9.3% – 3rd lowest
> Sept. 2022 unemployment: 2.0%
[in-text-ad-2]
46. Wisconsin
> Adults who find inflation very stressful: 37.4% (1,531,040 total)
> Adults who find inflation moderately stressful: 30.8% – 10th highest (1,260,646 total)
> Price inflation from Jan. 2021 to July 2022: +14.1% (+$689 in avg. monthly household expenses)
> 2021 median household income: $67,125 – 22nd highest
> 2021 poverty rate: 10.8% – 14th lowest
> Sept. 2022 unemployment: 3.2%

45. Maryland
> Adults who find inflation very stressful: 39.1% (1,570,923 total)
> Adults who find inflation moderately stressful: 28.3% – 25th highest (1,137,587 total)
> Price inflation from Jan. 2021 to July 2022: +13.9% (+$774 in avg. monthly household expenses)
> 2021 median household income: $90,203 – the highest
> 2021 poverty rate: 10.3% – 10th lowest
> Sept. 2022 unemployment: 4.0%
[in-text-ad]
44. Washington
> Adults who find inflation very stressful: 39.7% (2,170,256 total)
> Adults who find inflation moderately stressful: 29.7% – 16th highest (1,623,549 total)
> Price inflation from Jan. 2021 to July 2022: +12.5% (+$677 in avg. monthly household expenses)
> 2021 median household income: $84,247 – 7th highest
> 2021 poverty rate: 9.9% – 5th lowest
> Sept. 2022 unemployment: 3.7%
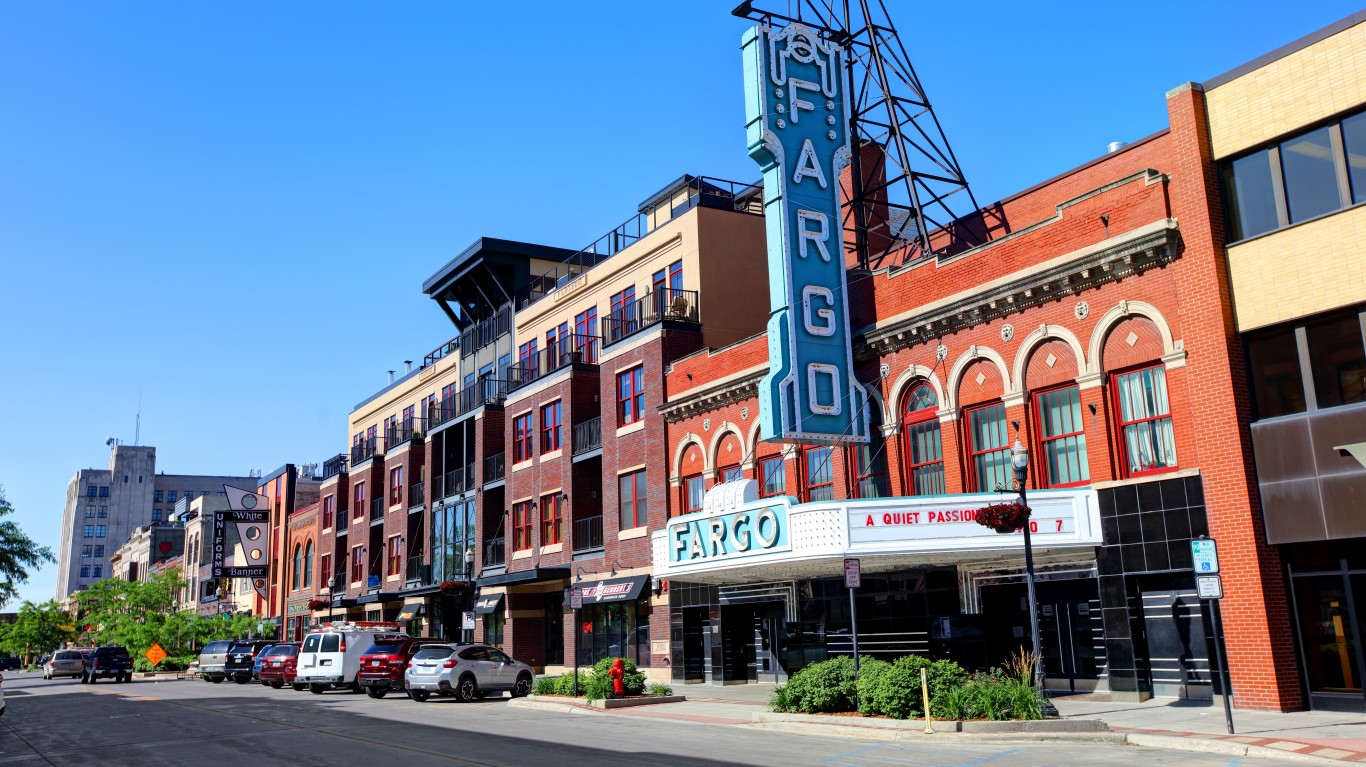
43. North Dakota
> Adults who find inflation very stressful: 39.9% (197,684 total)
> Adults who find inflation moderately stressful: 35.4% – 2nd highest (175,365 total)
> Price inflation from Jan. 2021 to July 2022: +13.8% (+$760 in avg. monthly household expenses)
> 2021 median household income: $66,519 – 25th lowest
> 2021 poverty rate: 11.1% – 16th lowest
> Sept. 2022 unemployment: 2.2%

42. Connecticut
> Adults who find inflation very stressful: 40.9% (1,000,928 total)
> Adults who find inflation moderately stressful: 31.5% – 8th highest (769,799 total)
> Price inflation from Jan. 2021 to July 2022: +10.7% (+$689 in avg. monthly household expenses)
> 2021 median household income: $83,771 – 8th highest
> 2021 poverty rate: 10.1% – 6th lowest
> Sept. 2022 unemployment: 4.0%
[in-text-ad-2]
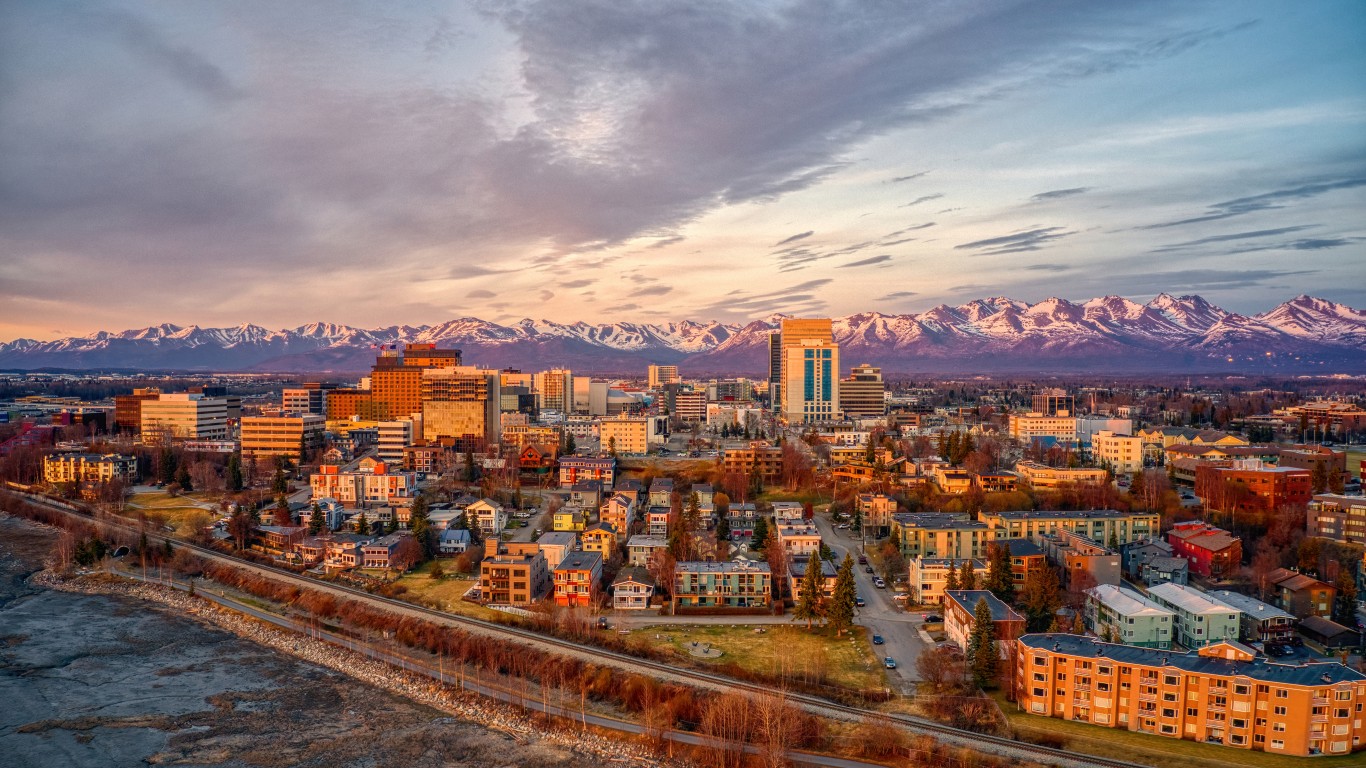
41. Alaska
> Adults who find inflation very stressful: 41.6% (205,529 total)
> Adults who find inflation moderately stressful: 30.0% – 12th highest (148,164 total)
> Price inflation from Jan. 2021 to July 2022: +12.5% (+$790 in avg. monthly household expenses)
> 2021 median household income: $77,845 – 12th highest
> 2021 poverty rate: 10.5% – 12th lowest
> Sept. 2022 unemployment: 4.4%

40. Iowa
> Adults who find inflation very stressful: 41.7% (888,635 total)
> Adults who find inflation moderately stressful: 34.2% – 3rd highest (730,198 total)
> Price inflation from Jan. 2021 to July 2022: +13.8% (+$674 in avg. monthly household expenses)
> 2021 median household income: $65,600 – 21st lowest
> 2021 poverty rate: 11.1% – 17th lowest
> Sept. 2022 unemployment: 2.7%
[in-text-ad]
39. Illinois
> Adults who find inflation very stressful: 41.8% (3,534,768 total)
> Adults who find inflation moderately stressful: 29.7% – 18th highest (2,511,125 total)
> Price inflation from Jan. 2021 to July 2022: +14.1% (+$787 in avg. monthly household expenses)
> 2021 median household income: $72,205 – 17th highest
> 2021 poverty rate: 12.1% – 25th highest
> Sept. 2022 unemployment: 4.5%
38. North Carolina
> Adults who find inflation very stressful: 42.0% (3,070,080 total)
> Adults who find inflation moderately stressful: 26.5% – 21st lowest (1,941,246 total)
> Price inflation from Jan. 2021 to July 2022: +13.9% (+$651 in avg. monthly household expenses)
> 2021 median household income: $61,972 – 12th lowest
> 2021 poverty rate: 13.4% – 15th highest
> Sept. 2022 unemployment: 3.6%
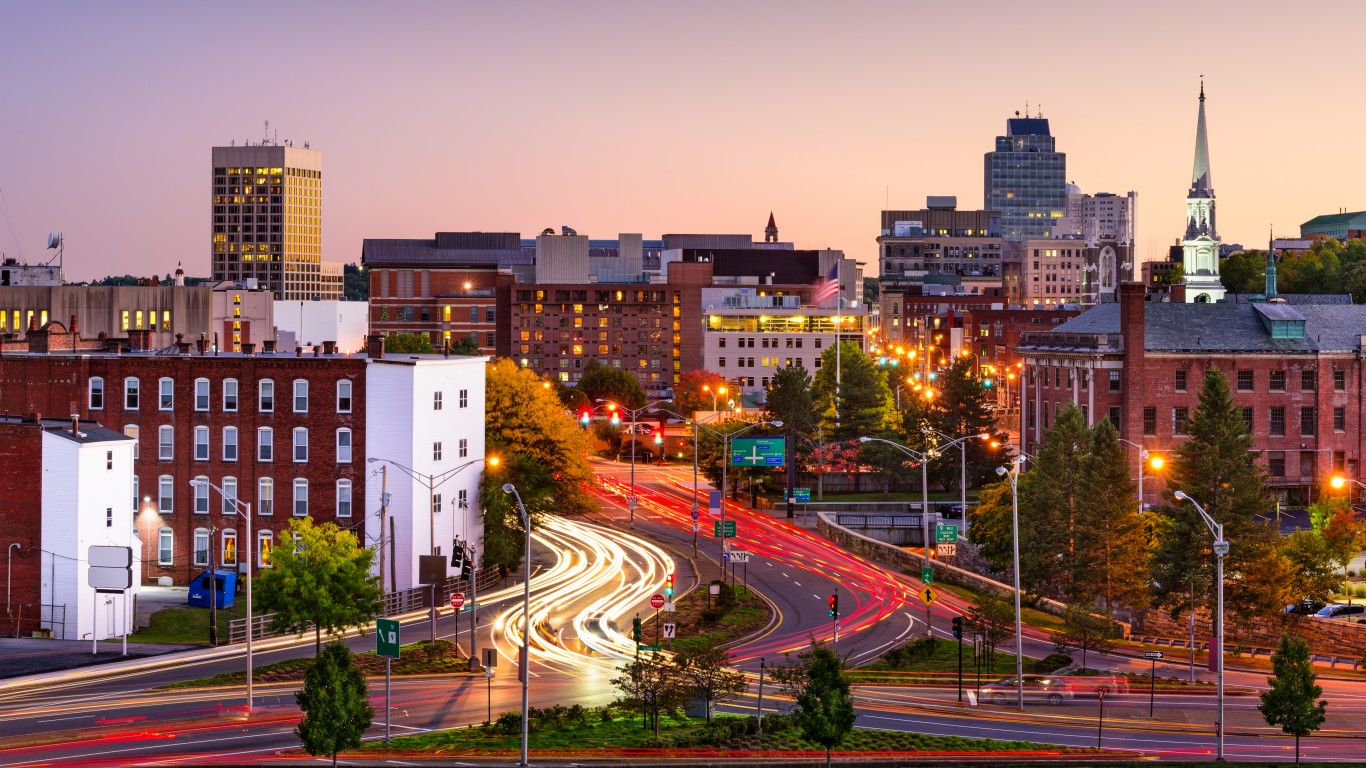
37. Massachusetts
> Adults who find inflation very stressful: 42.6% (1,913,695 total)
> Adults who find inflation moderately stressful: 29.7% – 15th highest (1,336,686 total)
> Price inflation from Jan. 2021 to July 2022: +10.7% (+$726 in avg. monthly household expenses)
> 2021 median household income: $89,645 – 2nd highest
> 2021 poverty rate: 10.4% – 11th lowest
> Sept. 2022 unemployment: 3.4%
[in-text-ad-2]
36. Colorado
> Adults who find inflation very stressful: 42.6% (1,719,763 total)
> Adults who find inflation moderately stressful: 29.9% – 14th highest (1,206,248 total)
> Price inflation from Jan. 2021 to July 2022: +15.4% (+$937 in avg. monthly household expenses)
> 2021 median household income: $82,254 – 9th highest
> 2021 poverty rate: 9.7% – 4th lowest
> Sept. 2022 unemployment: 3.4%

35. Missouri
> Adults who find inflation very stressful: 42.8% (1,771,600 total)
> Adults who find inflation moderately stressful: 26.1% – 13th lowest (1,078,972 total)
> Price inflation from Jan. 2021 to July 2022: +13.8% (+$737 in avg. monthly household expenses)
> 2021 median household income: $61,847 – 11th lowest
> 2021 poverty rate: 12.7% – 20th highest
> Sept. 2022 unemployment: 2.4%
[in-text-ad]

34. Michigan
> Adults who find inflation very stressful: 43.1% (2,930,577 total)
> Adults who find inflation moderately stressful: 28.5% – 23rd highest (1,938,415 total)
> Price inflation from Jan. 2021 to July 2022: +14.1% (+$710 in avg. monthly household expenses)
> 2021 median household income: $63,498 – 17th lowest
> 2021 poverty rate: 13.1% – 18th highest
> Sept. 2022 unemployment: 4.1%
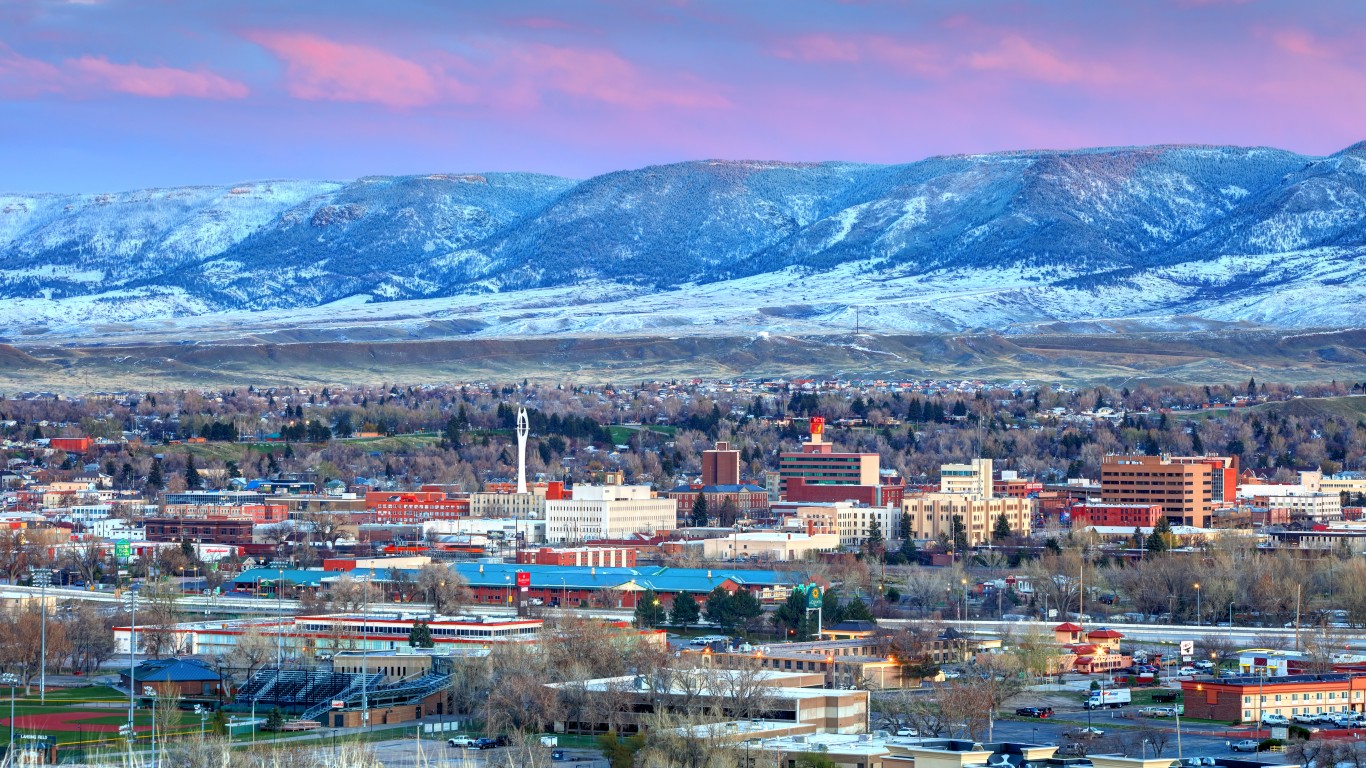
33. Wyoming
> Adults who find inflation very stressful: 43.3% (168,358 total)
> Adults who find inflation moderately stressful: 36.4% – the highest (141,366 total)
> Price inflation from Jan. 2021 to July 2022: +15.4% (+$812 in avg. monthly household expenses)
> 2021 median household income: $65,204 – 20th lowest
> 2021 poverty rate: 11.4% – 19th lowest
> Sept. 2022 unemployment: 3.3%
32. Rhode Island
> Adults who find inflation very stressful: 43.4% (319,524 total)
> Adults who find inflation moderately stressful: 25.9% – 11th lowest (190,710 total)
> Price inflation from Jan. 2021 to July 2022: +10.7% (+$592 in avg. monthly household expenses)
> 2021 median household income: $74,008 – 15th highest
> 2021 poverty rate: 11.4% – 20th lowest
> Sept. 2022 unemployment: 3.1%
[in-text-ad-2]

31. Oregon
> Adults who find inflation very stressful: 43.9% (1,347,402 total)
> Adults who find inflation moderately stressful: 30.0% – 11th highest (921,459 total)
> Price inflation from Jan. 2021 to July 2022: +12.5% (+$604 in avg. monthly household expenses)
> 2021 median household income: $71,562 – 18th highest
> 2021 poverty rate: 12.2% – 23rd highest
> Sept. 2022 unemployment: 3.8%
30. South Carolina
> Adults who find inflation very stressful: 44.7% (1,653,308 total)
> Adults who find inflation moderately stressful: 31.9% – 7th highest (1,179,640 total)
> Price inflation from Jan. 2021 to July 2022: +13.9% (+$633 in avg. monthly household expenses)
> 2021 median household income: $59,318 – 9th lowest
> 2021 poverty rate: 14.6% – 9th highest
> Sept. 2022 unemployment: 3.2%
[in-text-ad]
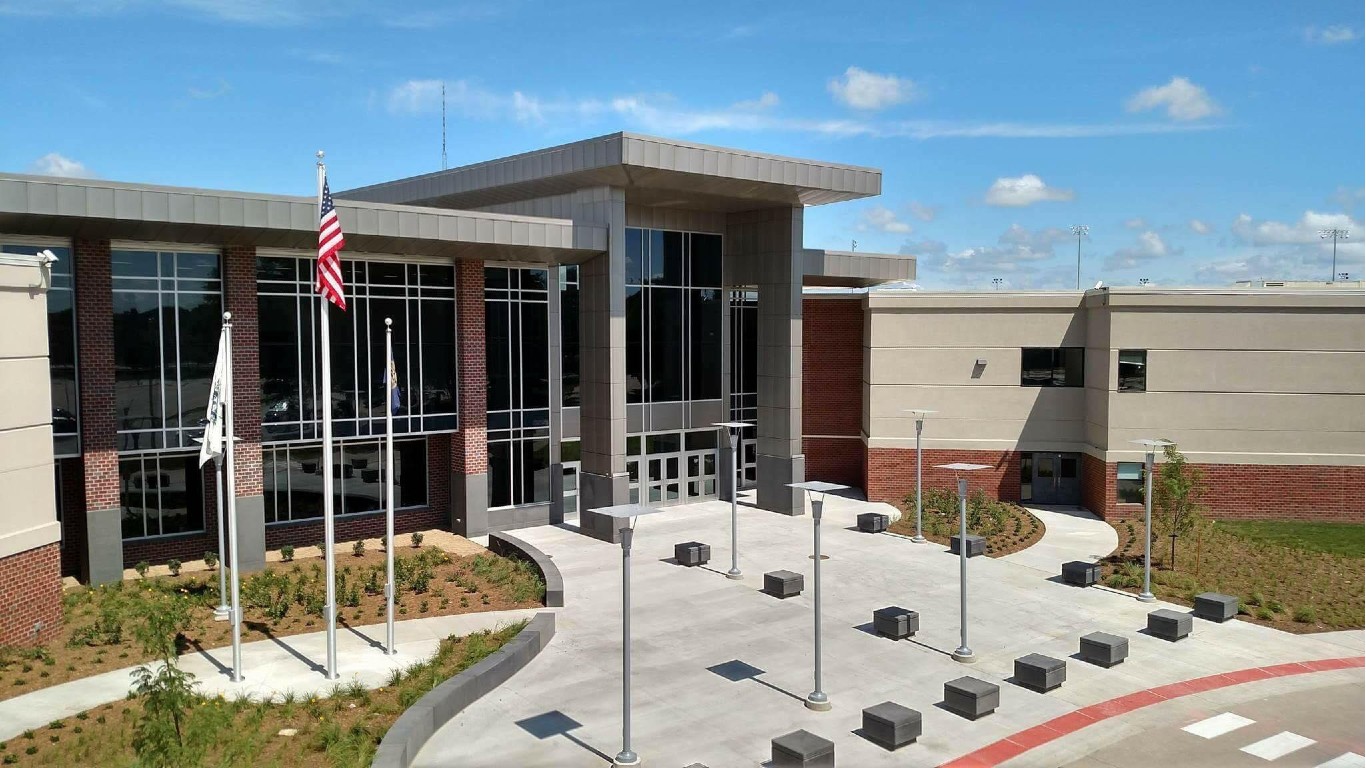
29. Nebraska
> Adults who find inflation very stressful: 44.8% (564,609 total)
> Adults who find inflation moderately stressful: 31.3% – 9th highest (394,054 total)
> Price inflation from Jan. 2021 to July 2022: +13.8% (+$754 in avg. monthly household expenses)
> 2021 median household income: $66,817 – 24th highest
> 2021 poverty rate: 10.8% – 13th lowest
> Sept. 2022 unemployment: 2.2%

28. Pennsylvania
> Adults who find inflation very stressful: 44.9% (3,899,782 total)
> Adults who find inflation moderately stressful: 29.7% – 17th highest (2,578,922 total)
> Price inflation from Jan. 2021 to July 2022: +11.2% (+$585 in avg. monthly household expenses)
> 2021 median household income: $68,957 – 21st highest
> 2021 poverty rate: 12.1% – 25th lowest
> Sept. 2022 unemployment: 4.1%
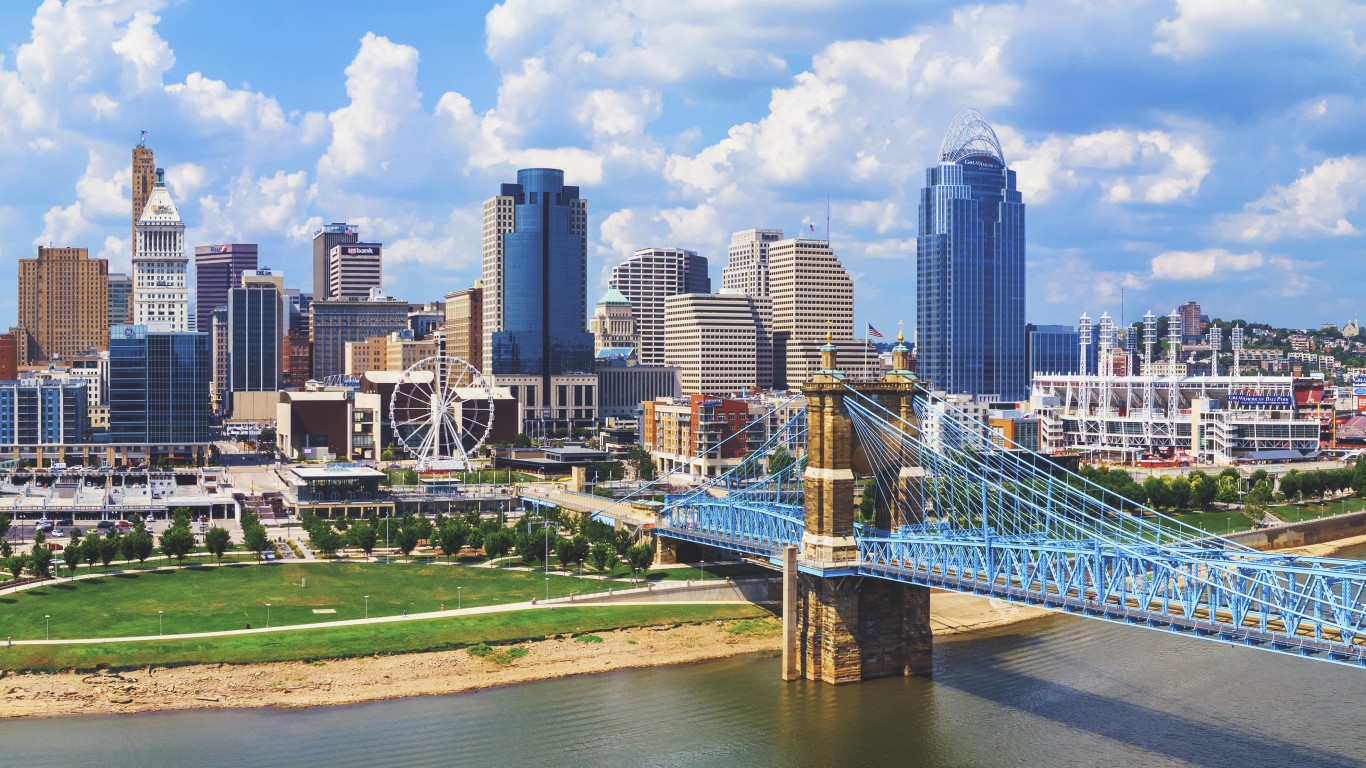
27. Ohio
> Adults who find inflation very stressful: 45.8% (3,511,038 total)
> Adults who find inflation moderately stressful: 28.5% – 22nd highest (2,186,216 total)
> Price inflation from Jan. 2021 to July 2022: +14.1% (+$677 in avg. monthly household expenses)
> 2021 median household income: $62,262 – 13th lowest
> 2021 poverty rate: 13.4% – 16th highest
> Sept. 2022 unemployment: 4.0%
[in-text-ad-2]
26. New Jersey
> Adults who find inflation very stressful: 46.5% (2,877,642 total)
> Adults who find inflation moderately stressful: 26.1% – 14th lowest (1,615,840 total)
> Price inflation from Jan. 2021 to July 2022: +11.2% (+$695 in avg. monthly household expenses)
> 2021 median household income: $89,296 – 3rd highest
> 2021 poverty rate: 10.2% – 8th lowest
> Sept. 2022 unemployment: 3.3%
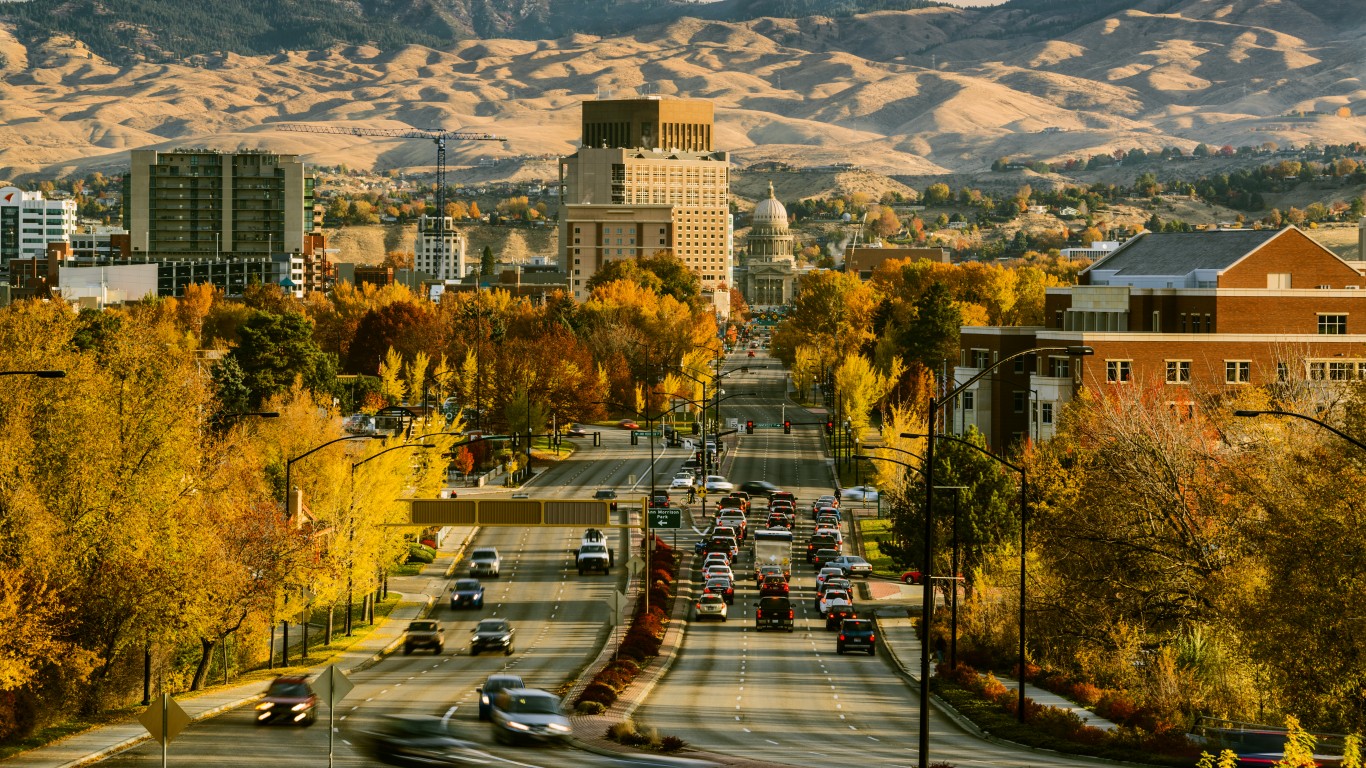
25. Idaho
> Adults who find inflation very stressful: 46.6% (611,292 total)
> Adults who find inflation moderately stressful: 28.0% – 24th lowest (367,599 total)
> Price inflation from Jan. 2021 to July 2022: +15.4% (+$763 in avg. monthly household expenses)
> 2021 median household income: $66,474 – 24th lowest
> 2021 poverty rate: 11.0% – 15th lowest
> Sept. 2022 unemployment: 2.8%
[in-text-ad]

24. Maine
> Adults who find inflation very stressful: 46.6% (465,937 total)
> Adults who find inflation moderately stressful: 26.3% – 15th lowest (262,616 total)
> Price inflation from Jan. 2021 to July 2022: +10.7% (+$556 in avg. monthly household expenses)
> 2021 median household income: $64,767 – 19th lowest
> 2021 poverty rate: 11.5% – 21st lowest
> Sept. 2022 unemployment: 3.3%
23. Kansas
> Adults who find inflation very stressful: 46.8% (913,767 total)
> Adults who find inflation moderately stressful: 28.1% – 25th lowest (547,795 total)
> Price inflation from Jan. 2021 to July 2022: +13.8% (+$730 in avg. monthly household expenses)
> 2021 median household income: $64,124 – 18th lowest
> 2021 poverty rate: 11.7% – 23rd lowest
> Sept. 2022 unemployment: 2.6%
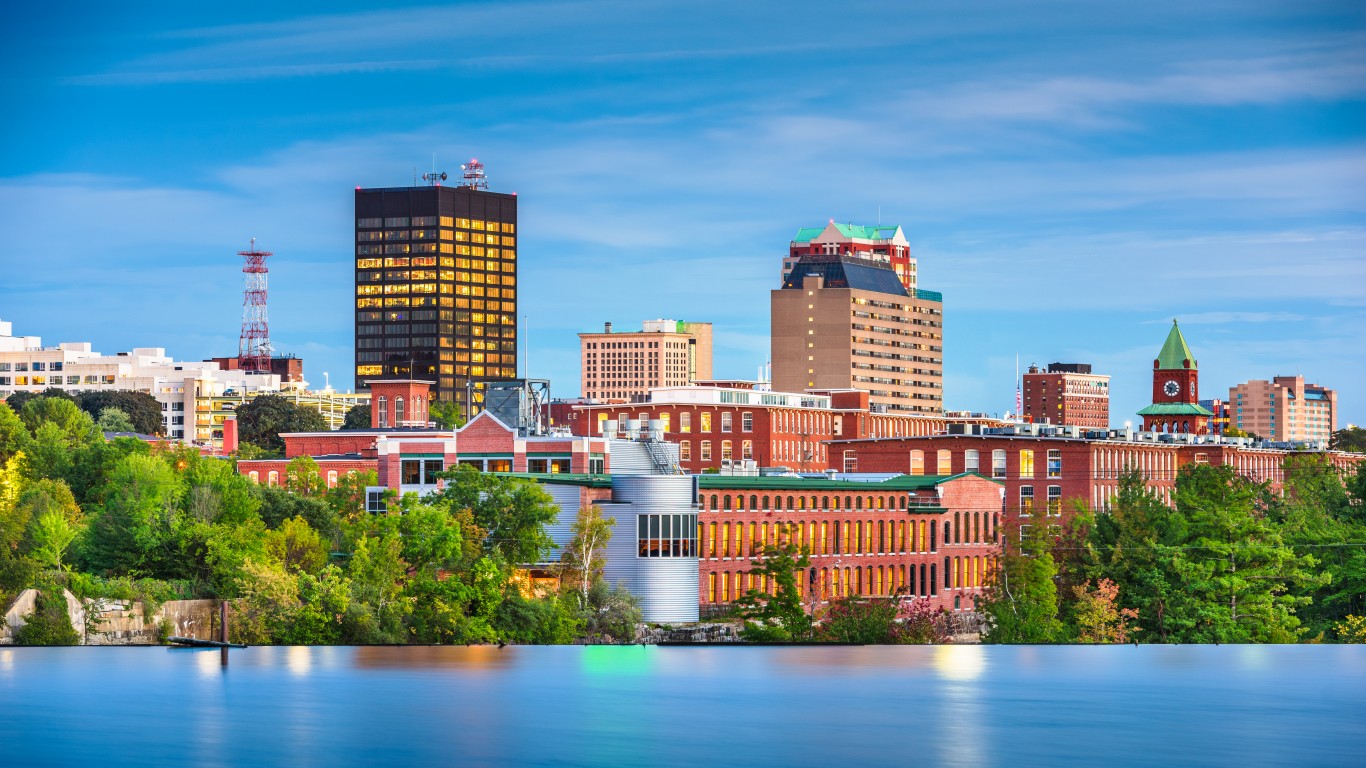
22. New Hampshire
> Adults who find inflation very stressful: 47.1% (467,052 total)
> Adults who find inflation moderately stressful: 26.3% – 17th lowest (260,916 total)
> Price inflation from Jan. 2021 to July 2022: +10.7% (+$686 in avg. monthly household expenses)
> 2021 median household income: $88,465 – 4th highest
> 2021 poverty rate: 7.2% – the lowest
> Sept. 2022 unemployment: 2.2%
[in-text-ad-2]
21. Delaware
> Adults who find inflation very stressful: 47.2% (329,682 total)
> Adults who find inflation moderately stressful: 26.5% – 20th lowest (185,103 total)
> Price inflation from Jan. 2021 to July 2022: +13.9% (+$760 in avg. monthly household expenses)
> 2021 median household income: $71,091 – 19th highest
> 2021 poverty rate: 11.6% – 22nd lowest
> Sept. 2022 unemployment: 4.3%

20. Virginia
> Adults who find inflation very stressful: 47.5% (2,630,151 total)
> Adults who find inflation moderately stressful: 25.9% – 12th lowest (1,436,022 total)
> Price inflation from Jan. 2021 to July 2022: +13.9% (+$741 in avg. monthly household expenses)
> 2021 median household income: $80,963 – 10th highest
> 2021 poverty rate: 10.2% – 7th lowest
> Sept. 2022 unemployment: 2.6%
[in-text-ad]
19. Arizona
> Adults who find inflation very stressful: 47.9% (2,433,145 total)
> Adults who find inflation moderately stressful: 25.4% – 9th lowest (1,290,054 total)
> Price inflation from Jan. 2021 to July 2022: +15.4% (+$833 in avg. monthly household expenses)
> 2021 median household income: $69,056 – 20th highest
> 2021 poverty rate: 12.8% – 19th highest
> Sept. 2022 unemployment: 3.7%
18. New York
> Adults who find inflation very stressful: 48.1% (6,198,854 total)
> Adults who find inflation moderately stressful: 26.5% – 19th lowest (3,407,446 total)
> Price inflation from Jan. 2021 to July 2022: +11.2% (+$683 in avg. monthly household expenses)
> 2021 median household income: $74,314 – 14th highest
> 2021 poverty rate: 13.9% – 13th highest
> Sept. 2022 unemployment: 4.3%
17. Utah
> Adults who find inflation very stressful: 48.2% (1,028,282 total)
> Adults who find inflation moderately stressful: 29.9% – 13th highest (638,679 total)
> Price inflation from Jan. 2021 to July 2022: +15.4% (+$910 in avg. monthly household expenses)
> 2021 median household income: $79,449 – 11th highest
> 2021 poverty rate: 8.6% – 2nd lowest
> Sept. 2022 unemployment: 2.1%
[in-text-ad-2]
16. New Mexico
> Adults who find inflation very stressful: 49.1% (705,020 total)
> Adults who find inflation moderately stressful: 27.9% – 23rd lowest (401,123 total)
> Price inflation from Jan. 2021 to July 2022: +15.4% (+$720 in avg. monthly household expenses)
> 2021 median household income: $53,992 – 6th lowest
> 2021 poverty rate: 18.4% – 3rd highest
> Sept. 2022 unemployment: 4.2%

15. Indiana
> Adults who find inflation very stressful: 49.4% (2,223,319 total)
> Adults who find inflation moderately stressful: 26.4% – 18th lowest (1,187,161 total)
> Price inflation from Jan. 2021 to July 2022: +14.1% (+$686 in avg. monthly household expenses)
> 2021 median household income: $62,743 – 14th lowest
> 2021 poverty rate: 12.2% – 24th highest
> Sept. 2022 unemployment: 2.8%
[in-text-ad]

14. Georgia
> Adults who find inflation very stressful: 49.4% (3,556,846 total)
> Adults who find inflation moderately stressful: 28.3% – 24th highest (2,038,977 total)
> Price inflation from Jan. 2021 to July 2022: +13.9% (+$688 in avg. monthly household expenses)
> 2021 median household income: $66,559 – 25th highest
> 2021 poverty rate: 14.0% – 12th highest
> Sept. 2022 unemployment: 2.8%
13. California
> Adults who find inflation very stressful: 49.4% (13,068,543 total)
> Adults who find inflation moderately stressful: 26.3% – 16th lowest (6,949,021 total)
> Price inflation from Jan. 2021 to July 2022: +12.5% (+$794 in avg. monthly household expenses)
> 2021 median household income: $84,907 – 5th highest
> 2021 poverty rate: 12.3% – 21st highest
> Sept. 2022 unemployment: 3.9%
12. Hawaii
> Adults who find inflation very stressful: 49.6% (493,634 total)
> Adults who find inflation moderately stressful: 24.2% – 5th lowest (240,906 total)
> Price inflation from Jan. 2021 to July 2022: +12.5% (+$768 in avg. monthly household expenses)
> 2021 median household income: $84,857 – 6th highest
> 2021 poverty rate: 11.2% – 18th lowest
> Sept. 2022 unemployment: 3.5%
[in-text-ad-2]
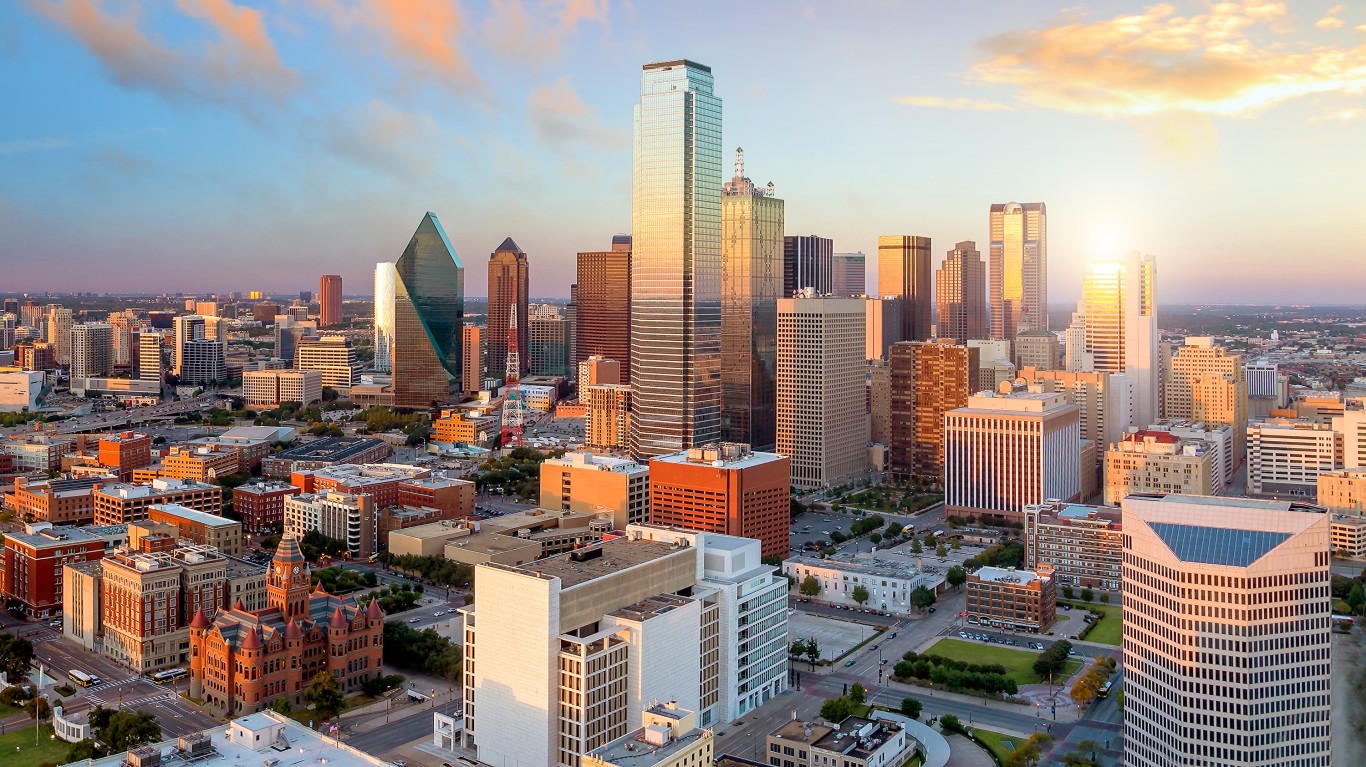
11. Texas
> Adults who find inflation very stressful: 50.1% (9,478,390 total)
> Adults who find inflation moderately stressful: 29.7% – 19th highest (5,618,075 total)
> Price inflation from Jan. 2021 to July 2022: +14.8% (+$747 in avg. monthly household expenses)
> 2021 median household income: $66,963 – 23rd highest
> 2021 poverty rate: 14.2% – 10th highest
> Sept. 2022 unemployment: 4.0%
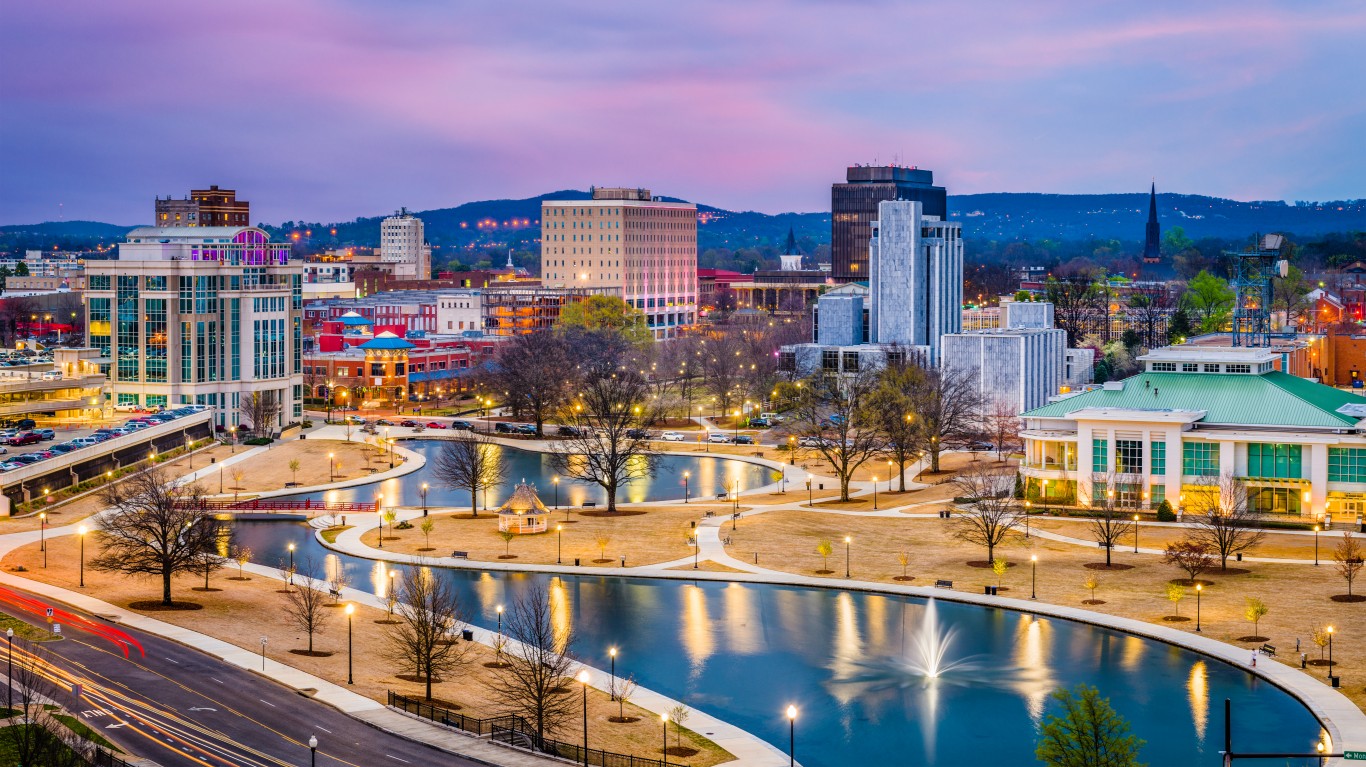
10. Alabama
> Adults who find inflation very stressful: 50.2% (1,643,990 total)
> Adults who find inflation moderately stressful: 29.4% – 20th highest (960,870 total)
> Price inflation from Jan. 2021 to July 2022: +13.4% (+$613 in avg. monthly household expenses)
> 2021 median household income: $53,913 – 5th lowest
> 2021 poverty rate: 16.1% – 7th highest
> Sept. 2022 unemployment: 2.6%
[in-text-ad]
9. Florida
> Adults who find inflation very stressful: 51.1% (7,863,983 total)
> Adults who find inflation moderately stressful: 23.2% – 2nd lowest (3,566,362 total)
> Price inflation from Jan. 2021 to July 2022: +13.9% (+$784 in avg. monthly household expenses)
> 2021 median household income: $63,062 – 15th lowest
> 2021 poverty rate: 13.1% – 17th highest
> Sept. 2022 unemployment: 2.5%
8. Louisiana
> Adults who find inflation very stressful: 52.4% (1,577,812 total)
> Adults who find inflation moderately stressful: 28.8% – 21st highest (867,554 total)
> Price inflation from Jan. 2021 to July 2022: +14.8% (+$641 in avg. monthly household expenses)
> 2021 median household income: $52,087 – 3rd lowest
> 2021 poverty rate: 19.6% – the highest
> Sept. 2022 unemployment: 3.4%
7. Nevada
> Adults who find inflation very stressful: 53.0% (1,167,146 total)
> Adults who find inflation moderately stressful: 25.4% – 10th lowest (560,630 total)
> Price inflation from Jan. 2021 to July 2022: +15.4% (+$831 in avg. monthly household expenses)
> 2021 median household income: $66,274 – 23rd lowest
> 2021 poverty rate: 14.1% – 11th highest
> Sept. 2022 unemployment: 4.4%
[in-text-ad-2]

6. Kentucky
> Adults who find inflation very stressful: 53.5% (1,592,580 total)
> Adults who find inflation moderately stressful: 27.1% – 22nd lowest (807,572 total)
> Price inflation from Jan. 2021 to July 2022: +13.4% (+$608 in avg. monthly household expenses)
> 2021 median household income: $55,573 – 7th lowest
> 2021 poverty rate: 16.5% – 5th highest
> Sept. 2022 unemployment: 3.8%
5. Mississippi
> Adults who find inflation very stressful: 54.5% (1,023,063 total)
> Adults who find inflation moderately stressful: 25.0% – 6th lowest (469,723 total)
> Price inflation from Jan. 2021 to July 2022: +13.4% (+$571 in avg. monthly household expenses)
> 2021 median household income: $48,716 – the lowest
> 2021 poverty rate: 19.4% – 2nd highest
> Sept. 2022 unemployment: 3.6%
[in-text-ad]

4. Tennessee
> Adults who find inflation very stressful: 54.8% (2,614,667 total)
> Adults who find inflation moderately stressful: 22.8% – the lowest (1,088,222 total)
> Price inflation from Jan. 2021 to July 2022: +13.4% (+$643 in avg. monthly household expenses)
> 2021 median household income: $59,695 – 10th lowest
> 2021 poverty rate: 13.6% – 14th highest
> Sept. 2022 unemployment: 3.4%

3. Oklahoma
> Adults who find inflation very stressful: 55.3% (1,478,183 total)
> Adults who find inflation moderately stressful: 25.4% – 8th lowest (677,584 total)
> Price inflation from Jan. 2021 to July 2022: +14.8% (+$593 in avg. monthly household expenses)
> 2021 median household income: $55,826 – 8th lowest
> 2021 poverty rate: 15.6% – 8th highest
> Sept. 2022 unemployment: 3.2%

2. West Virginia
> Adults who find inflation very stressful: 56.4% (710,536 total)
> Adults who find inflation moderately stressful: 23.6% – 3rd lowest (297,719 total)
> Price inflation from Jan. 2021 to July 2022: +13.9% (+$569 in avg. monthly household expenses)
> 2021 median household income: $51,248 – 2nd lowest
> 2021 poverty rate: 16.8% – 4th highest
> Sept. 2022 unemployment: 4.0%
[in-text-ad-2]
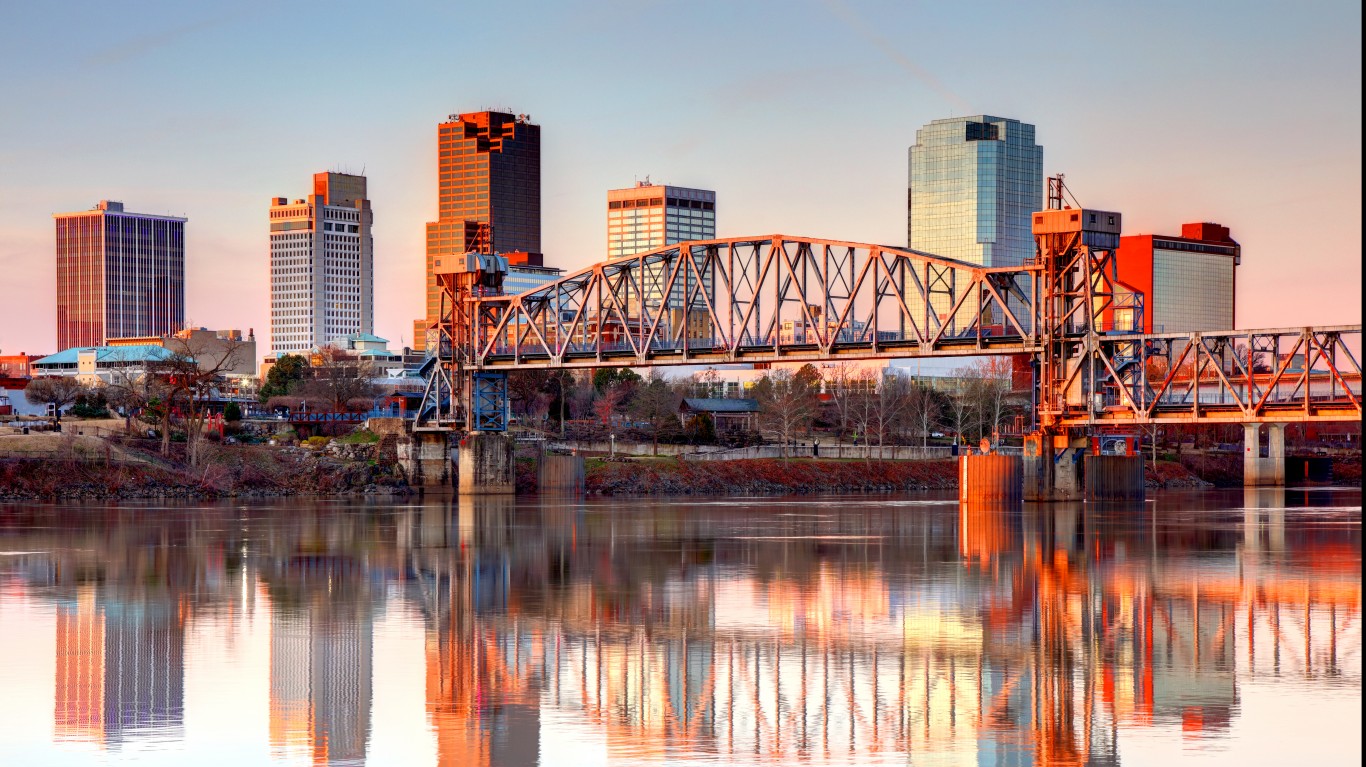
1. Arkansas
> Adults who find inflation very stressful: 57.9% (1,158,570 total)
> Adults who find inflation moderately stressful: 23.7% – 4th lowest (474,001 total)
> Price inflation from Jan. 2021 to July 2022: +14.8% (+$570 in avg. monthly household expenses)
> 2021 median household income: $52,528 – 4th lowest
> 2021 poverty rate: 16.3% – 6th highest
> Sept. 2022 unemployment: 3.5%
Methodology
To identify the states where inflation is causing the most stress, 24/7 Wall St. reviewed data from the U.S. Census Bureau’s latest Household Pulse Survey. States are ranked by the share of adults 18 and older who report finding the rising costs of goods and services to be “very stressful” in the past two months. We also considered the share of adults who find inflation to be “moderately stressful.” Survey data was collected between Oct. 5 and Oct. 17, 2022.
Supplemental data on state-level inflation rates from January 2021 to July 2022 is from the U.S. Congress Joint Economic Committee. Median household incomes and poverty rates are from the Census Bureau’s 2021 American Community Survey. Seasonally adjusted unemployment rates are from the Bureau of Labor Statistics and are current as of September 2022.
Finding a qualified financial advisor doesn’t have to be hard. SmartAsset’s free tool matches you with up to 3 fiduciary financial advisors in your area in 5 minutes. Each advisor has been vetted by SmartAsset and is held to a fiduciary standard to act in your best interests. If you’re ready to be matched with local advisors that can help you achieve your financial goals, get started now.
Thank you for reading! Have some feedback for us?
Contact the 24/7 Wall St. editorial team.