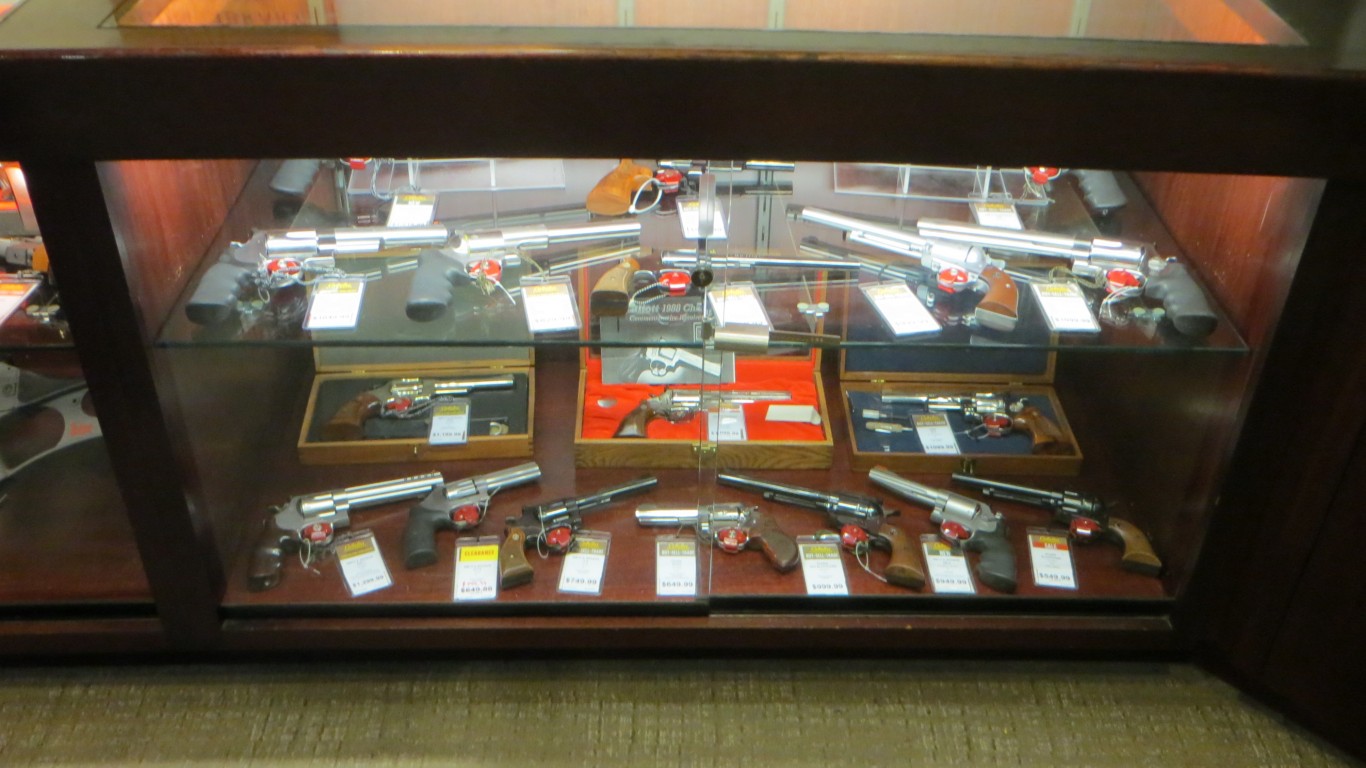
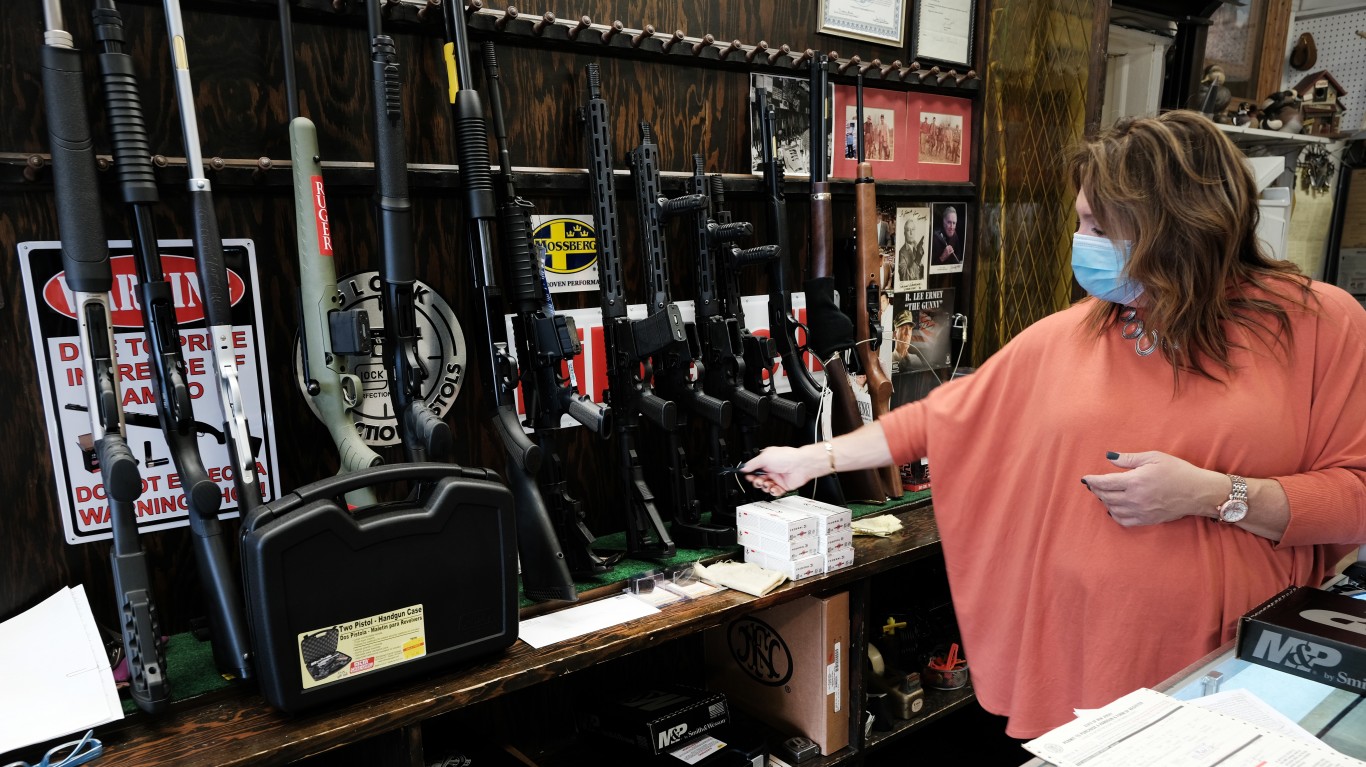
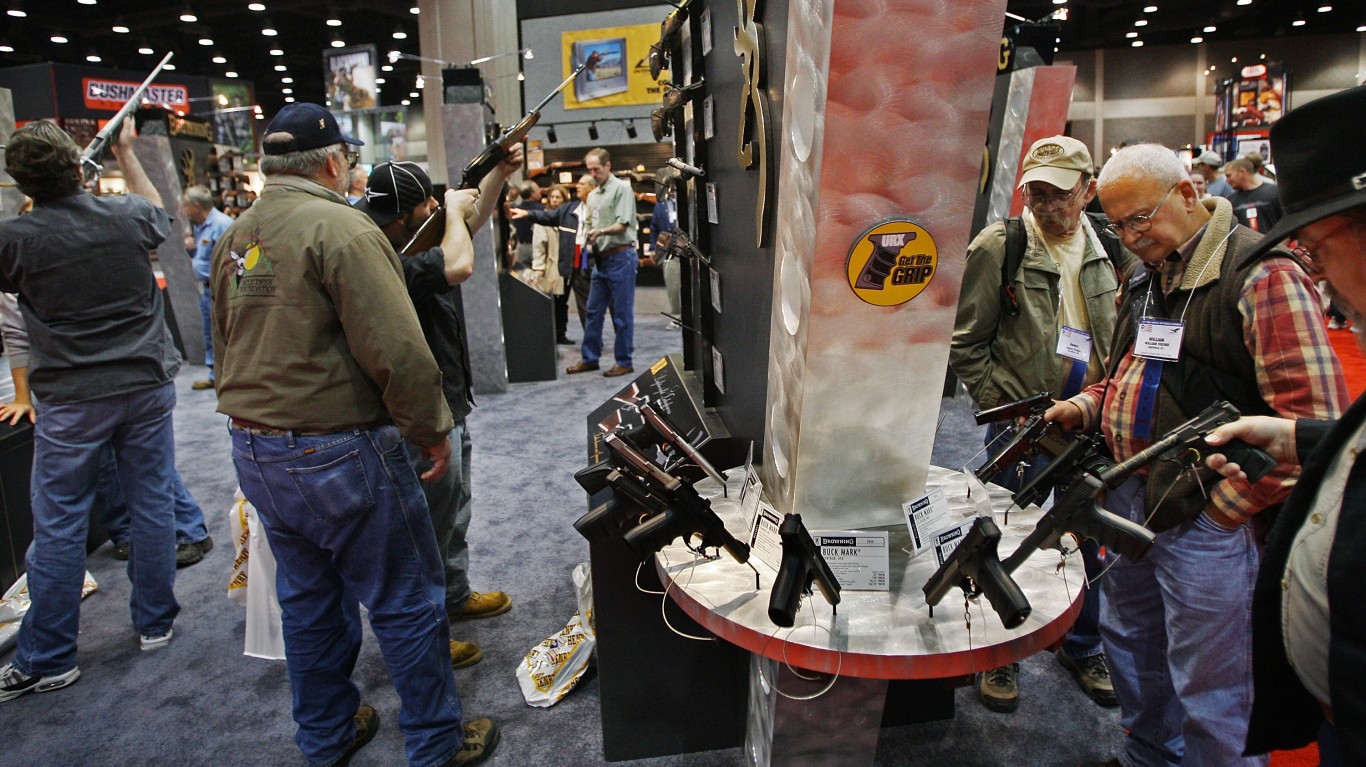
Gun sales in the U.S., as estimated by background checks, have surged at an extraordinary pace over the last two decades. Ever since background checks surpassed 10 million for the first time in 2006, they have jumped sharply, exploding early in 2020 as the COVID-19 pandemic hit, and reaching an all-time high of 39,695,315 that year. Firearm background checks are often used as a proxy for gun sales.
In the second half of 2021, background checks began to fall from 2020 levels, but only by a modest amount, to 38,876,673 for the entire year. In 2022, the sales drop was much more dramatic. Through the first nine months of this year, checks have fallen to 23,260,943, from 30,467,508 in the same period in 2021.
While the recent drop does not have a ready explanation, there could be several reasons for the decrease. Concerns about civil unrest may have eased along with worry about the effects of the COVID-19 pandemic.
Several statistics about guns in America stand out. The United States is widely considered the civilian gun capital of the world. By the same token, it has among the highest gun violence, ranking 10th in gun deaths per capita. (These are the countries with the most gun deaths per capita.)
There are about 400 million guns in circulation in the U.S., according to the Small Arms Survey, a Swiss-based research project. This means that for every person in America, there are about 120 guns — an astonishingly high figure. The comparable number in Finland, for example, is 32 guns per 100 people, and in Germany it is 20 guns per 100 people.
Along with the rise in gun sales, the level of gun deaths has been increasing as well. As of Oct. 6, according to the Gun Violence Archive, 34,010 people have been killed by guns in the U.S. There have been 519 mass shootings in 2022. This type of violence occurs daily. (These are the states where the most murders are committed with a gun.)
The amount of guns per capita varies from state to state as do gun purchases per person. Using FBI data from its National Instant Criminal Background Check System, 24/7 Wall St. ranked states based on gun background checks per 100,000 people in each state in the first nine months of the year. Population data came from the Census Bureau and is for 2021.
The figures show a wide disparity. There were only nine background checks per 100,000 residents in Hawaii through the first nine months of the year. In Kentucky, there were 668 checks per 100,000 people during that time.
Click here to see states where people buy the most guns.
50. Hawaii
> Firearm background checks per 1,000 residents, Jan-Sep 2022: 9.9
> Firearm background checks per 1,000 residents, Jan-Sep 2021: 9.1 (the fewest)
> Firearm background checks Jan-Sep 2022: 14,240 (the fewest)
> Firearm background checks Jan-Sep 2021: 13,107 (the fewest)
> Change in background checks, first nine months, year-to-date: +1,133 (+8.6% — 2nd largest increase)
> 2021Population: 1,441,553 (11th smallest)
[in-text-ad]
49. New Jersey
> Firearm background checks per 1,000 residents, Jan-Sep 2022: 13.5
> Firearm background checks per 1,000 residents, Jan-Sep 2021: 19.6 (3rd fewest)
> Firearm background checks Jan-Sep 2022: 125,049 (14th fewest)
> Firearm background checks Jan-Sep 2021: 181,478 (17th fewest)
> Change in background checks, first nine months, year-to-date: -56,429 (-31.1% — 3rd largest decrease)
> 2021Population: 9,267,130 (11th largest)

48. New York
> Firearm background checks per 1,000 residents, Jan-Sep 2022: 17.4
> Firearm background checks per 1,000 residents, Jan-Sep 2021: 17.7 (2nd fewest)
> Firearm background checks Jan-Sep 2022: 345,234 (22nd most)
> Firearm background checks Jan-Sep 2021: 351,254 (23rd most)
> Change in background checks, first nine months, year-to-date: -6,020 (-1.7% — 2nd smallest decrease)
> 2021Population: 19,835,913 (4th largest)

47. Rhode Island
> Firearm background checks per 1,000 residents, Jan-Sep 2022: 19.3
> Firearm background checks per 1,000 residents, Jan-Sep 2021: 27.4 (4th fewest)
> Firearm background checks Jan-Sep 2022: 21,154 (2nd fewest)
> Firearm background checks Jan-Sep 2021: 30,020 (2nd fewest)
> Change in background checks, first nine months, year-to-date: -8,866 (-29.5% — 5th largest decrease)
> 2021Population: 1,095,610 (7th smallest)
[in-text-ad-2]
46. Massachusetts
> Firearm background checks per 1,000 residents, Jan-Sep 2022: 24.4
> Firearm background checks per 1,000 residents, Jan-Sep 2021: 29.1 (6th fewest)
> Firearm background checks Jan-Sep 2022: 170,173 (20th fewest)
> Firearm background checks Jan-Sep 2021: 203,042 (18th fewest)
> Change in background checks, first nine months, year-to-date: -32,869 (-16.2% — 23rd smallest decrease)
> 2021Population: 6,984,723 (15th largest)
45. California
> Firearm background checks per 1,000 residents, Jan-Sep 2022: 27.5
> Firearm background checks per 1,000 residents, Jan-Sep 2021: 28.6 (5th fewest)
> Firearm background checks Jan-Sep 2022: 1,077,529 (5th most)
> Firearm background checks Jan-Sep 2021: 1,123,955 (6th most)
> Change in background checks, first nine months, year-to-date: -46,426 (-4.1% — 3rd smallest decrease)
> 2021Population: 39,237,836 (the largest)
[in-text-ad]

44. Nebraska
> Firearm background checks per 1,000 residents, Jan-Sep 2022: 27.7
> Firearm background checks per 1,000 residents, Jan-Sep 2021: 34.9 (8th fewest)
> Firearm background checks Jan-Sep 2022: 54,297 (7th fewest)
> Firearm background checks Jan-Sep 2021: 68,593 (7th fewest)
> Change in background checks, first nine months, year-to-date: -14,296 (-20.8% — 13th largest decrease)
> 2021Population: 1,963,692 (14th smallest)
43. Maryland
> Firearm background checks per 1,000 residents, Jan-Sep 2022: 33.5
> Firearm background checks per 1,000 residents, Jan-Sep 2021: 33.6 (7th fewest)
> Firearm background checks Jan-Sep 2022: 206,381 (24th fewest)
> Firearm background checks Jan-Sep 2021: 206,959 (20th fewest)
> Change in background checks, first nine months, year-to-date: -578 (-0.3% — the smallest decrease)
> 2021Population: 6,165,129 (19th largest)
42. Nevada
> Firearm background checks per 1,000 residents, Jan-Sep 2022: 36.9
> Firearm background checks per 1,000 residents, Jan-Sep 2021: 46.6 (9th fewest)
> Firearm background checks Jan-Sep 2022: 115,944 (13th fewest)
> Firearm background checks Jan-Sep 2021: 146,628 (13th fewest)
> Change in background checks, first nine months, year-to-date: -30,684 (-20.9% — 12th largest decrease)
> 2021Population: 3,143,991 (19th smallest)
[in-text-ad-2]

41. Georgia
> Firearm background checks per 1,000 residents, Jan-Sep 2022: 40.2
> Firearm background checks per 1,000 residents, Jan-Sep 2021: 58.1 (15th fewest)
> Firearm background checks Jan-Sep 2022: 434,178 (17th most)
> Firearm background checks Jan-Sep 2021: 627,128 (14th most)
> Change in background checks, first nine months, year-to-date: -192,950 (-30.8% — 4th largest decrease)
> 2021Population: 10,799,566 (8th largest)

40. Ohio
> Firearm background checks per 1,000 residents, Jan-Sep 2022: 40.8
> Firearm background checks per 1,000 residents, Jan-Sep 2021: 54.7 (12th fewest)
> Firearm background checks Jan-Sep 2022: 480,585 (14th most)
> Firearm background checks Jan-Sep 2021: 644,917 (13th most)
> Change in background checks, first nine months, year-to-date: -164,332 (-25.5% — 6th largest decrease)
> 2021Population: 11,780,017 (7th largest)
[in-text-ad]
39. Texas
> Firearm background checks per 1,000 residents, Jan-Sep 2022: 42.9
> Firearm background checks per 1,000 residents, Jan-Sep 2021: 50.7 (10th fewest)
> Firearm background checks Jan-Sep 2022: 1,268,071 (3rd most)
> Firearm background checks Jan-Sep 2021: 1,496,999 (3rd most)
> Change in background checks, first nine months, year-to-date: -228,928 (-15.3% — 16th smallest decrease)
> 2021Population: 29,527,941 (2nd largest)

38. North Carolina
> Firearm background checks per 1,000 residents, Jan-Sep 2022: 43.1
> Firearm background checks per 1,000 residents, Jan-Sep 2021: 57.2 (14th fewest)
> Firearm background checks Jan-Sep 2022: 454,493 (16th most)
> Firearm background checks Jan-Sep 2021: 603,914 (15th most)
> Change in background checks, first nine months, year-to-date: -149,421 (-24.7% — 7th largest decrease)
> 2021Population: 10,551,162 (9th largest)
37. Delaware
> Firearm background checks per 1,000 residents, Jan-Sep 2022: 45.3
> Firearm background checks per 1,000 residents, Jan-Sep 2021: 52.2 (11th fewest)
> Firearm background checks Jan-Sep 2022: 45,450 (4th fewest)
> Firearm background checks Jan-Sep 2021: 52,352 (4th fewest)
> Change in background checks, first nine months, year-to-date: -6,902 (-13.2% — 9th smallest decrease)
> 2021Population: 1,003,384 (6th smallest)
[in-text-ad-2]
36. Kansas
> Firearm background checks per 1,000 residents, Jan-Sep 2022: 47.0
> Firearm background checks per 1,000 residents, Jan-Sep 2021: 58.1 (16th fewest)
> Firearm background checks Jan-Sep 2022: 137,858 (17th fewest)
> Firearm background checks Jan-Sep 2021: 170,476 (16th fewest)
> Change in background checks, first nine months, year-to-date: -32,618 (-19.1% — 16th largest decrease)
> 2021Population: 2,934,582 (16th smallest)
35. Virginia
> Firearm background checks per 1,000 residents, Jan-Sep 2022: 47.3
> Firearm background checks per 1,000 residents, Jan-Sep 2021: 56.5 (13th fewest)
> Firearm background checks Jan-Sep 2022: 408,792 (18th most)
> Firearm background checks Jan-Sep 2021: 488,208 (18th most)
> Change in background checks, first nine months, year-to-date: -79,416 (-16.3% — 24th largest decrease)
> 2021Population: 8,642,274 (12th largest)
[in-text-ad]
34. Connecticut
> Firearm background checks per 1,000 residents, Jan-Sep 2022: 49.7
> Firearm background checks per 1,000 residents, Jan-Sep 2021: 59.9 (18th fewest)
> Firearm background checks Jan-Sep 2022: 179,308 (22nd fewest)
> Firearm background checks Jan-Sep 2021: 216,146 (23rd fewest)
> Change in background checks, first nine months, year-to-date: -36,838 (-17.0% — 22nd largest decrease)
> 2021Population: 3,605,597 (22nd smallest)

33. Florida
> Firearm background checks per 1,000 residents, Jan-Sep 2022: 50.4
> Firearm background checks per 1,000 residents, Jan-Sep 2021: 59.9 (17th fewest)
> Firearm background checks Jan-Sep 2022: 1,097,772 (4th most)
> Firearm background checks Jan-Sep 2021: 1,305,111 (5th most)
> Change in background checks, first nine months, year-to-date: -207,339 (-15.9% — 20th smallest decrease)
> 2021Population: 21,781,128 (3rd largest)

32. Vermont
> Firearm background checks per 1,000 residents, Jan-Sep 2022: 50.8
> Firearm background checks per 1,000 residents, Jan-Sep 2021: 60.4 (20th fewest)
> Firearm background checks Jan-Sep 2022: 32,763 (3rd fewest)
> Firearm background checks Jan-Sep 2021: 38,983 (3rd fewest)
> Change in background checks, first nine months, year-to-date: -6,220 (-16.0% — 22nd smallest decrease)
> 2021Population: 645,570 (2nd smallest)
[in-text-ad-2]
31. Iowa
> Firearm background checks per 1,000 residents, Jan-Sep 2022: 53.2
> Firearm background checks per 1,000 residents, Jan-Sep 2021: 65.5 (22nd fewest)
> Firearm background checks Jan-Sep 2022: 170,024 (19th fewest)
> Firearm background checks Jan-Sep 2021: 209,181 (21st fewest)
> Change in background checks, first nine months, year-to-date: -39,157 (-18.7% — 17th largest decrease)
> 2021Population: 3,193,079 (20th smallest)
30. Louisiana
> Firearm background checks per 1,000 residents, Jan-Sep 2022: 53.8
> Firearm background checks per 1,000 residents, Jan-Sep 2021: 63.6 (21st fewest)
> Firearm background checks Jan-Sep 2022: 248,715 (25th fewest)
> Firearm background checks Jan-Sep 2021: 294,273 (25th fewest)
> Change in background checks, first nine months, year-to-date: -45,558 (-15.5% — 19th smallest decrease)
> 2021Population: 4,624,047 (25th largest)
[in-text-ad]
29. Arizona
> Firearm background checks per 1,000 residents, Jan-Sep 2022: 55.0
> Firearm background checks per 1,000 residents, Jan-Sep 2021: 60.2 (19th fewest)
> Firearm background checks Jan-Sep 2022: 400,279 (19th most)
> Firearm background checks Jan-Sep 2021: 438,322 (21st most)
> Change in background checks, first nine months, year-to-date: -38,043 (-8.7% — 6th smallest decrease)
> 2021Population: 7,276,316 (14th largest)
28. Arkansas
> Firearm background checks per 1,000 residents, Jan-Sep 2022: 55.2
> Firearm background checks per 1,000 residents, Jan-Sep 2021: 70.8 (25th fewest)
> Firearm background checks Jan-Sep 2022: 167,144 (18th fewest)
> Firearm background checks Jan-Sep 2021: 214,197 (22nd fewest)
> Change in background checks, first nine months, year-to-date: -47,053 (-22.0% — 9th largest decrease)
> 2021Population: 3,025,891 (18th smallest)

27. Michigan
> Firearm background checks per 1,000 residents, Jan-Sep 2022: 58.3
> Firearm background checks per 1,000 residents, Jan-Sep 2021: 74.5 (23rd most)
> Firearm background checks Jan-Sep 2022: 585,567 (11th most)
> Firearm background checks Jan-Sep 2021: 748,584 (9th most)
> Change in background checks, first nine months, year-to-date: -163,017 (-21.8% — 10th largest decrease)
> 2021Population: 10,050,811 (10th largest)
[in-text-ad-2]

26. South Carolina
> Firearm background checks per 1,000 residents, Jan-Sep 2022: 59.2
> Firearm background checks per 1,000 residents, Jan-Sep 2021: 71.4 (24th most)
> Firearm background checks Jan-Sep 2022: 307,098 (23rd most)
> Firearm background checks Jan-Sep 2021: 370,614 (22nd most)
> Change in background checks, first nine months, year-to-date: -63,516 (-17.1% — 21st largest decrease)
> 2021Population: 5,190,705 (23rd largest)

25. Maine
> Firearm background checks per 1,000 residents, Jan-Sep 2022: 59.7
> Firearm background checks per 1,000 residents, Jan-Sep 2021: 69.0 (23rd fewest)
> Firearm background checks Jan-Sep 2022: 81,896 (10th fewest)
> Firearm background checks Jan-Sep 2021: 94,671 (10th fewest)
> Change in background checks, first nine months, year-to-date: -12,775 (-13.5% — 11th smallest decrease)
> 2021Population: 1,372,247 (9th smallest)
[in-text-ad]

24. New Mexico
> Firearm background checks per 1,000 residents, Jan-Sep 2022: 60.6
> Firearm background checks per 1,000 residents, Jan-Sep 2021: 70.2 (24th fewest)
> Firearm background checks Jan-Sep 2022: 128,257 (15th fewest)
> Firearm background checks Jan-Sep 2021: 148,540 (14th fewest)
> Change in background checks, first nine months, year-to-date: -20,283 (-13.7% — 12th smallest decrease)
> 2021Population: 2,115,877 (15th smallest)
23. Missouri
> Firearm background checks per 1,000 residents, Jan-Sep 2022: 61.7
> Firearm background checks per 1,000 residents, Jan-Sep 2021: 76.7 (22nd most)
> Firearm background checks Jan-Sep 2022: 380,716 (21st most)
> Firearm background checks Jan-Sep 2021: 473,180 (20th most)
> Change in background checks, first nine months, year-to-date: -92,464 (-19.5% — 15th largest decrease)
> 2021Population: 6,168,187 (18th largest)
22. Oklahoma
> Firearm background checks per 1,000 residents, Jan-Sep 2022: 66.5
> Firearm background checks per 1,000 residents, Jan-Sep 2021: 76.7 (21st most)
> Firearm background checks Jan-Sep 2022: 265,190 (25th most)
> Firearm background checks Jan-Sep 2021: 305,898 (25th most)
> Change in background checks, first nine months, year-to-date: -40,708 (-13.3% — 10th smallest decrease)
> 2021Population: 3,986,639 (23rd smallest)
[in-text-ad-2]
21. Mississippi
> Firearm background checks per 1,000 residents, Jan-Sep 2022: 67.8
> Firearm background checks per 1,000 residents, Jan-Sep 2021: 79.2 (19th most)
> Firearm background checks Jan-Sep 2022: 199,995 (23rd fewest)
> Firearm background checks Jan-Sep 2021: 233,742 (24th fewest)
> Change in background checks, first nine months, year-to-date: -33,747 (-14.4% — 13th smallest decrease)
> 2021Population: 2,949,965 (17th smallest)

20. Colorado
> Firearm background checks per 1,000 residents, Jan-Sep 2022: 67.9
> Firearm background checks per 1,000 residents, Jan-Sep 2021: 82.3 (17th most)
> Firearm background checks Jan-Sep 2022: 394,611 (20th most)
> Firearm background checks Jan-Sep 2021: 478,331 (19th most)
> Change in background checks, first nine months, year-to-date: -83,720 (-17.5% — 20th largest decrease)
> 2021Population: 5,812,069 (21st largest)
[in-text-ad]

19. North Dakota
> Firearm background checks per 1,000 residents, Jan-Sep 2022: 69.0
> Firearm background checks per 1,000 residents, Jan-Sep 2021: 77.9 (20th most)
> Firearm background checks Jan-Sep 2022: 53,433 (6th fewest)
> Firearm background checks Jan-Sep 2021: 60,362 (5th fewest)
> Change in background checks, first nine months, year-to-date: -6,929 (-11.5% — 7th smallest decrease)
> 2021Population: 774,948 (4th smallest)

18. Oregon
> Firearm background checks per 1,000 residents, Jan-Sep 2022: 69.0
> Firearm background checks per 1,000 residents, Jan-Sep 2021: 80.9 (18th most)
> Firearm background checks Jan-Sep 2022: 292,881 (24th most)
> Firearm background checks Jan-Sep 2021: 343,606 (24th most)
> Change in background checks, first nine months, year-to-date: -50,725 (-14.8% — 14th smallest decrease)
> 2021Population: 4,246,155 (24th smallest)

17. South Dakota
> Firearm background checks per 1,000 residents, Jan-Sep 2022: 69.8
> Firearm background checks per 1,000 residents, Jan-Sep 2021: 88.3 (14th most)
> Firearm background checks Jan-Sep 2022: 62,459 (8th fewest)
> Firearm background checks Jan-Sep 2021: 79,081 (9th fewest)
> Change in background checks, first nine months, year-to-date: -16,622 (-21.0% — 11th largest decrease)
> 2021Population: 895,376 (5th smallest)
[in-text-ad-2]
16. Pennsylvania
> Firearm background checks per 1,000 residents, Jan-Sep 2022: 69.9
> Firearm background checks per 1,000 residents, Jan-Sep 2021: 82.4 (16th most)
> Firearm background checks Jan-Sep 2022: 906,400 (6th most)
> Firearm background checks Jan-Sep 2021: 1,068,542 (7th most)
> Change in background checks, first nine months, year-to-date: -162,142 (-15.2% — 15th smallest decrease)
> 2021Population: 12,964,056 (5th largest)
15. New Hampshire
> Firearm background checks per 1,000 residents, Jan-Sep 2022: 70.5
> Firearm background checks per 1,000 residents, Jan-Sep 2021: 83.9 (15th most)
> Firearm background checks Jan-Sep 2022: 97,953 (11th fewest)
> Firearm background checks Jan-Sep 2021: 116,526 (11th fewest)
> Change in background checks, first nine months, year-to-date: -18,573 (-15.9% — 21st smallest decrease)
> 2021Population: 1,388,992 (10th smallest)
[in-text-ad]

14. Washington
> Firearm background checks per 1,000 residents, Jan-Sep 2022: 71.6
> Firearm background checks per 1,000 residents, Jan-Sep 2021: 71.1 (25th most)
> Firearm background checks Jan-Sep 2022: 553,775 (12th most)
> Firearm background checks Jan-Sep 2021: 550,260 (17th most)
> Change in background checks, first nine months, year-to-date: +3,515 (+0.6% — 3rd largest increase)
> 2021Population: 7,738,692 (13th largest)
13. West Virginia
> Firearm background checks per 1,000 residents, Jan-Sep 2022: 75.7
> Firearm background checks per 1,000 residents, Jan-Sep 2021: 91.9 (13th most)
> Firearm background checks Jan-Sep 2022: 135,008 (16th fewest)
> Firearm background checks Jan-Sep 2021: 163,937 (15th fewest)
> Change in background checks, first nine months, year-to-date: -28,929 (-17.6% — 19th largest decrease)
> 2021Population: 1,782,959 (12th smallest)
12. Wisconsin
> Firearm background checks per 1,000 residents, Jan-Sep 2022: 78.7
> Firearm background checks per 1,000 residents, Jan-Sep 2021: 99.2 (11th most)
> Firearm background checks Jan-Sep 2022: 463,965 (15th most)
> Firearm background checks Jan-Sep 2021: 584,957 (16th most)
> Change in background checks, first nine months, year-to-date: -120,992 (-20.7% — 14th largest decrease)
> 2021Population: 5,895,908 (20th largest)
[in-text-ad-2]
11. Alaska
> Firearm background checks per 1,000 residents, Jan-Sep 2022: 85.7
> Firearm background checks per 1,000 residents, Jan-Sep 2021: 93.7 (12th most)
> Firearm background checks Jan-Sep 2022: 62,799 (9th fewest)
> Firearm background checks Jan-Sep 2021: 68,653 (8th fewest)
> Change in background checks, first nine months, year-to-date: -5,854 (-8.5% — 5th smallest decrease)
> 2021Population: 732,673 (3rd smallest)
10. Tennessee
> Firearm background checks per 1,000 residents, Jan-Sep 2022: 87.9
> Firearm background checks per 1,000 residents, Jan-Sep 2021: 103.8 (10th most)
> Firearm background checks Jan-Sep 2022: 612,907 (10th most)
> Firearm background checks Jan-Sep 2021: 723,700 (10th most)
> Change in background checks, first nine months, year-to-date: -110,793 (-15.3% — 17th smallest decrease)
> 2021Population: 6,975,218 (16th largest)
[in-text-ad]
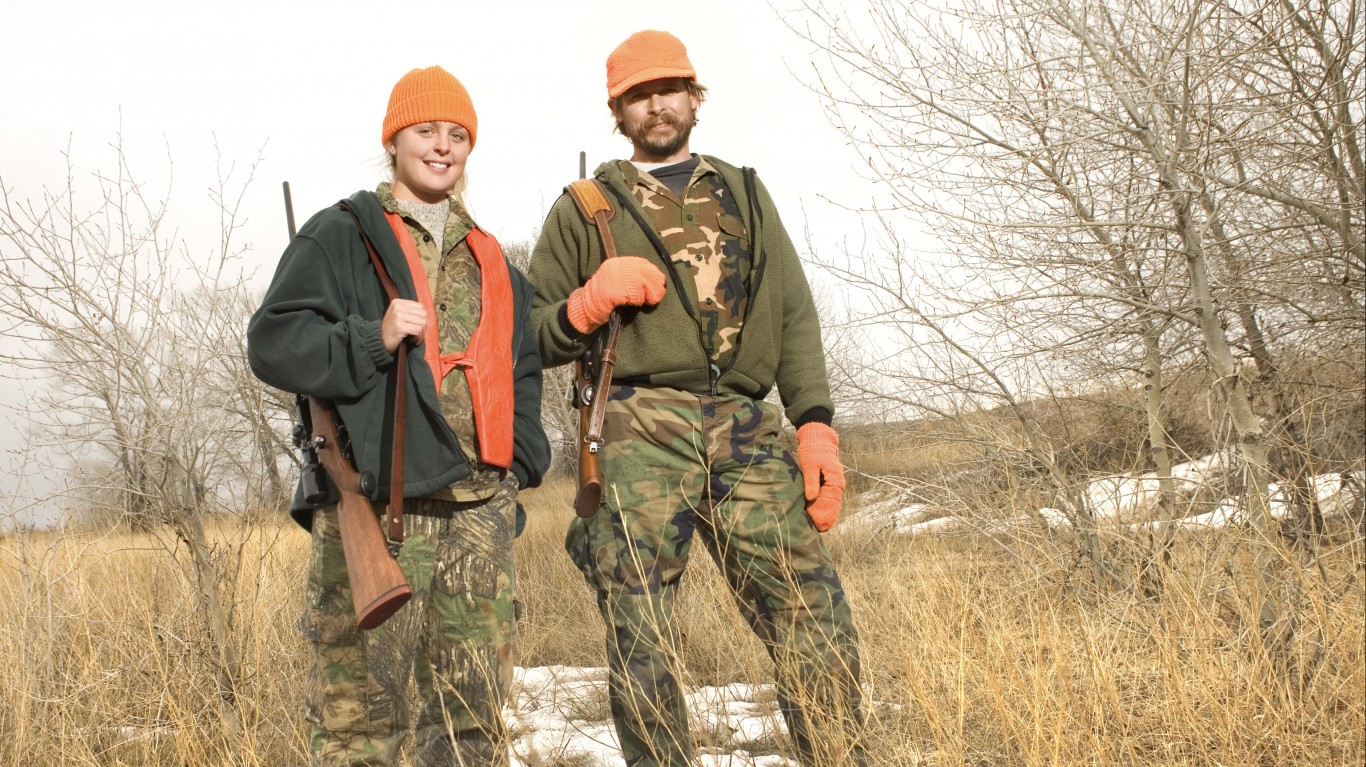
9. Wyoming
> Firearm background checks per 1,000 residents, Jan-Sep 2022: 89.4
> Firearm background checks per 1,000 residents, Jan-Sep 2021: 108.7 (7th most)
> Firearm background checks Jan-Sep 2022: 51,720 (5th fewest)
> Firearm background checks Jan-Sep 2021: 62,914 (6th fewest)
> Change in background checks, first nine months, year-to-date: -11,194 (-17.8% — 18th largest decrease)
> 2021Population: 578,803 (the smallest)
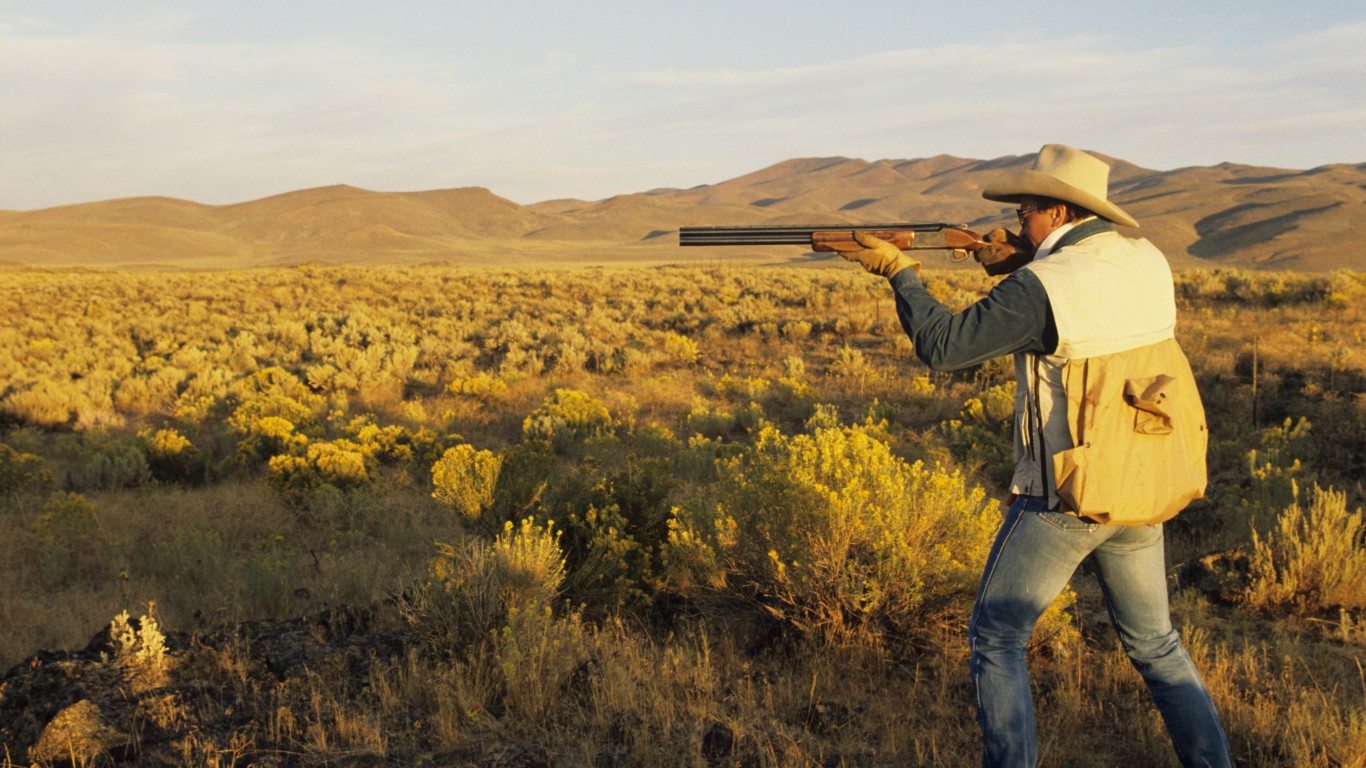
8. Idaho
> Firearm background checks per 1,000 residents, Jan-Sep 2022: 91.6
> Firearm background checks per 1,000 residents, Jan-Sep 2021: 108.3 (8th most)
> Firearm background checks Jan-Sep 2022: 174,126 (21st fewest)
> Firearm background checks Jan-Sep 2021: 205,910 (19th fewest)
> Change in background checks, first nine months, year-to-date: -31,784 (-15.4% — 18th smallest decrease)
> 2021Population: 1,900,923 (13th smallest)

7. Montana
> Firearm background checks per 1,000 residents, Jan-Sep 2022: 94.6
> Firearm background checks per 1,000 residents, Jan-Sep 2021: 107.9 (9th most)
> Firearm background checks Jan-Sep 2022: 104,421 (12th fewest)
> Firearm background checks Jan-Sep 2021: 119,161 (12th fewest)
> Change in background checks, first nine months, year-to-date: -14,740 (-12.4% — 8th smallest decrease)
> 2021Population: 1,104,271 (8th smallest)
[in-text-ad-2]

6. Alabama
> Firearm background checks per 1,000 residents, Jan-Sep 2022: 107.6
> Firearm background checks per 1,000 residents, Jan-Sep 2021: 141.6 (5th most)
> Firearm background checks Jan-Sep 2022: 542,539 (13th most)
> Firearm background checks Jan-Sep 2021: 713,423 (12th most)
> Change in background checks, first nine months, year-to-date: -170,884 (-24.0% — 8th largest decrease)
> 2021Population: 5,039,877 (24th largest)
5. Minnesota
> Firearm background checks per 1,000 residents, Jan-Sep 2022: 117.5
> Firearm background checks per 1,000 residents, Jan-Sep 2021: 126.0 (6th most)
> Firearm background checks Jan-Sep 2022: 670,402 (9th most)
> Firearm background checks Jan-Sep 2021: 719,163 (11th most)
> Change in background checks, first nine months, year-to-date: -48,761 (-6.8% — 4th smallest decrease)
> 2021Population: 5,707,390 (22nd largest)
[in-text-ad]

4. Indiana
> Firearm background checks per 1,000 residents, Jan-Sep 2022: 127.6
> Firearm background checks per 1,000 residents, Jan-Sep 2021: 215.7 (4th most)
> Firearm background checks Jan-Sep 2022: 868,444 (7th most)
> Firearm background checks Jan-Sep 2021: 1,468,192 (4th most)
> Change in background checks, first nine months, year-to-date: -599,748 (-40.8% — 2nd largest decrease)
> 2021Population: 6,805,985 (17th largest)

3. Utah
> Firearm background checks per 1,000 residents, Jan-Sep 2022: 228.4
> Firearm background checks per 1,000 residents, Jan-Sep 2021: 274.4 (3rd most)
> Firearm background checks Jan-Sep 2022: 762,280 (8th most)
> Firearm background checks Jan-Sep 2021: 916,042 (8th most)
> Change in background checks, first nine months, year-to-date: -153,762 (-16.8% — 23rd largest decrease)
> 2021Population: 3,337,975 (21st smallest)
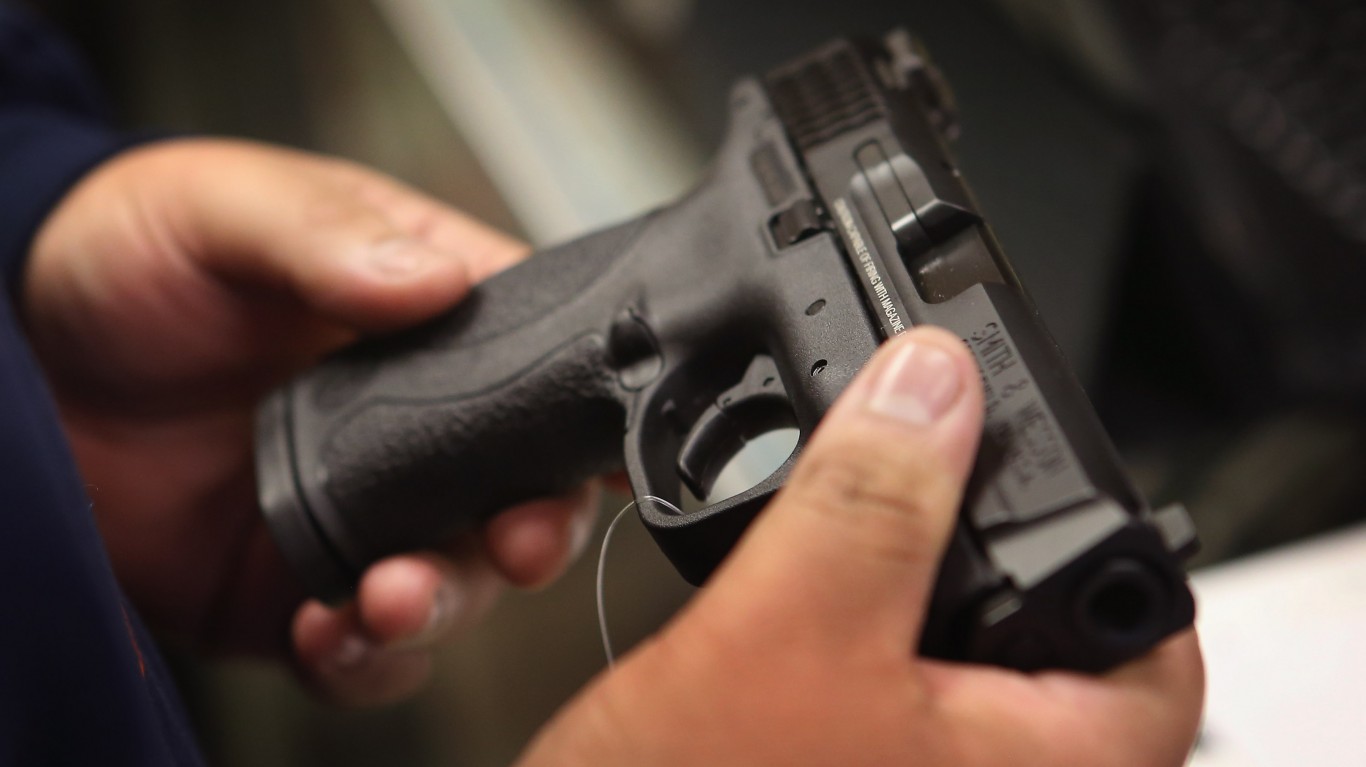
2. Illinois
> Firearm background checks per 1,000 residents, Jan-Sep 2022: 248.0
> Firearm background checks per 1,000 residents, Jan-Sep 2021: 590.4 (2nd most)
> Firearm background checks Jan-Sep 2022: 3,142,673 (the most)
> Firearm background checks Jan-Sep 2021: 7,481,507 (the most)
> Change in background checks, first nine months, year-to-date: -4,338,834 (-58.0% — the largest decrease)
> 2021Population: 12,671,469 (6th largest)
[in-text-ad-2]
1. Kentucky
> Firearm background checks per 1,000 residents, Jan-Sep 2022: 667.9
> Firearm background checks per 1,000 residents, Jan-Sep 2021: 605.5 (the most)
> Firearm background checks Jan-Sep 2022: 3,012,023 (2nd most)
> Firearm background checks Jan-Sep 2021: 2,730,364 (2nd most)
> Change in background checks, first nine months, year-to-date: +281,659 (+10.3% — the largest increase)
> 2021Population: 4,509,394 (25th smallest)
The Average American Is Losing Momentum on Their Savings Every Day (Sponsor)
If you’re like many Americans and keep your money ‘safe’ in a checking or savings account, think again. The average yield on a savings account is a paltry .4%* today. Checking accounts are even worse.
But there is good news. To win qualified customers, some accounts are paying nearly 10x the national average! That’s an incredible way to keep your money safe and earn more at the same time. Our top pick for high yield savings accounts includes other benefits as well. You can earn up to 3.80% with a Checking & Savings Account today Sign up and get up to $300 with direct deposit. No account fees. FDIC Insured.
Click here to see how much more you could be earning on your savings today. It takes just a few minutes to open an account to make your money work for you.
Thank you for reading! Have some feedback for us?
Contact the 24/7 Wall St. editorial team.

 24/7 Wall St.
 24/7 Wall St.

 24/7 Wall St.