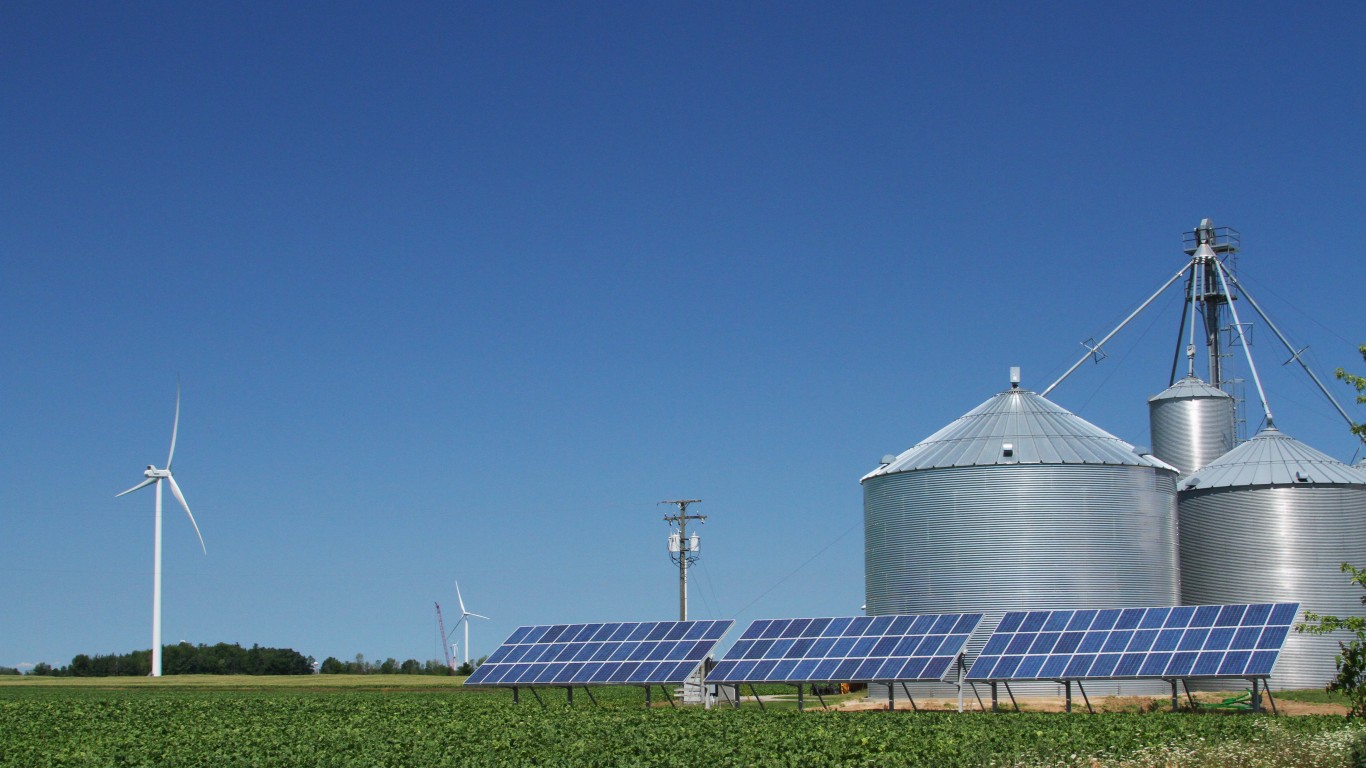
According to BigRentz, an estimated 250,000 Americans lived off the grid as of 2020, and some forecast the number to increase in coming years. Dvele, a company that builds sustainable, off-the-grid homes, has seen a large increase in demand following black-out-inducing climate events in some Western states.
What does it mean to live off the grid? According to the Cambridge Dictionary, those who live off the grid do not need to rely on public utilities, such as electricity and water, as they draw from sources on their own land. (These are the U.S. wind farms generating the most electricity.)
To identify the best states in which to live off the grid in the coming year, 24/7 Tempo reviewed a report on the subject from LawnStarter, a lawn care company that frequently conducts research into city and state amenities. The site reviewed 23 different factors in their assessment, including the availability of renewable energy, the cost of cropland, and the availability of critical-care hospital access. (These are the worst American states for health care.)
It turns out that living off the grid is easier in the so-called flyover states. The five worst states for living off the grid are in the Northeast. On the other hand, six of the top ten best states are landlocked.
Click here to see the best states to live off the grid
Both Texas and California have experienced rolling blackouts due to climate events in recent years, making off the grid living a tantalizing option. Luckily for Texas, it ranks as the No. 2 best state to live off the grid, with the highest growth projections for both solar and wind power in the coming years. While California is also projected to see growth in solar and wind energy, the cost of land is so high that the Golden State only ranks No. 34 on our list.
The top three worst states in which to live off the grid – New Jersey, Rhode Island, and Connecticut – all rank low on factors like affordability, infrastructure, and feasibility (meaning population density as well as the nature of off-the-grid laws regarding things like water, waste, and electricity).

50. New Jersey
> Overall score: 28.23
> Projected 5-year growth of solar installations: 2,353 megawatts (20th highest)
> Projected 10-year growth of wind power production: 2,810 megawatts (20th highest)
> Average per-acre value of cropland: $14,800 (the highest)
> Number of critical-access hospitals: 0
[in-text-ad]

49. Rhode Island
> Overall score: 33.52
> Projected 5-year growth of solar installations: 635 megawatts (8th lowest)
> Projected 10-year growth of wind power production: 1,940 megawatts (22nd lowest)
> Average per-acre value of cropland: $9,530 (3rd highest)
> Number of critical-access hospitals: 0

48. Connecticut
> Overall score: 34.53
> Projected 5-year growth of solar installations: 1,011 megawatts (13th lowest)
> Projected 10-year growth of wind power production: 770 megawatts (11th lowest)
> Average per-acre value of cropland: $9,530 (3rd highest)
> Number of critical-access hospitals: 0

47. Maryland
> Overall score: 36.60
> Projected 5-year growth of solar installations: 1,446 megawatts (17th lowest)
> Projected 10-year growth of wind power production: 1,890 megawatts (21st lowest)
> Average per-acre value of cropland: $7,960 (10th highest)
> Number of critical-access hospitals: 0
[in-text-ad-2]

46. Massachusetts
> Overall score: 37.63
> Projected 5-year growth of solar installations: 1,866 megawatts (24th highest)
> Projected 10-year growth of wind power production: 2,620 megawatts (21st highest)
> Average per-acre value of cropland: $9,530 (3rd highest)
> Number of critical-access hospitals: 3 (6th lowest)

45. Nevada
> Overall score: 39.40
> Projected 5-year growth of solar installations: 1,707 megawatts (24th lowest)
> Projected 10-year growth of wind power production: 350 megawatts (6th lowest)
> Average per-acre value of cropland: Not available
> Number of critical-access hospitals: 13 (17th lowest)
[in-text-ad]

44. Pennsylvania
> Overall score: 40.00
> Projected 5-year growth of solar installations: 4,098 megawatts (12th highest)
> Projected 10-year growth of wind power production: 5,640 megawatts (10th highest)
> Average per-acre value of cropland: $7,600 (14th highest)
> Number of critical-access hospitals: 16 (22nd lowest)

43. Alaska
> Overall score: 40.11
> Projected 5-year growth of solar installations: 66 megawatts (the lowest)
> Projected 10-year growth of wind power production: 00 megawatts (3rd lowest)
> Average per-acre value of cropland: Not available
> Number of critical-access hospitals: 13 (17th lowest)

42. Utah
> Overall score: 40.63
> Projected 5-year growth of solar installations: 1,898 megawatts (23rd highest)
> Projected 10-year growth of wind power production: 770 megawatts (11th lowest)
> Average per-acre value of cropland: $4,190 (25th lowest)
> Number of critical-access hospitals: 13 (17th lowest)
[in-text-ad-2]

41. New York
> Overall score: 45.50
> Projected 5-year growth of solar installations: 8,313 megawatts (6th highest)
> Projected 10-year growth of wind power production: 4,730 megawatts (13th highest)
> Average per-acre value of cropland: $2,910 (14th lowest)
> Number of critical-access hospitals: 18 (23rd lowest)

40. Arizona
> Overall score: 45.97
> Projected 5-year growth of solar installations: 5,342 megawatts (8th highest)
> Projected 10-year growth of wind power production: 1,520 megawatts (18th lowest)
> Average per-acre value of cropland: $7,700 (13th highest)
> Number of critical-access hospitals: 16 (22nd lowest)
[in-text-ad]

39. Delaware
> Overall score: 46.00
> Projected 5-year growth of solar installations: 508 megawatts (6th lowest)
> Projected 10-year growth of wind power production: 120 megawatts (4th lowest)
> Average per-acre value of cropland: $8,600 (9th highest)
> Number of critical-access hospitals: 0

38. North Carolina
> Overall score: 46.79
> Projected 5-year growth of solar installations: 1,902 megawatts (22nd highest)
> Projected 10-year growth of wind power production: 2,920 megawatts (19th highest)
> Average per-acre value of cropland: $4,290 (25th highest)
> Number of critical-access hospitals: 20 (24th lowest)

37. Michigan
> Overall score: 47.92
> Projected 5-year growth of solar installations: 2,594 megawatts (16th highest)
> Projected 10-year growth of wind power production: 2,160 megawatts (25th lowest)
> Average per-acre value of cropland: $4,700 (22nd highest)
> Number of critical-access hospitals: 37 (12th highest)
[in-text-ad-2]

36. Florida
> Overall score: 47.94
> Projected 5-year growth of solar installations: 10,935 megawatts (4th highest)
> Projected 10-year growth of wind power production: 00 megawatts (3rd lowest)
> Average per-acre value of cropland: $7,300 (15th highest)
> Number of critical-access hospitals: 10 (12th lowest)
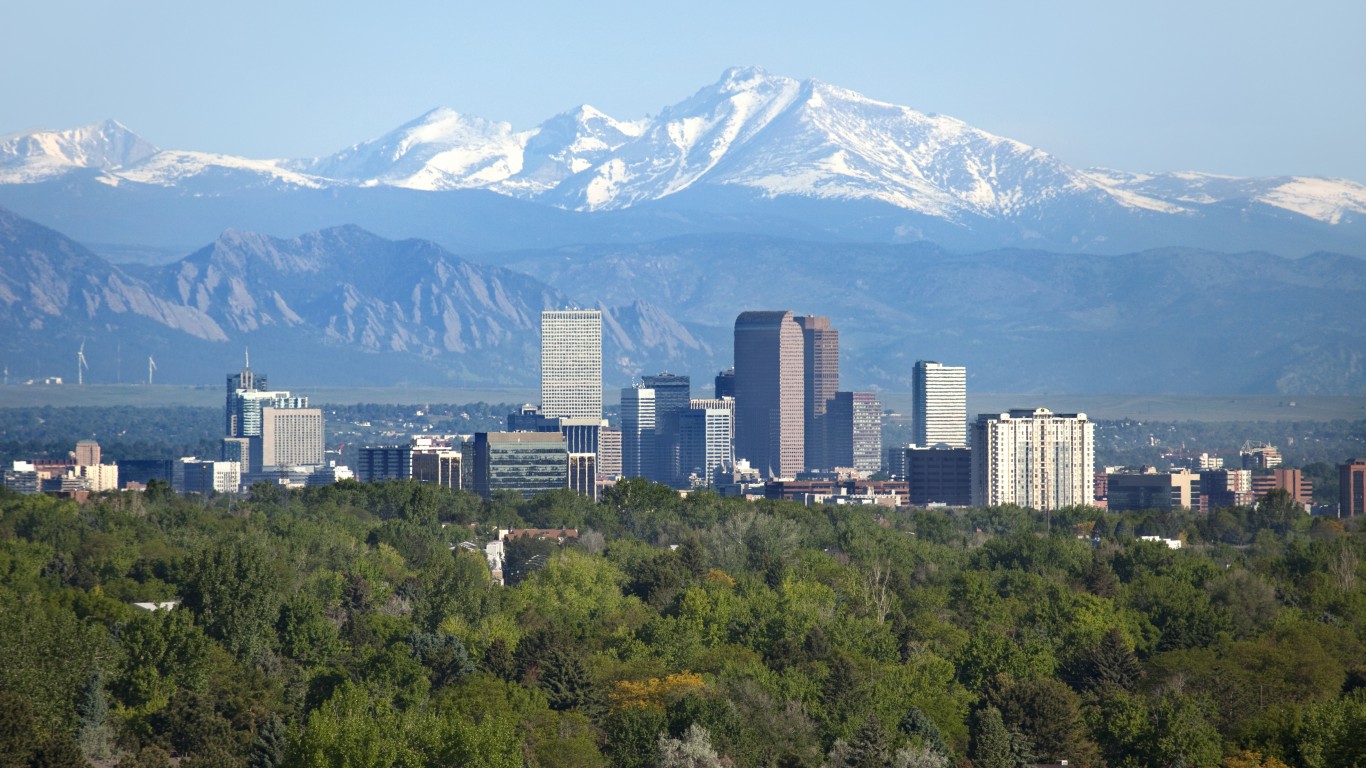
35. Colorado
> Overall score: 48.05
> Projected 5-year growth of solar installations: 3,946 megawatts (13th highest)
> Projected 10-year growth of wind power production: 2,360 megawatts (24th highest)
> Average per-acre value of cropland: $2,240 (10th lowest)
> Number of critical-access hospitals: 32 (18th highest)
[in-text-ad]

34. California
> Overall score: 49.09
> Projected 5-year growth of solar installations: 24,874 megawatts (2nd highest)
> Projected 10-year growth of wind power production: 8,010 megawatts (7th highest)
> Average per-acre value of cropland: $13,860 (2nd highest)
> Number of critical-access hospitals: 36 (14th highest)

33. Hawaii
> Overall score: 49.55
> Projected 5-year growth of solar installations: 825 megawatts (10th lowest)
> Projected 10-year growth of wind power production: 00 megawatts (3rd lowest)
> Average per-acre value of cropland: Not available
> Number of critical-access hospitals: 9 (11th lowest)

32. New Mexico
> Overall score: 49.95
> Projected 5-year growth of solar installations: 4,365 megawatts (11th highest)
> Projected 10-year growth of wind power production: 4,850 megawatts (12th highest)
> Average per-acre value of cropland: $1,660 (6th lowest)
> Number of critical-access hospitals: 11 (13th lowest)
[in-text-ad-2]
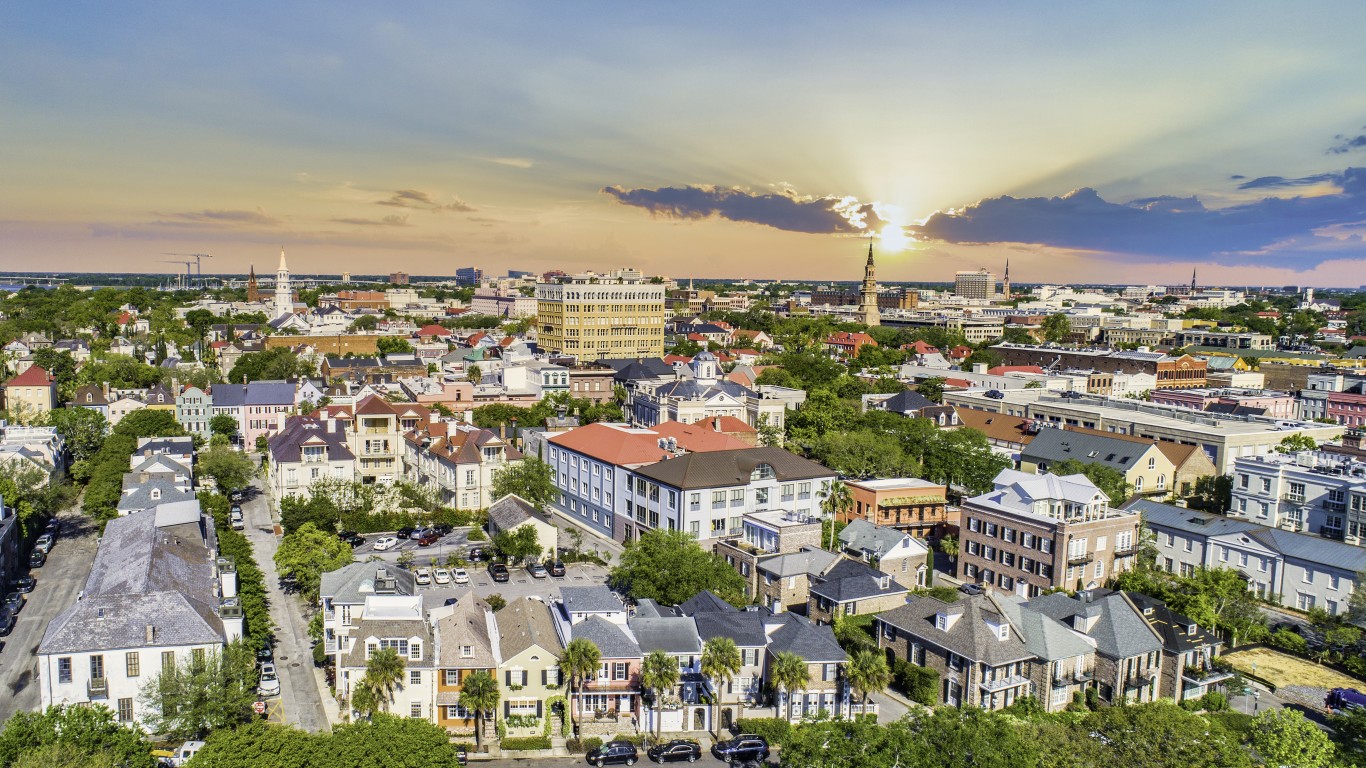
31. South Carolina
> Overall score: 50.43
> Projected 5-year growth of solar installations: 1,456 megawatts (19th lowest)
> Projected 10-year growth of wind power production: 1,100 megawatts (14th lowest)
> Average per-acre value of cropland: $2,900 (13th lowest)
> Number of critical-access hospitals: 4 (7th lowest)

30. Virginia
> Overall score: 50.80
> Projected 5-year growth of solar installations: 7,013 megawatts (7th highest)
> Projected 10-year growth of wind power production: 870 megawatts (12th lowest)
> Average per-acre value of cropland: $4,790 (21st highest)
> Number of critical-access hospitals: 8 (10th lowest)
[in-text-ad]

28. New Hampshire
> Overall score: 50.99
> Projected 5-year growth of solar installations: 631 megawatts (7th lowest)
> Projected 10-year growth of wind power production: 470 megawatts (9th lowest)
> Average per-acre value of cropland: $9,530 (3rd highest)
> Number of critical-access hospitals: 13 (17th lowest)

28. Alabama
> Overall score: 50.99
> Projected 5-year growth of solar installations: 2,393 megawatts (19th highest)
> Projected 10-year growth of wind power production: 1,980 megawatts (23rd lowest)
> Average per-acre value of cropland: $3,550 (22nd lowest)
> Number of critical-access hospitals: 5 (8th lowest)

27. Washington
> Overall score: 51.12
> Projected 5-year growth of solar installations: 1,294 megawatts (14th lowest)
> Projected 10-year growth of wind power production: 3,130 megawatts (18th highest)
> Average per-acre value of cropland: $2,700 (12th lowest)
> Number of critical-access hospitals: 39 (10th highest)
[in-text-ad-2]

26. Mississippi
> Overall score: 52.15
> Projected 5-year growth of solar installations: 2,300 megawatts (21st highest)
> Projected 10-year growth of wind power production: 470 megawatts (9th lowest)
> Average per-acre value of cropland: $3,150 (17th lowest)
> Number of critical-access hospitals: 32 (18th highest)

25. Louisiana
> Overall score: 52.24
> Projected 5-year growth of solar installations: 2,851 megawatts (15th highest)
> Projected 10-year growth of wind power production: 1,280 megawatts (15th lowest)
> Average per-acre value of cropland: $2,980 (16th lowest)
> Number of critical-access hospitals: 27 (23rd highest)
[in-text-ad]

24. Ohio
> Overall score: 52.32
> Projected 5-year growth of solar installations: 11,226 megawatts (3rd highest)
> Projected 10-year growth of wind power production: 7,310 megawatts (8th highest)
> Average per-acre value of cropland: $6,800 (16th highest)
> Number of critical-access hospitals: 33 (17th highest)

23. Georgia
> Overall score: 52.42
> Projected 5-year growth of solar installations: 1,761 megawatts (25th lowest)
> Projected 10-year growth of wind power production: 290 megawatts (5th lowest)
> Average per-acre value of cropland: $3,480 (21st lowest)
> Number of critical-access hospitals: 30 (20th highest)

22. Indiana
> Overall score: 52.91
> Projected 5-year growth of solar installations: 8,741 megawatts (5th highest)
> Projected 10-year growth of wind power production: 13,500 megawatts (5th highest)
> Average per-acre value of cropland: $6,800 (16th highest)
> Number of critical-access hospitals: 35 (15th highest)
[in-text-ad-2]

21. West Virginia
> Overall score: 54.07
> Projected 5-year growth of solar installations: 816 megawatts (9th lowest)
> Projected 10-year growth of wind power production: 2,030 megawatts (24th lowest)
> Average per-acre value of cropland: $3,330 (19th lowest)
> Number of critical-access hospitals: 21 (25th lowest)

20. Maine
> Overall score: 54.25
> Projected 5-year growth of solar installations: 1,785 megawatts (25th highest)
> Projected 10-year growth of wind power production: 2,300 megawatts (25th highest)
> Average per-acre value of cropland: $9,530 (3rd highest)
> Number of critical-access hospitals: 16 (22nd lowest)
[in-text-ad]

19. Oregon
> Overall score: 55.18
> Projected 5-year growth of solar installations: 2,511 megawatts (18th highest)
> Projected 10-year growth of wind power production: 6,090 megawatts (9th highest)
> Average per-acre value of cropland: $3,310 (18th lowest)
> Number of critical-access hospitals: 25 (25th highest)

18. Tennessee
> Overall score: 55.54
> Projected 5-year growth of solar installations: 1,664 megawatts (22nd lowest)
> Projected 10-year growth of wind power production: 1,310 megawatts (16th lowest)
> Average per-acre value of cropland: $4,130 (24th lowest)
> Number of critical-access hospitals: 16 (22nd lowest)

17. Idaho
> Overall score: 56.64
> Projected 5-year growth of solar installations: 937 megawatts (12th lowest)
> Projected 10-year growth of wind power production: 1,890 megawatts (21st lowest)
> Average per-acre value of cropland: $4,450 (24th highest)
> Number of critical-access hospitals: 27 (23rd highest)
[in-text-ad-2]

16. Arkansas
> Overall score: 56.84
> Projected 5-year growth of solar installations: 2,533 megawatts (17th highest)
> Projected 10-year growth of wind power production: 2,550 megawatts (22nd highest)
> Average per-acre value of cropland: $2,930 (15th lowest)
> Number of critical-access hospitals: 28 (21st highest)

15. Vermont
> Overall score: 56.87
> Projected 5-year growth of solar installations: 177 megawatts (2nd lowest)
> Projected 10-year growth of wind power production: 430 megawatts (7th lowest)
> Average per-acre value of cropland: $9,530 (3rd highest)
> Number of critical-access hospitals: 8 (10th lowest)
[in-text-ad]

14. Wisconsin
> Overall score: 57.19
> Projected 5-year growth of solar installations: 4,932 megawatts (10th highest)
> Projected 10-year growth of wind power production: 1,780 megawatts (19th lowest)
> Average per-acre value of cropland: $5,280 (18th highest)
> Number of critical-access hospitals: 58 (6th highest)

13. South Dakota
> Overall score: 57.74
> Projected 5-year growth of solar installations: 252 megawatts (4th lowest)
> Projected 10-year growth of wind power production: 2,400 megawatts (23rd highest)
> Average per-acre value of cropland: $3,390 (20th lowest)
> Number of critical-access hospitals: 39 (10th highest)
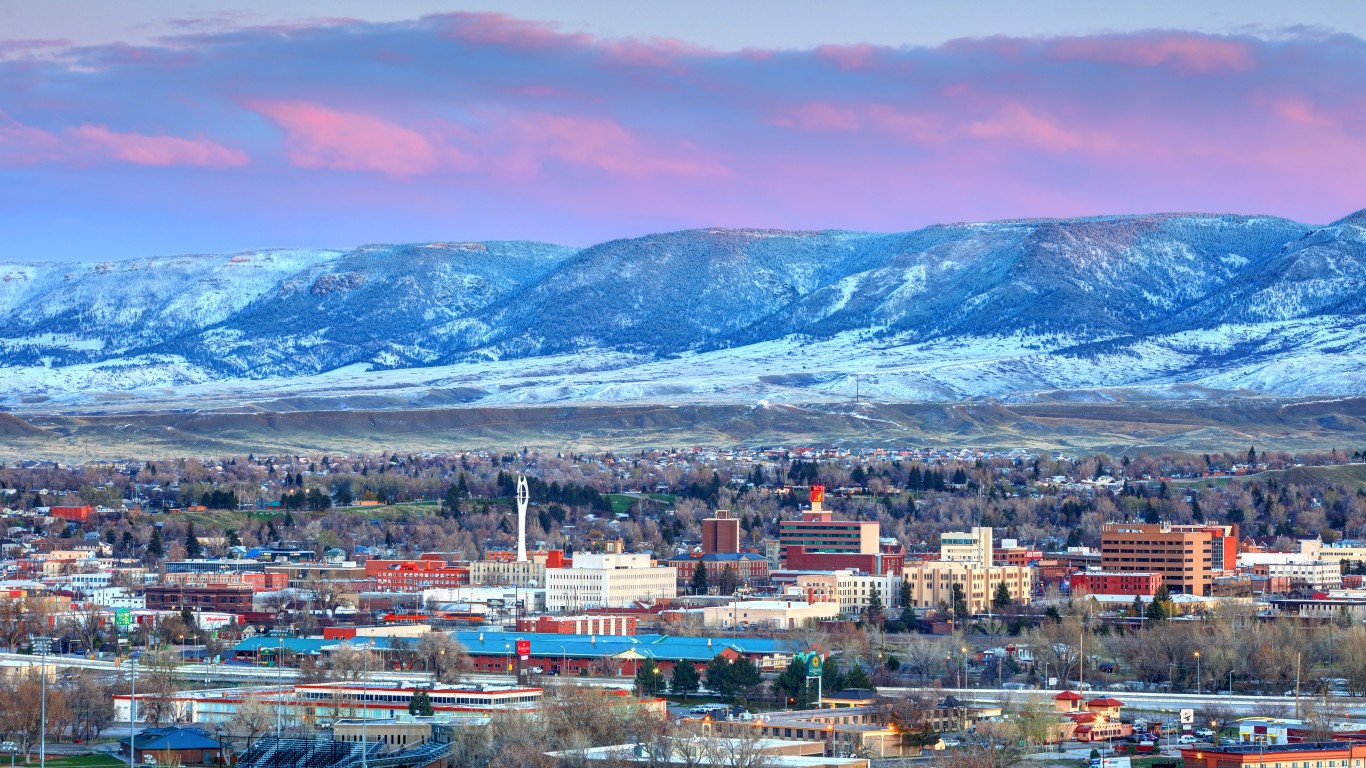
12. Wyoming
> Overall score: 57.84
> Projected 5-year growth of solar installations: 234 megawatts (3rd lowest)
> Projected 10-year growth of wind power production: 8,740 megawatts (6th highest)
> Average per-acre value of cropland: $1,600 (5th lowest)
> Number of critical-access hospitals: 16 (22nd lowest)
[in-text-ad-2]

11. Missouri
> Overall score: 58.25
> Projected 5-year growth of solar installations: 1,707 megawatts (24th lowest)
> Projected 10-year growth of wind power production: 4,350 megawatts (15th highest)
> Average per-acre value of cropland: $3,810 (23rd lowest)
> Number of critical-access hospitals: 35 (15th highest)

10. Montana
> Overall score: 58.50
> Projected 5-year growth of solar installations: 1,449 megawatts (18th lowest)
> Projected 10-year growth of wind power production: 15,940 megawatts (4th highest)
> Average per-acre value of cropland: $1,050 (4th lowest)
> Number of critical-access hospitals: 49 (8th highest)
[in-text-ad]

9. Illinois
> Overall score: 58.90
> Projected 5-year growth of solar installations: 5,085 megawatts (9th highest)
> Projected 10-year growth of wind power production: 19,620 megawatts (2nd highest)
> Average per-acre value of cropland: $7,900 (11th highest)
> Number of critical-access hospitals: 52 (7th highest)

8. North Dakota
> Overall score: 59.54
> Projected 5-year growth of solar installations: 298 megawatts (5th lowest)
> Projected 10-year growth of wind power production: 4,710 megawatts (14th highest)
> Average per-acre value of cropland: $2,060 (8th lowest)
> Number of critical-access hospitals: 37 (12th highest)

7. Kansas
> Overall score: 60.58
> Projected 5-year growth of solar installations: 1,308 megawatts (16th lowest)
> Projected 10-year growth of wind power production: 3,270 megawatts (17th highest)
> Average per-acre value of cropland: $2,370 (11th lowest)
> Number of critical-access hospitals: 82 (2nd highest)
[in-text-ad-2]

6. Nebraska
> Overall score: 61.00
> Projected 5-year growth of solar installations: 892 megawatts (11th lowest)
> Projected 10-year growth of wind power production: 1,360 megawatts (17th lowest)
> Average per-acre value of cropland: $4,960 (20th highest)
> Number of critical-access hospitals: 63 (5th highest)

5. Oklahoma
> Overall score: 61.09
> Projected 5-year growth of solar installations: 2,877 megawatts (14th highest)
> Projected 10-year growth of wind power production: 5,560 megawatts (11th highest)
> Average per-acre value of cropland: $1,810 (7th lowest)
> Number of critical-access hospitals: 40 (9th highest)
[in-text-ad]

4. Minnesota
> Overall score: 61.25
> Projected 5-year growth of solar installations: 1,488 megawatts (20th lowest)
> Projected 10-year growth of wind power production: 3,990 megawatts (16th highest)
> Average per-acre value of cropland: $5,270 (19th highest)
> Number of critical-access hospitals: 77 (4th highest)

3. Kentucky
> Overall score: 63.36
> Projected 5-year growth of solar installations: 1,594 megawatts (21st lowest)
> Projected 10-year growth of wind power production: 950 megawatts (13th lowest)
> Average per-acre value of cropland: $4,510 (23rd highest)
> Number of critical-access hospitals: 28 (21st highest)

2. Texas
> Overall score: 65.58
> Projected 5-year growth of solar installations: 40,136 megawatts (the highest)
> Projected 10-year growth of wind power production: 43,640 megawatts (the highest)
> Average per-acre value of cropland: $2,150 (9th lowest)
> Number of critical-access hospitals: 88 (the highest)
[in-text-ad-2]
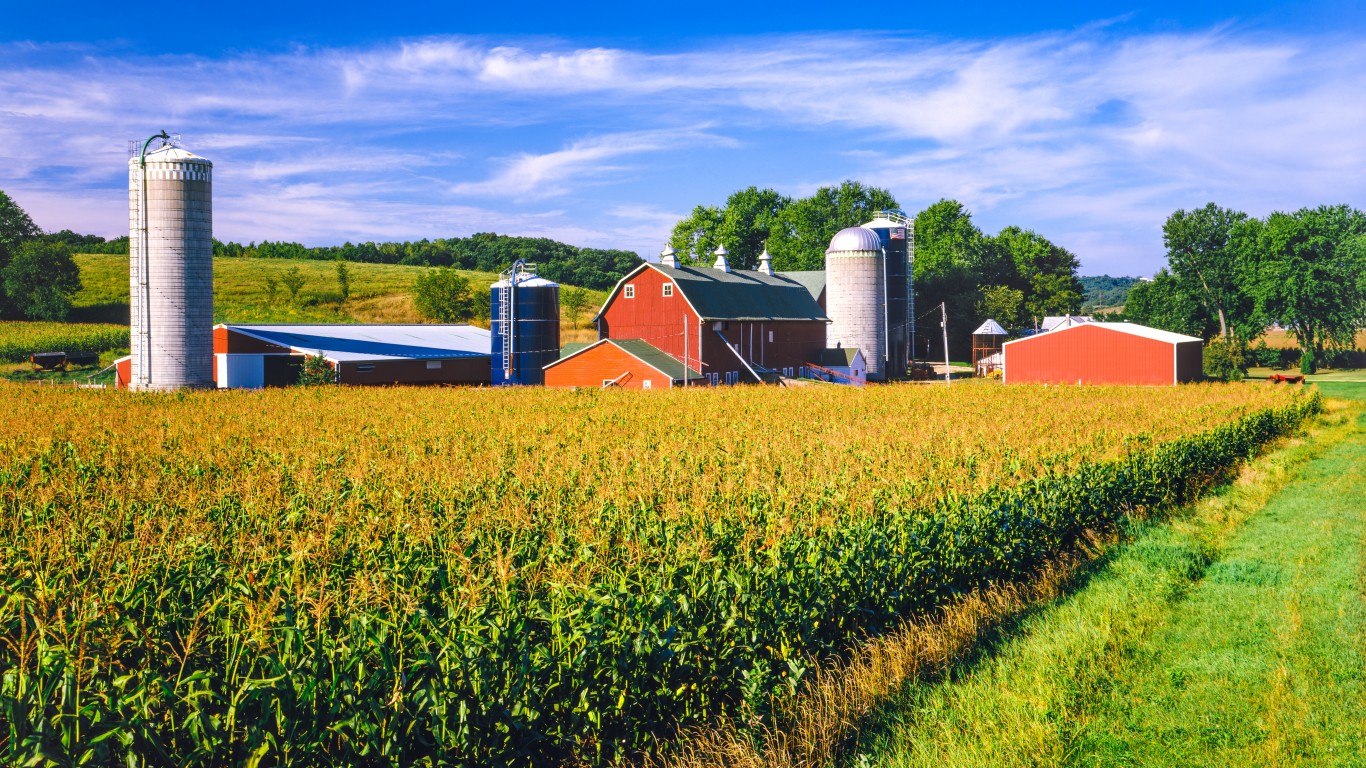
1. Iowa
> Overall score: 67.12
> Projected 5-year growth of solar installations: 1,304 megawatts (15th lowest)
> Projected 10-year growth of wind power production: 17,300 megawatts (3rd highest)
> Average per-acre value of cropland: $7,810 (12th highest)
> Number of critical-access hospitals: 82 (2nd highest)
100 Million Americans Are Missing This Crucial Retirement Tool
The thought of burdening your family with a financial disaster is most Americans’ nightmare. However, recent studies show that over 100 million Americans still don’t have proper life insurance in the event they pass away.
Life insurance can bring peace of mind – ensuring your loved ones are safeguarded against unforeseen expenses and debts. With premiums often lower than expected and a variety of plans tailored to different life stages and health conditions, securing a policy is more accessible than ever.
A quick, no-obligation quote can provide valuable insight into what’s available and what might best suit your family’s needs. Life insurance is a simple step you can take today to help secure peace of mind for your loved ones tomorrow.
Click here to learn how to get a quote in just a few minutes.
Thank you for reading! Have some feedback for us?
Contact the 24/7 Wall St. editorial team.
 24/7 Wall St.
 24/7 Wall St.
