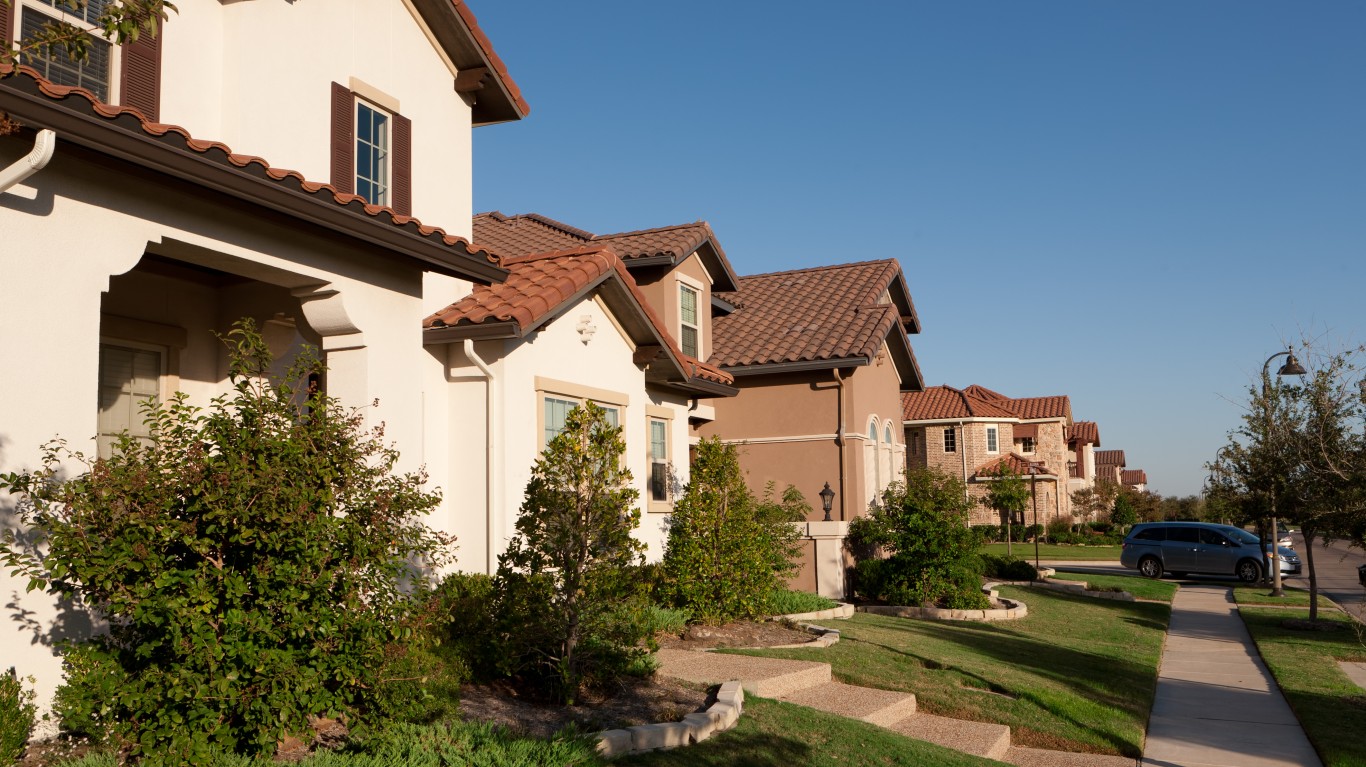
The housing market has been red hot during the pandemic, with home prices hitting record highs up until a few months ago. More recently, surging mortgage rates have put some pressure on the housing market, slowing the climb in housing prices. That could be good news for buyers, though home prices remain considerably higher than they were in 2019 after surging in the two years since.
Nationwide, the average median home value rose 17% between 2019 and 2021, according to data from the 2021 and 2019 American Community Surveys from the U.S. Census Bureau. During that time, median household incomes grew a far smaller 6%. That gap has made homes, especially in some areas, more unaffordable.
To identify the states where home values increased the most during the COVID-19 pandemic, 24/7 Wall St. reviewed data from the 2021 and 2019 American Community Surveys from the U.S. Census Bureau. States are ranked on the percent change in median home value from 2019 to 2021. All other data came from the Census Bureau.
Three of states where home values spiked the most during COVID-19 are in the West. Idaho median home values surged 44.7% from 2019 to 2021, even as median household income rose 9% during that time – the seventh largest increase in median household income.
In Arizona, meanwhile, median household income rose 11.3% from 2019 to 2021, the third largest increase. Yet that might not be enough to cover the 31.4% rise in median home values during the same period.
In No. 3 Utah, median home values were 27.7% higher in 2021 than they were in 2019, yet household incomes rose a mere 4.8%, much lower than the national increase in median household income. (Also see, cities with the cheapest housing.)
As we look into the year ahead, considering the recent surge in mortgage rate, some economists predict either a slow decline in home values through 2023 or a crash, Forbes recently reported. (This is the mortgage rate in America every year since 1972.)
Click here to see states where home values increased the most during COVID.
50. Hawaii
> Change in median home value, 2019-2021: +8.0% (+$53,300)
> Median home value: $722,500 in 2021; $669,200 in 2019
> Change in median household income, 2019-2021: +2.1% – 4th smallest increase (+$1,755)
> Median household income: $84,857 in 2021; $83,102 in 2019
> Population change, 2019-2021: +1.8% – 16th largest increase (+25,681)
> Population: 1,441,553 in 2021; 1,415,872 in 2019
[in-text-ad]

49. Alaska
> Change in median home value, 2019-2021: +8.4% (+$23,700)
> Median home value: $304,900 in 2021; $281,200 in 2019
> Change in median household income, 2019-2021: +3.2% – 8th smallest increase (+$2,382)
> Median household income: $77,845 in 2021; $75,463 in 2019
> Population change, 2019-2021: +0.2% – 2nd smallest increase (+1,128)
> Population: 732,673 in 2021; 731,545 in 2019

48. New York
> Change in median home value, 2019-2021: +8.9% (+$30,100)
> Median home value: $368,800 in 2021; $338,700 in 2019
> Change in median household income, 2019-2021: +3.1% – 7th smallest increase (+$2,206)
> Median household income: $74,314 in 2021; $72,108 in 2019
> Population change, 2019-2021: +2.0% – 14th largest increase (+382,352)
> Population: 19,835,913 in 2021; 19,453,561 in 2019

47. North Dakota
> Change in median home value, 2019-2021: +9.3% (+$19,000)
> Median home value: $224,400 in 2021; $205,400 in 2019
> Change in median household income, 2019-2021: +3.0% – 6th smallest increase (+$1,942)
> Median household income: $66,519 in 2021; $64,577 in 2019
> Population change, 2019-2021: +1.7% – 18th largest increase (+12,886)
> Population: 774,948 in 2021; 762,062 in 2019
[in-text-ad-2]

46. Iowa
> Change in median home value, 2019-2021: +9.8% (+$15,500)
> Median home value: $174,400 in 2021; $158,900 in 2019
> Change in median household income, 2019-2021: +6.3% – 21st largest increase (+$3,909)
> Median household income: $65,600 in 2021; $61,691 in 2019
> Population change, 2019-2021: +1.2% – 18th smallest increase (+38,009)
> Population: 3,193,079 in 2021; 3,155,070 in 2019

45. Illinois
> Change in median home value, 2019-2021: +10.7% (+$22,400)
> Median home value: $231,500 in 2021; $209,100 in 2019
> Change in median household income, 2019-2021: +4.4% – 16th smallest increase (+$3,018)
> Median household income: $72,205 in 2021; $69,187 in 2019
> Population change, 2019-2021: -0.0% – 6th largest decrease (-352)
> Population: 12,671,469 in 2021; 12,671,821 in 2019
[in-text-ad]

44. Connecticut
> Change in median home value, 2019-2021: +11.0% (+$30,800)
> Median home value: $311,500 in 2021; $280,700 in 2019
> Change in median household income, 2019-2021: +6.3% – 23rd largest increase (+$4,938)
> Median household income: $83,771 in 2021; $78,833 in 2019
> Population change, 2019-2021: +1.1% – 16th smallest increase (+40,310)
> Population: 3,605,597 in 2021; 3,565,287 in 2019

43. Maryland
> Change in median home value, 2019-2021: +11.5% (+$38,300)
> Median home value: $370,800 in 2021; $332,500 in 2019
> Change in median household income, 2019-2021: +4.0% – 12th smallest increase (+$3,465)
> Median household income: $90,203 in 2021; $86,738 in 2019
> Population change, 2019-2021: +2.0% – 13th largest increase (+119,449)
> Population: 6,165,129 in 2021; 6,045,680 in 2019

42. New Jersey
> Change in median home value, 2019-2021: +11.8% (+$41,000)
> Median home value: $389,800 in 2021; $348,800 in 2019
> Change in median household income, 2019-2021: +4.1% – 13th smallest increase (+$3,545)
> Median household income: $89,296 in 2021; $85,751 in 2019
> Population change, 2019-2021: +4.3% – 2nd largest increase (+384,940)
> Population: 9,267,130 in 2021; 8,882,190 in 2019
[in-text-ad-2]

41. Louisiana
> Change in median home value, 2019-2021: +12.0% (+$20,700)
> Median home value: $192,800 in 2021; $172,100 in 2019
> Change in median household income, 2019-2021: +2.0% – 3rd smallest increase (+$1,014)
> Median household income: $52,087 in 2021; $51,073 in 2019
> Population change, 2019-2021: -0.5% – 3rd largest decrease (-24,747)
> Population: 4,624,047 in 2021; 4,648,794 in 2019

40. Alabama
> Change in median home value, 2019-2021: +12.2% (+$18,800)
> Median home value: $172,800 in 2021; $154,000 in 2019
> Change in median household income, 2019-2021: +4.2% – 15th smallest increase (+$2,179)
> Median household income: $53,913 in 2021; $51,734 in 2019
> Population change, 2019-2021: +2.8% – 8th largest increase (+136,692)
> Population: 5,039,877 in 2021; 4,903,185 in 2019
[in-text-ad]

39. Kansas
> Change in median home value, 2019-2021: +12.6% (+$20,600)
> Median home value: $183,800 in 2021; $163,200 in 2019
> Change in median household income, 2019-2021: +3.3% – 9th smallest increase (+$2,037)
> Median household income: $64,124 in 2021; $62,087 in 2019
> Population change, 2019-2021: +0.7% – 8th smallest increase (+21,268)
> Population: 2,934,582 in 2021; 2,913,314 in 2019

38. Wyoming
> Change in median home value, 2019-2021: +13.3% (+$31,200)
> Median home value: $266,400 in 2021; $235,200 in 2019
> Change in median household income, 2019-2021: +0.3% – the smallest increase (+$201)
> Median household income: $65,204 in 2021; $65,003 in 2019
> Population change, 2019-2021: +0.0% – the smallest increase (+44)
> Population: 578,803 in 2021; 578,759 in 2019

37. Mississippi
> Change in median home value, 2019-2021: +13.6% (+$17,400)
> Median home value: $145,600 in 2021; $128,200 in 2019
> Change in median household income, 2019-2021: +6.4% – 20th largest increase (+$2,924)
> Median household income: $48,716 in 2021; $45,792 in 2019
> Population change, 2019-2021: -0.9% – the largest decrease (-26,184)
> Population: 2,949,965 in 2021; 2,976,149 in 2019
[in-text-ad-2]

36. California
> Change in median home value, 2019-2021: +14.0% (+$79,600)
> Median home value: $648,100 in 2021; $568,500 in 2019
> Change in median household income, 2019-2021: +5.6% – 24th smallest increase (+$4,467)
> Median household income: $84,907 in 2021; $80,440 in 2019
> Population change, 2019-2021: -0.7% – 2nd largest decrease (-274,387)
> Population: 39,237,836 in 2021; 39,512,223 in 2019

35. Kentucky
> Change in median home value, 2019-2021: +14.2% (+$21,600)
> Median home value: $173,300 in 2021; $151,700 in 2019
> Change in median household income, 2019-2021: +6.3% – 22nd largest increase (+$3,278)
> Median household income: $55,573 in 2021; $52,295 in 2019
> Population change, 2019-2021: +0.9% – 14th smallest increase (+41,721)
> Population: 4,509,394 in 2021; 4,467,673 in 2019
[in-text-ad]

34. Virginia
> Change in median home value, 2019-2021: +14.5% (+$41,800)
> Median home value: $330,600 in 2021; $288,800 in 2019
> Change in median household income, 2019-2021: +5.9% – 25th largest increase (+$4,507)
> Median household income: $80,963 in 2021; $76,456 in 2019
> Population change, 2019-2021: +1.3% – 25th largest increase (+106,755)
> Population: 8,642,274 in 2021; 8,535,519 in 2019

33. Oklahoma
> Change in median home value, 2019-2021: +14.6% (+$21,500)
> Median home value: $168,500 in 2021; $147,000 in 2019
> Change in median household income, 2019-2021: +2.5% – 5th smallest increase (+$1,377)
> Median household income: $55,826 in 2021; $54,449 in 2019
> Population change, 2019-2021: +0.7% – 9th smallest increase (+29,668)
> Population: 3,986,639 in 2021; 3,956,971 in 2019

32. Ohio
> Change in median home value, 2019-2021: +14.6% (+$23,000)
> Median home value: $180,200 in 2021; $157,200 in 2019
> Change in median household income, 2019-2021: +6.2% – 24th largest increase (+$3,620)
> Median household income: $62,262 in 2021; $58,642 in 2019
> Population change, 2019-2021: +0.8% – 10th smallest increase (+90,917)
> Population: 11,780,017 in 2021; 11,689,100 in 2019
[in-text-ad-2]

31. Massachusetts
> Change in median home value, 2019-2021: +14.8% (+$62,000)
> Median home value: $480,600 in 2021; $418,600 in 2019
> Change in median household income, 2019-2021: +4.4% – 17th smallest increase (+$3,802)
> Median household income: $89,645 in 2021; $85,843 in 2019
> Population change, 2019-2021: +1.3% – 22nd largest increase (+92,220)
> Population: 6,984,723 in 2021; 6,892,503 in 2019

30. Delaware
> Change in median home value, 2019-2021: +14.8% (+$38,800)
> Median home value: $300,500 in 2021; $261,700 in 2019
> Change in median household income, 2019-2021: +1.3% – 2nd smallest increase (+$915)
> Median household income: $71,091 in 2021; $70,176 in 2019
> Population change, 2019-2021: +3.0% – 7th largest increase (+29,620)
> Population: 1,003,384 in 2021; 973,764 in 2019
[in-text-ad]

29. West Virginia
> Change in median home value, 2019-2021: +14.9% (+$18,600)
> Median home value: $143,200 in 2021; $124,600 in 2019
> Change in median household income, 2019-2021: +4.9% – 22nd smallest increase (+$2,398)
> Median household income: $51,248 in 2021; $48,850 in 2019
> Population change, 2019-2021: -0.5% – 4th largest decrease (-9,188)
> Population: 1,782,959 in 2021; 1,792,147 in 2019
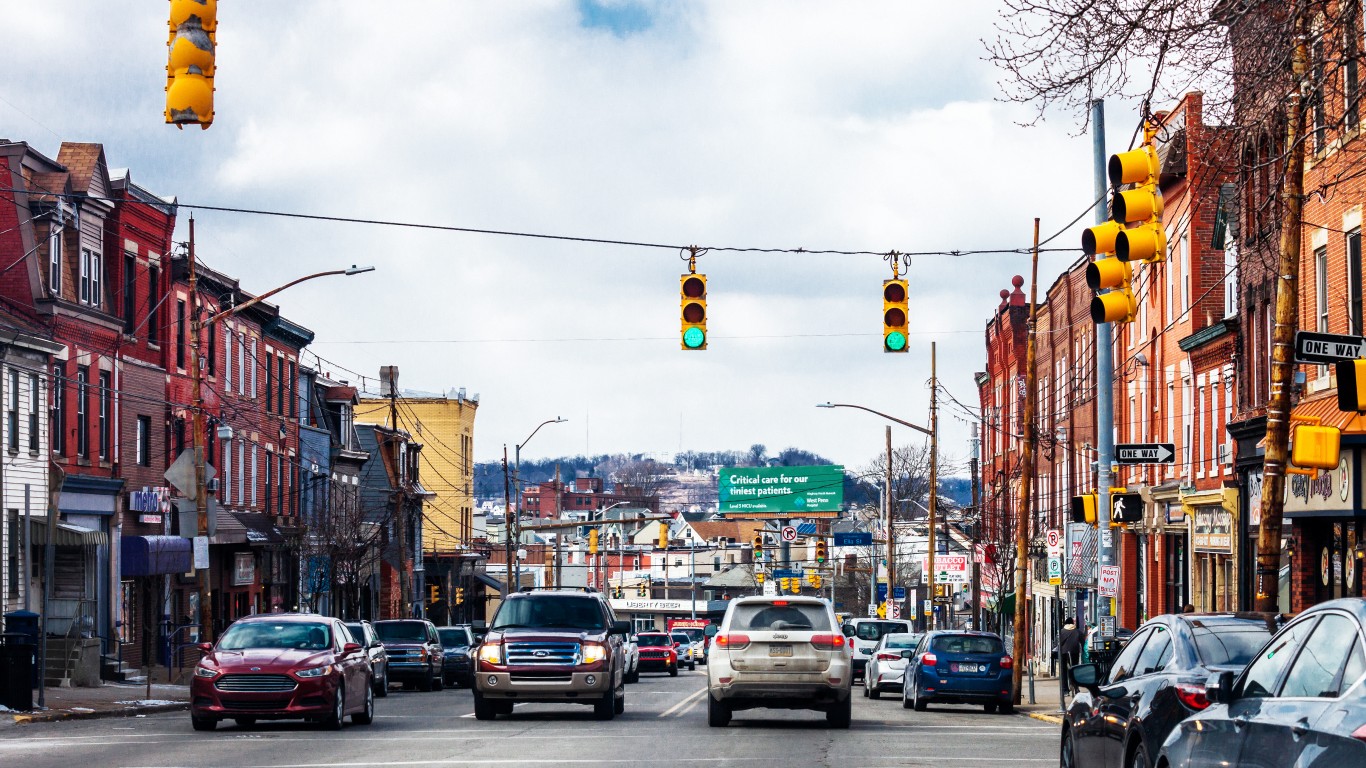
28. Pennsylvania
> Change in median home value, 2019-2021: +15.4% (+$29,700)
> Median home value: $222,300 in 2021; $192,600 in 2019
> Change in median household income, 2019-2021: +8.7% – 9th largest increase (+$5,494)
> Median household income: $68,957 in 2021; $63,463 in 2019
> Population change, 2019-2021: +1.3% – 23rd largest increase (+162,067)
> Population: 12,964,056 in 2021; 12,801,989 in 2019

27. Minnesota
> Change in median home value, 2019-2021: +15.7% (+$38,700)
> Median home value: $285,400 in 2021; $246,700 in 2019
> Change in median household income, 2019-2021: +4.2% – 14th smallest increase (+$3,127)
> Median household income: $77,720 in 2021; $74,593 in 2019
> Population change, 2019-2021: +1.2% – 17th smallest increase (+67,758)
> Population: 5,707,390 in 2021; 5,639,632 in 2019
[in-text-ad-2]

26. Vermont
> Change in median home value, 2019-2021: +16.4% (+$38,300)
> Median home value: $271,500 in 2021; $233,200 in 2019
> Change in median household income, 2019-2021: +15.0% – the largest increase (+$9,430)
> Median household income: $72,431 in 2021; $63,001 in 2019
> Population change, 2019-2021: +3.5% – 4th largest increase (+21,581)
> Population: 645,570 in 2021; 623,989 in 2019

25. Indiana
> Change in median home value, 2019-2021: +16.9% (+$26,400)
> Median home value: $182,400 in 2021; $156,000 in 2019
> Change in median household income, 2019-2021: +8.9% – 8th largest increase (+$5,140)
> Median household income: $62,743 in 2021; $57,603 in 2019
> Population change, 2019-2021: +1.1% – 15th smallest increase (+73,766)
> Population: 6,805,985 in 2021; 6,732,219 in 2019
[in-text-ad]

24. Wisconsin
> Change in median home value, 2019-2021: +17.0% (+$33,500)
> Median home value: $230,700 in 2021; $197,200 in 2019
> Change in median household income, 2019-2021: +4.6% – 19th smallest increase (+$2,957)
> Median household income: $67,125 in 2021; $64,168 in 2019
> Population change, 2019-2021: +1.3% – 24th largest increase (+73,474)
> Population: 5,895,908 in 2021; 5,822,434 in 2019

23. Nevada
> Change in median home value, 2019-2021: +17.4% (+$55,200)
> Median home value: $373,000 in 2021; $317,800 in 2019
> Change in median household income, 2019-2021: +4.7% – 20th smallest increase (+$2,998)
> Median household income: $66,274 in 2021; $63,276 in 2019
> Population change, 2019-2021: +2.1% – 12th largest increase (+63,835)
> Population: 3,143,991 in 2021; 3,080,156 in 2019

22. Michigan
> Change in median home value, 2019-2021: +17.4% (+$29,500)
> Median home value: $199,100 in 2021; $169,600 in 2019
> Change in median household income, 2019-2021: +6.6% – 17th largest increase (+$3,914)
> Median household income: $63,498 in 2021; $59,584 in 2019
> Population change, 2019-2021: +0.6% – 6th smallest increase (+63,954)
> Population: 10,050,811 in 2021; 9,986,857 in 2019
[in-text-ad-2]

21. Missouri
> Change in median home value, 2019-2021: +18.0% (+$30,300)
> Median home value: $198,300 in 2021; $168,000 in 2019
> Change in median household income, 2019-2021: +7.7% – 11th largest increase (+$4,438)
> Median household income: $61,847 in 2021; $57,409 in 2019
> Population change, 2019-2021: +0.5% – 4th smallest increase (+30,759)
> Population: 6,168,187 in 2021; 6,137,428 in 2019

20. Colorado
> Change in median home value, 2019-2021: +18.1% (+$71,600)
> Median home value: $466,200 in 2021; $394,600 in 2019
> Change in median household income, 2019-2021: +6.6% – 16th largest increase (+$5,127)
> Median household income: $82,254 in 2021; $77,127 in 2019
> Population change, 2019-2021: +0.9% – 13th smallest increase (+53,333)
> Population: 5,812,069 in 2021; 5,758,736 in 2019
[in-text-ad]

19. New Mexico
> Change in median home value, 2019-2021: +18.3% (+$33,100)
> Median home value: $214,000 in 2021; $180,900 in 2019
> Change in median household income, 2019-2021: +3.9% – 10th smallest increase (+$2,047)
> Median household income: $53,992 in 2021; $51,945 in 2019
> Population change, 2019-2021: +0.9% – 12th smallest increase (+19,048)
> Population: 2,115,877 in 2021; 2,096,829 in 2019

18. Texas
> Change in median home value, 2019-2021: +18.5% (+$37,000)
> Median home value: $237,400 in 2021; $200,400 in 2019
> Change in median household income, 2019-2021: +4.6% – 18th smallest increase (+$2,929)
> Median household income: $66,963 in 2021; $64,034 in 2019
> Population change, 2019-2021: +1.8% – 15th largest increase (+532,060)
> Population: 29,527,941 in 2021; 28,995,881 in 2019

17. Florida
> Change in median home value, 2019-2021: +18.6% (+$45,600)
> Median home value: $290,700 in 2021; $245,100 in 2019
> Change in median household income, 2019-2021: +6.5% – 18th largest increase (+$3,835)
> Median household income: $63,062 in 2021; $59,227 in 2019
> Population change, 2019-2021: +1.4% – 21st largest increase (+303,391)
> Population: 21,781,128 in 2021; 21,477,737 in 2019
[in-text-ad-2]

16. Nebraska
> Change in median home value, 2019-2021: +18.6% (+$32,200)
> Median home value: $204,900 in 2021; $172,700 in 2019
> Change in median household income, 2019-2021: +5.7% – 25th smallest increase (+$3,588)
> Median household income: $66,817 in 2021; $63,229 in 2019
> Population change, 2019-2021: +1.5% – 20th largest increase (+29,284)
> Population: 1,963,692 in 2021; 1,934,408 in 2019

15. South Carolina
> Change in median home value, 2019-2021: +18.7% (+$33,700)
> Median home value: $213,500 in 2021; $179,800 in 2019
> Change in median household income, 2019-2021: +5.5% – 23rd smallest increase (+$3,091)
> Median household income: $59,318 in 2021; $56,227 in 2019
> Population change, 2019-2021: +0.8% – 11th smallest increase (+41,991)
> Population: 5,190,705 in 2021; 5,148,714 in 2019
[in-text-ad]

14. South Dakota
> Change in median home value, 2019-2021: +18.9% (+$34,900)
> Median home value: $219,900 in 2021; $185,000 in 2019
> Change in median household income, 2019-2021: +11.1% – 4th largest increase (+$6,610)
> Median household income: $66,143 in 2021; $59,533 in 2019
> Population change, 2019-2021: +1.2% – 19th smallest increase (+10,717)
> Population: 895,376 in 2021; 884,659 in 2019

13. Arkansas
> Change in median home value, 2019-2021: +19.2% (+$26,100)
> Median home value: $162,300 in 2021; $136,200 in 2019
> Change in median household income, 2019-2021: +7.3% – 13th largest increase (+$3,576)
> Median household income: $52,528 in 2021; $48,952 in 2019
> Population change, 2019-2021: +0.3% – 3rd smallest increase (+8,087)
> Population: 3,025,891 in 2021; 3,017,804 in 2019

12. Oregon
> Change in median home value, 2019-2021: +19.2% (+$68,100)
> Median home value: $422,700 in 2021; $354,600 in 2019
> Change in median household income, 2019-2021: +6.7% – 15th largest increase (+$4,504)
> Median household income: $71,562 in 2021; $67,058 in 2019
> Population change, 2019-2021: +0.7% – 7th smallest increase (+28,418)
> Population: 4,246,155 in 2021; 4,217,737 in 2019
[in-text-ad-2]

11. Tennessee
> Change in median home value, 2019-2021: +22.6% (+$43,300)
> Median home value: $235,200 in 2021; $191,900 in 2019
> Change in median household income, 2019-2021: +6.5% – 19th largest increase (+$3,624)
> Median household income: $59,695 in 2021; $56,071 in 2019
> Population change, 2019-2021: +2.1% – 10th largest increase (+146,044)
> Population: 6,975,218 in 2021; 6,829,174 in 2019

10. North Carolina
> Change in median home value, 2019-2021: +22.6% (+$43,700)
> Median home value: $236,900 in 2021; $193,200 in 2019
> Change in median household income, 2019-2021: +8.1% – 10th largest increase (+$4,631)
> Median household income: $61,972 in 2021; $57,341 in 2019
> Population change, 2019-2021: +0.6% – 5th smallest increase (+63,078)
> Population: 10,551,162 in 2021; 10,488,084 in 2019
[in-text-ad]

9. New Hampshire
> Change in median home value, 2019-2021: +22.7% (+$63,800)
> Median home value: $345,200 in 2021; $281,400 in 2019
> Change in median household income, 2019-2021: +13.5% – 2nd largest increase (+$10,532)
> Median household income: $88,465 in 2021; $77,933 in 2019
> Population change, 2019-2021: +2.2% – 9th largest increase (+29,281)
> Population: 1,388,992 in 2021; 1,359,711 in 2019

8. Rhode Island
> Change in median home value, 2019-2021: +23.0% (+$65,100)
> Median home value: $348,100 in 2021; $283,000 in 2019
> Change in median household income, 2019-2021: +4.0% – 11th smallest increase (+$2,839)
> Median household income: $74,008 in 2021; $71,169 in 2019
> Population change, 2019-2021: +3.4% – 5th largest increase (+36,249)
> Population: 1,095,610 in 2021; 1,059,361 in 2019

7. Georgia
> Change in median home value, 2019-2021: +23.3% (+$47,200)
> Median home value: $249,700 in 2021; $202,500 in 2019
> Change in median household income, 2019-2021: +7.4% – 12th largest increase (+$4,579)
> Median household income: $66,559 in 2021; $61,980 in 2019
> Population change, 2019-2021: +1.7% – 17th largest increase (+182,143)
> Population: 10,799,566 in 2021; 10,617,423 in 2019
[in-text-ad-2]

6. Washington
> Change in median home value, 2019-2021: +25.3% (+$98,100)
> Median home value: $485,700 in 2021; $387,600 in 2019
> Change in median household income, 2019-2021: +7.1% – 14th largest increase (+$5,560)
> Median household income: $84,247 in 2021; $78,687 in 2019
> Population change, 2019-2021: +1.6% – 19th largest increase (+123,799)
> Population: 7,738,692 in 2021; 7,614,893 in 2019

5. Maine
> Change in median home value, 2019-2021: +25.7% (+$51,600)
> Median home value: $252,100 in 2021; $200,500 in 2019
> Change in median household income, 2019-2021: +9.9% – 6th largest increase (+$5,843)
> Median household income: $64,767 in 2021; $58,924 in 2019
> Population change, 2019-2021: +2.1% – 11th largest increase (+28,035)
> Population: 1,372,247 in 2021; 1,344,212 in 2019
[in-text-ad]

4. Montana
> Change in median home value, 2019-2021: +27.3% (+$69,200)
> Median home value: $322,800 in 2021; $253,600 in 2019
> Change in median household income, 2019-2021: +10.7% – 5th largest increase (+$6,096)
> Median household income: $63,249 in 2021; $57,153 in 2019
> Population change, 2019-2021: +3.3% – 6th largest increase (+35,493)
> Population: 1,104,271 in 2021; 1,068,778 in 2019

3. Utah
> Change in median home value, 2019-2021: +27.7% (+$91,400)
> Median home value: $421,700 in 2021; $330,300 in 2019
> Change in median household income, 2019-2021: +4.8% – 21st smallest increase (+$3,669)
> Median household income: $79,449 in 2021; $75,780 in 2019
> Population change, 2019-2021: +4.1% – 3rd largest increase (+132,017)
> Population: 3,337,975 in 2021; 3,205,958 in 2019

2. Arizona
> Change in median home value, 2019-2021: +31.4% (+$80,400)
> Median home value: $336,300 in 2021; $255,900 in 2019
> Change in median household income, 2019-2021: +11.3% – 3rd largest increase (+$7,001)
> Median household income: $69,056 in 2021; $62,055 in 2019
> Population change, 2019-2021: -0.0% – 5th largest decrease (-2,401)
> Population: 7,276,316 in 2021; 7,278,717 in 2019
[in-text-ad-2]

1. Idaho
> Change in median home value, 2019-2021: +44.7% (+$114,100)
> Median home value: $369,300 in 2021; $255,200 in 2019
> Change in median household income, 2019-2021: +9.0% – 7th largest increase (+$5,475)
> Median household income: $66,474 in 2021; $60,999 in 2019
> Population change, 2019-2021: +6.4% – the largest increase (+113,858)
> Population: 1,900,923 in 2021; 1,787,065 in 2019
Get Ready To Retire (Sponsored)
Start by taking a quick retirement quiz from SmartAsset that will match you with up to 3 financial advisors that serve your area and beyond in 5 minutes, or less.
Each advisor has been vetted by SmartAsset and is held to a fiduciary standard to act in your best interests.
Here’s how it works:
1. Answer SmartAsset advisor match quiz
2. Review your pre-screened matches at your leisure. Check out the advisors’ profiles.
3. Speak with advisors at no cost to you. Have an introductory call on the phone or introduction in person and choose whom to work with in the future
Thank you for reading! Have some feedback for us?
Contact the 24/7 Wall St. editorial team.

 24/7 Wall St.
 24/7 Wall St.
 24/7 Wall St.
 24/7 Wall St.

