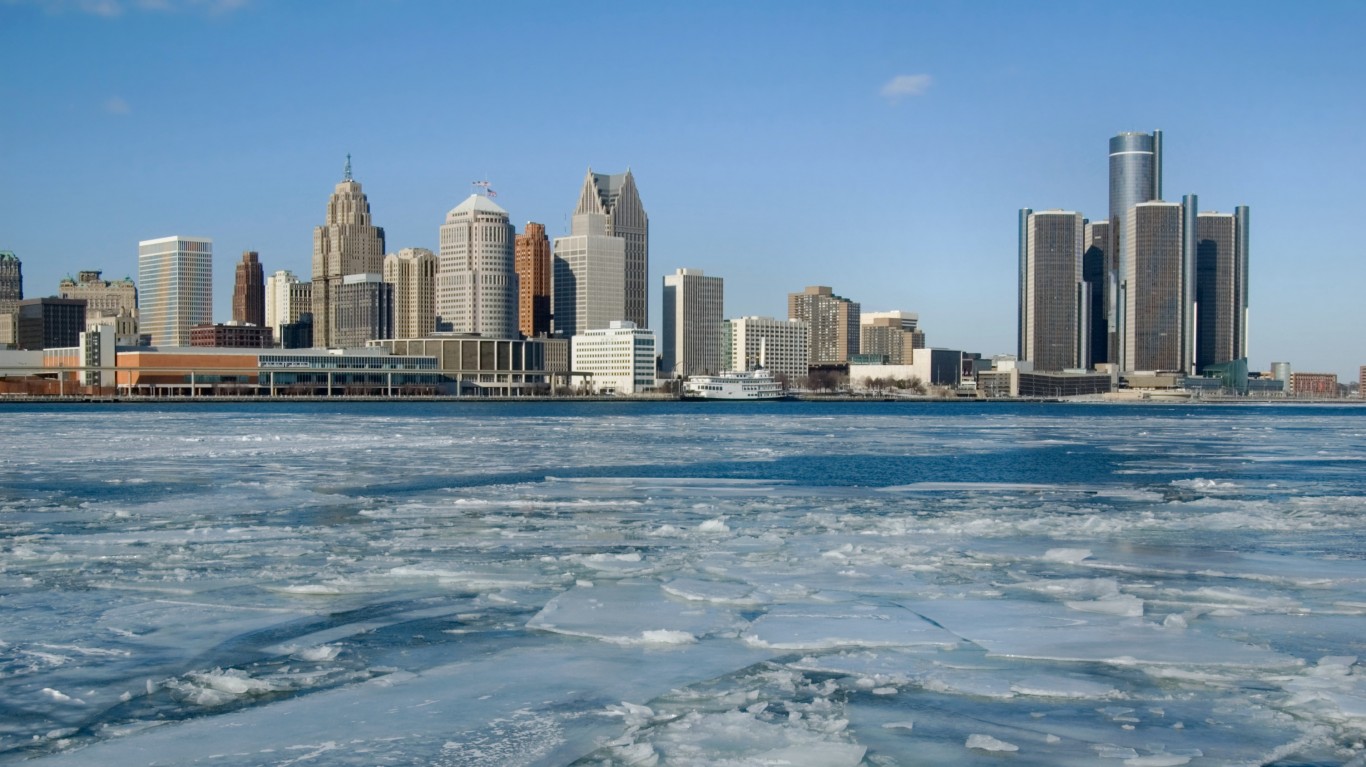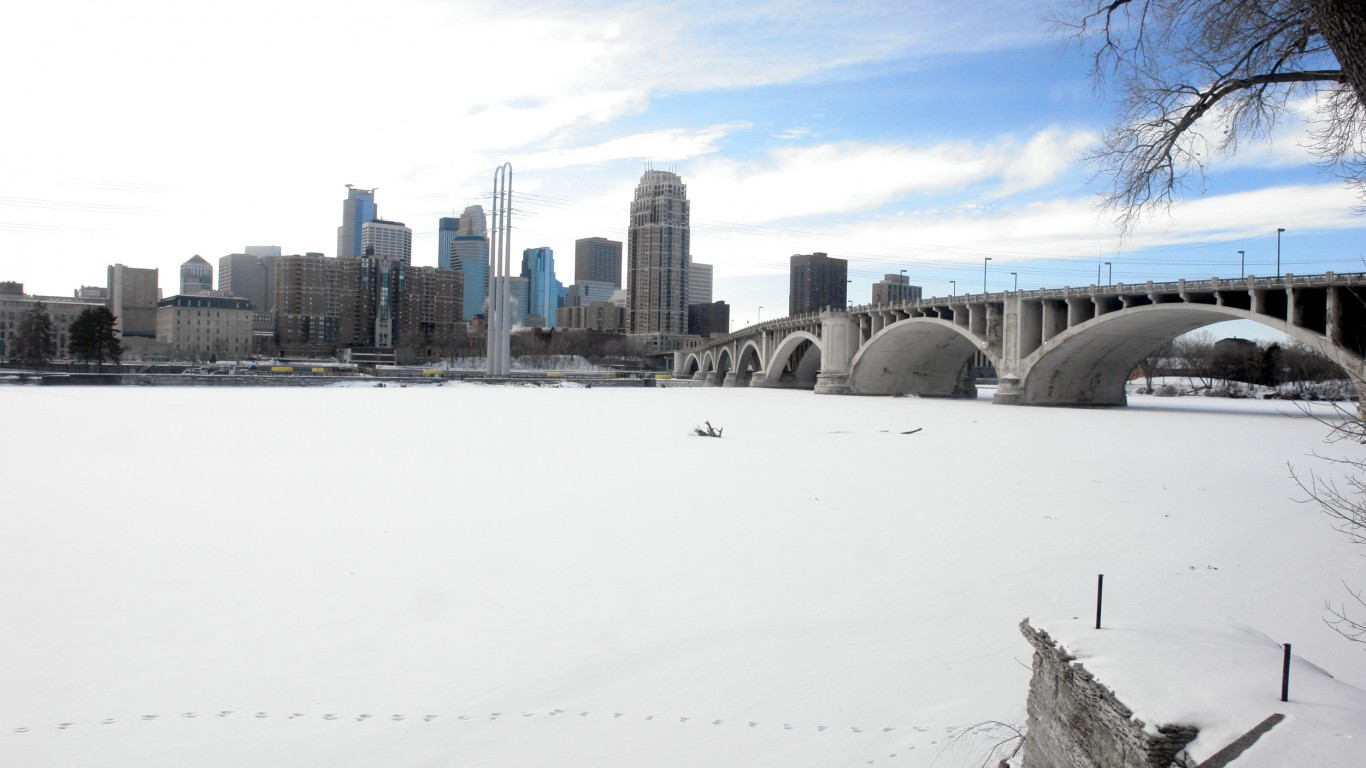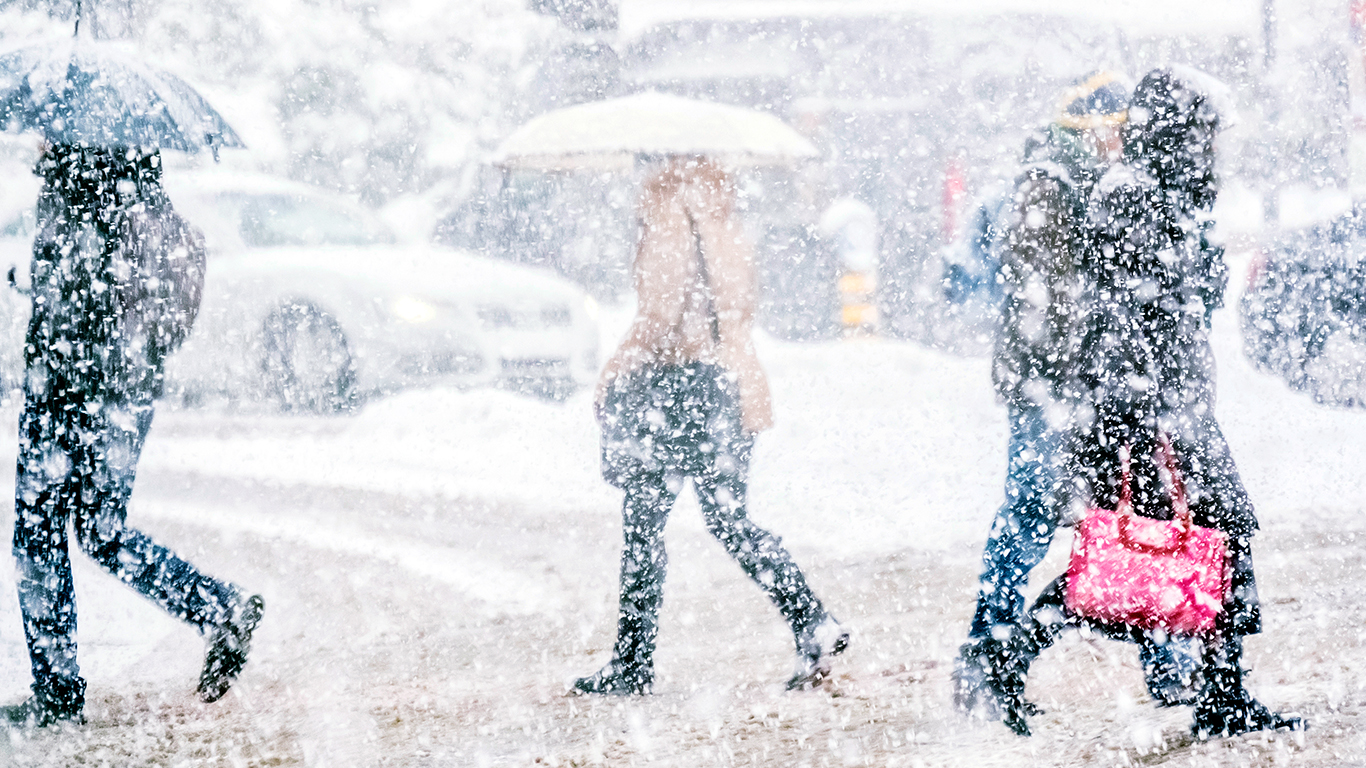
A powerful snowstorm moved through the northeast this week, shutting down travel and commerce in several states. Places in higher elevations experienced several feet of snow, while other areas were blanketed in a wintery mix that made travel highly dangerous.
Blizzard activity in the U.S. has steadily increased in frequency over the last several decades. According to a recent study published in the January 2017 issue of the Journal of Applied Meteorology and Climate, the number of blizzards has climbed to about 22 as of 2014 from an average of six per season in 1959. The study also found that the area with the most blizzard activity is the northern Great Plains. North Dakota, sections of northern South Dakota and northwestern Minnesota have a more than a 60% chance of getting at least one blizzard a year.
Unlike hurricanes and earthquakes, there is no widely used index for assessing the impact of snowstorms. In recent years, however, the meteorological community has made several successful attempts to establish a standard for measuring the impact of extreme snow events and their historical importance. The Regional Snowfall Index, introduced in 2014, ranks snowstorm impacts on a scale of 1 to 5 using data on a storm’s area of snowfall, the amount of snowfall, and the number of people living in the storm. The RSI has since been used to retroactively classify nearly 600 snowstorms.
To determine the worst blizzards of all time, 24/7 Wall St. ranked snowstorms based on their Regional Snowfall Index values, published by the National Oceanic and Atmospheric Administration’s National Centers for Environmental Information. We included the 25 snowstorms designated as Category 5 since 1900. Data on duration, region, affected area, and affected population also came from the NOAA. Data on affected area and population for Category 5 storms that spanned multiple regions were combined and considered one event. Storm names, as well as measures of snowfall in the affected areas, came from various news and media sources.
Click here to see the worst blizzards of all time.
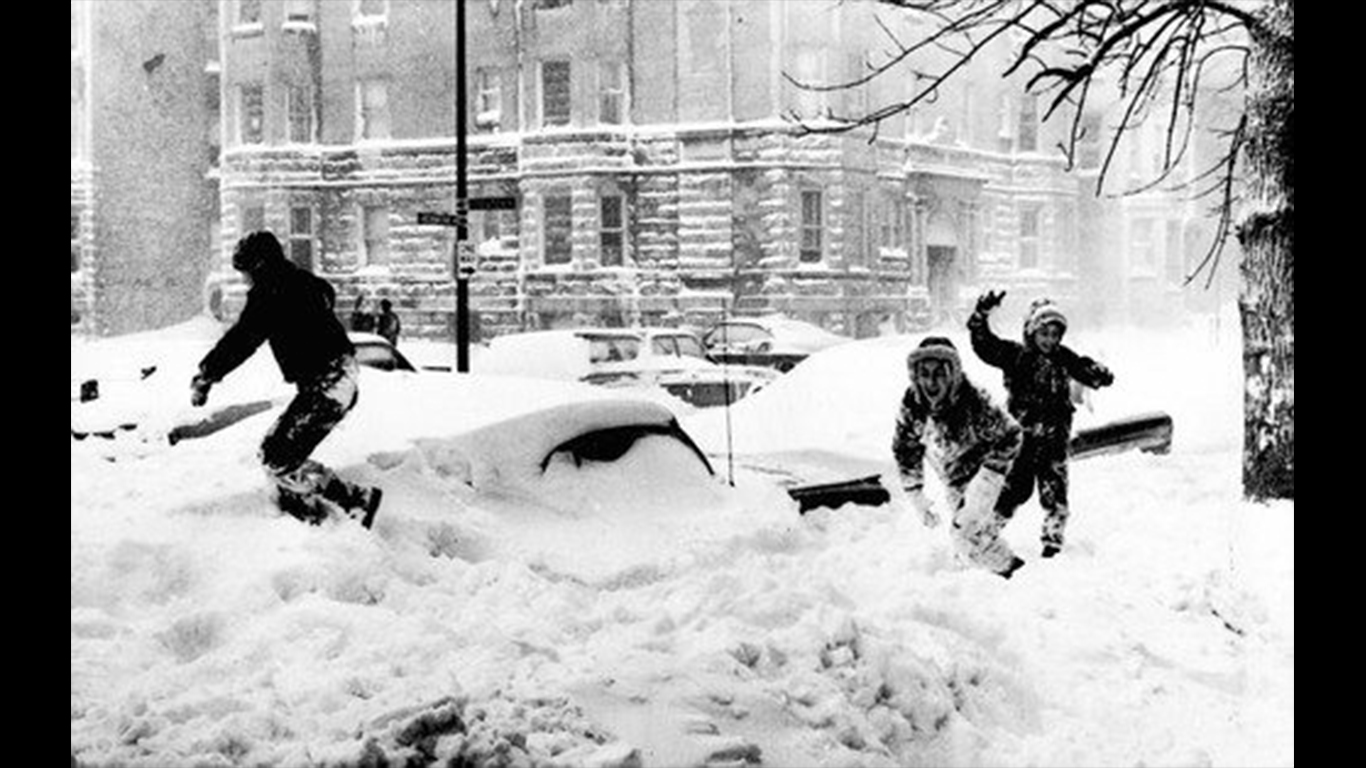
25. The Chicago Blizzard of 1967
> Duration: Jan. 25, 1967 – Jan. 29, 1967
> Region: Ohio Valley
> Affected area: 286,503 square miles
> Population affected: 46.1 million
> Notable snowfall: 23 inches (Chicago, IL)
[in-text-ad]
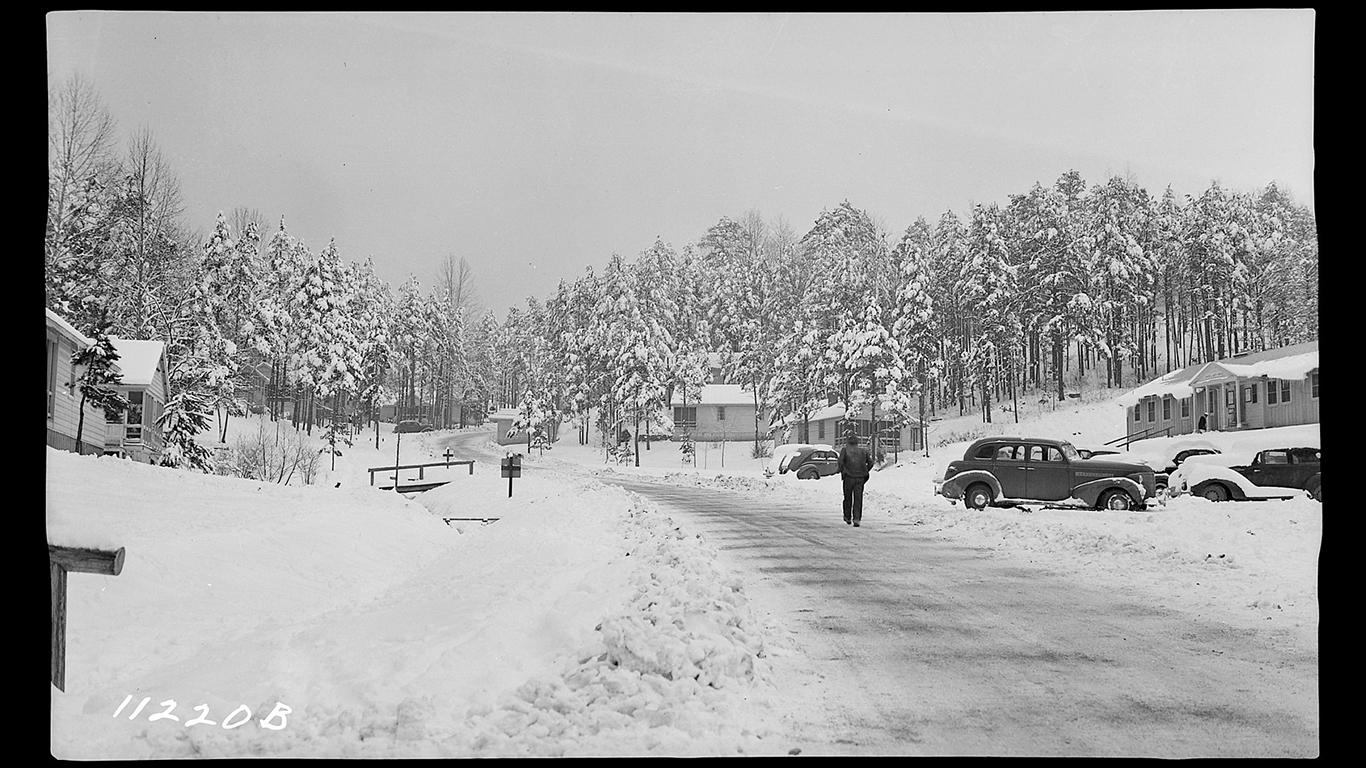
24. The Great Atlanta Blizzard
> Duration: Jan. 21, 1940 – Jan. 24, 1940
> Region: Southeast
> Affected area: 214,946 square miles
> Population affected: 35.6 million
> Notable snowfall: 21.6 inches (Richmond, VA)
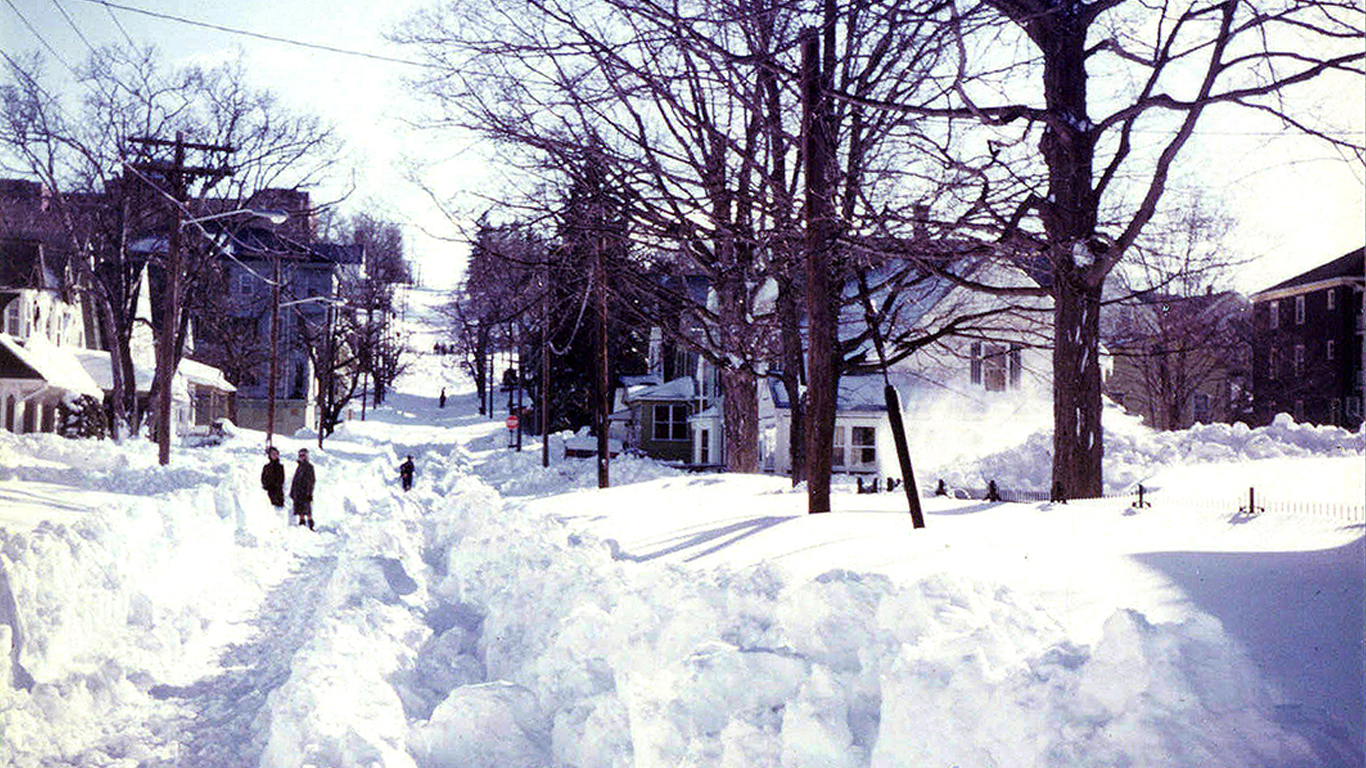
23. The Blizzard of 1978
> Duration: Feb. 4, 1978 – Feb. 8, 1978
> Region: Northeast
> Affected area: 174,950 square miles
> Population affected: 58.9 million
> Notable snowfall: 55 inches (Lincoln, RI)
[in-text-ad-2]
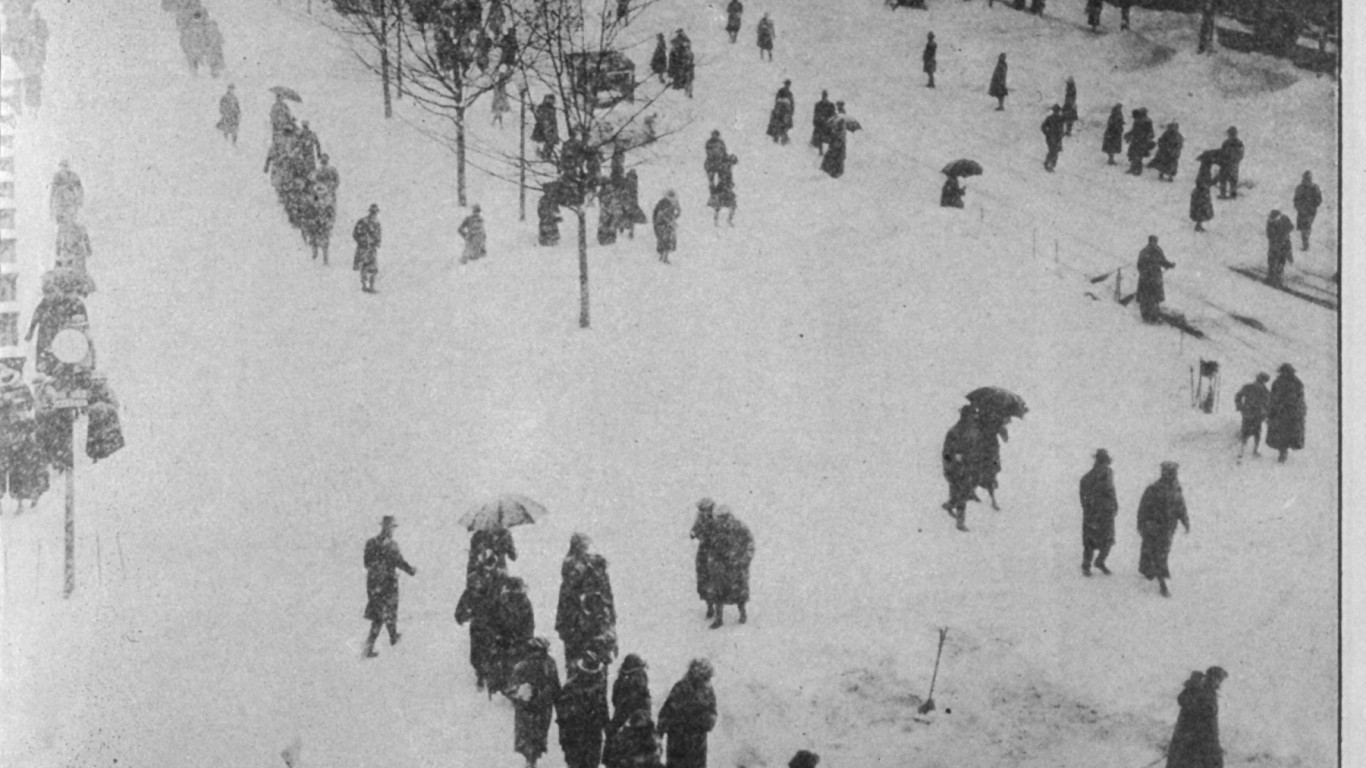
22. The Knickerbocker Storm
> Duration: Jan. 26, 1922 – Jan. 30, 1922
> Region: Southeast
> Affected area: 150,041 square miles
> Population affected: 30.1 million
> Notable snowfall: 28 inches (Washington, D.C.)
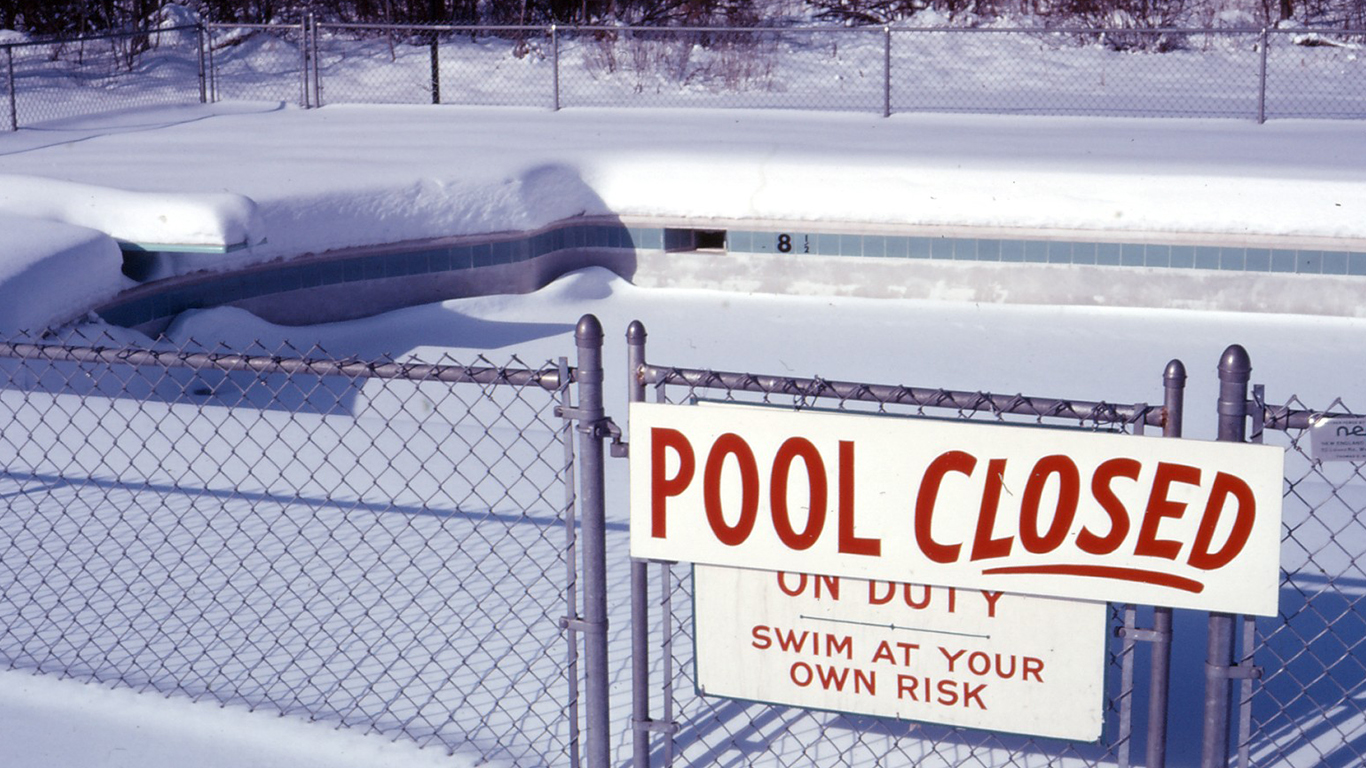
21. The Blizzard of 1971
> Duration: Feb. 19, 1971 – Feb. 24, 1971
> Region: South
> Affected area: 261,324 square miles
> Population affected: 10.5 million
> Notable snowfall: N/A
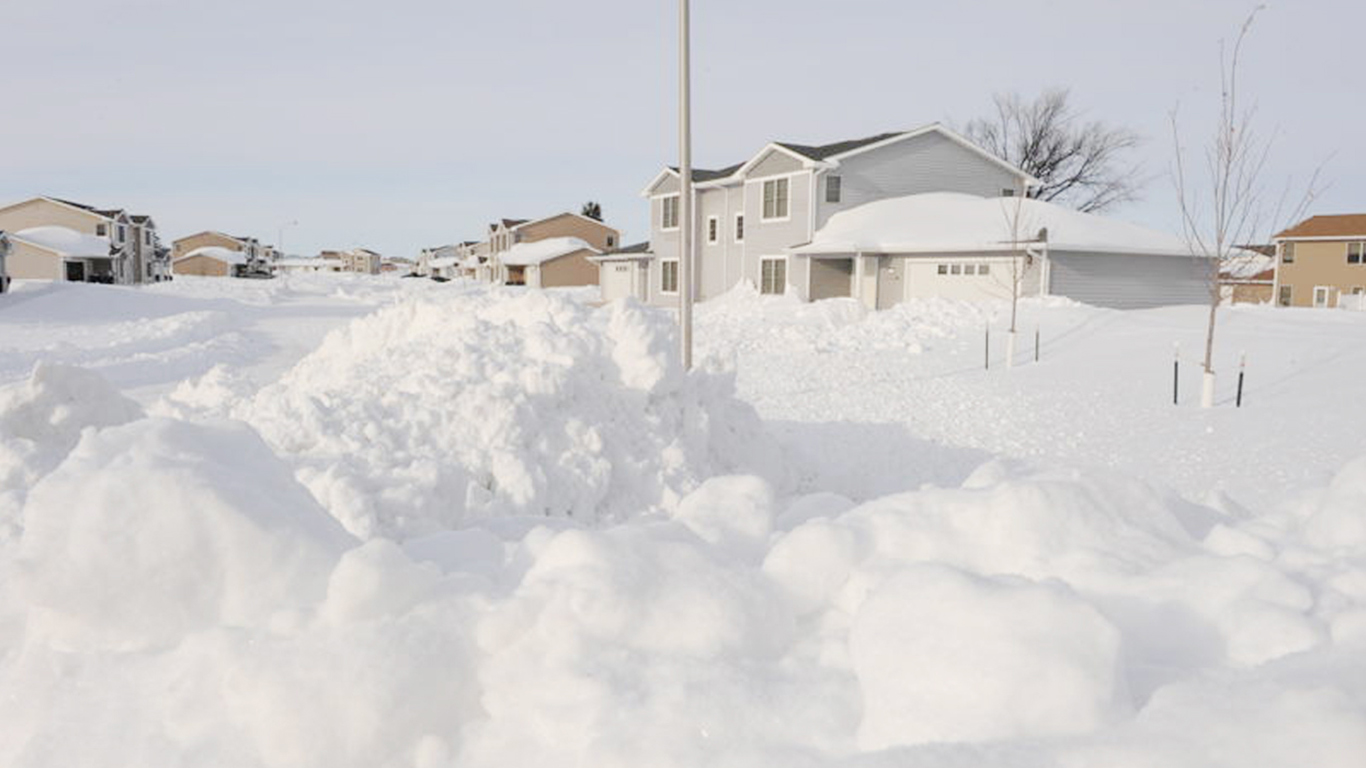
20. The 2009 Christmas Blizzard
> Duration: Dec. 22, 2009 – Dec. 29, 2009
> Region: Northern Rockies and Plains
> Affected area: 466,690 square miles
> Population affected: 4.8 million
> Notable snowfall: 15.7 inches (Osceola, NE)
[in-text-ad]
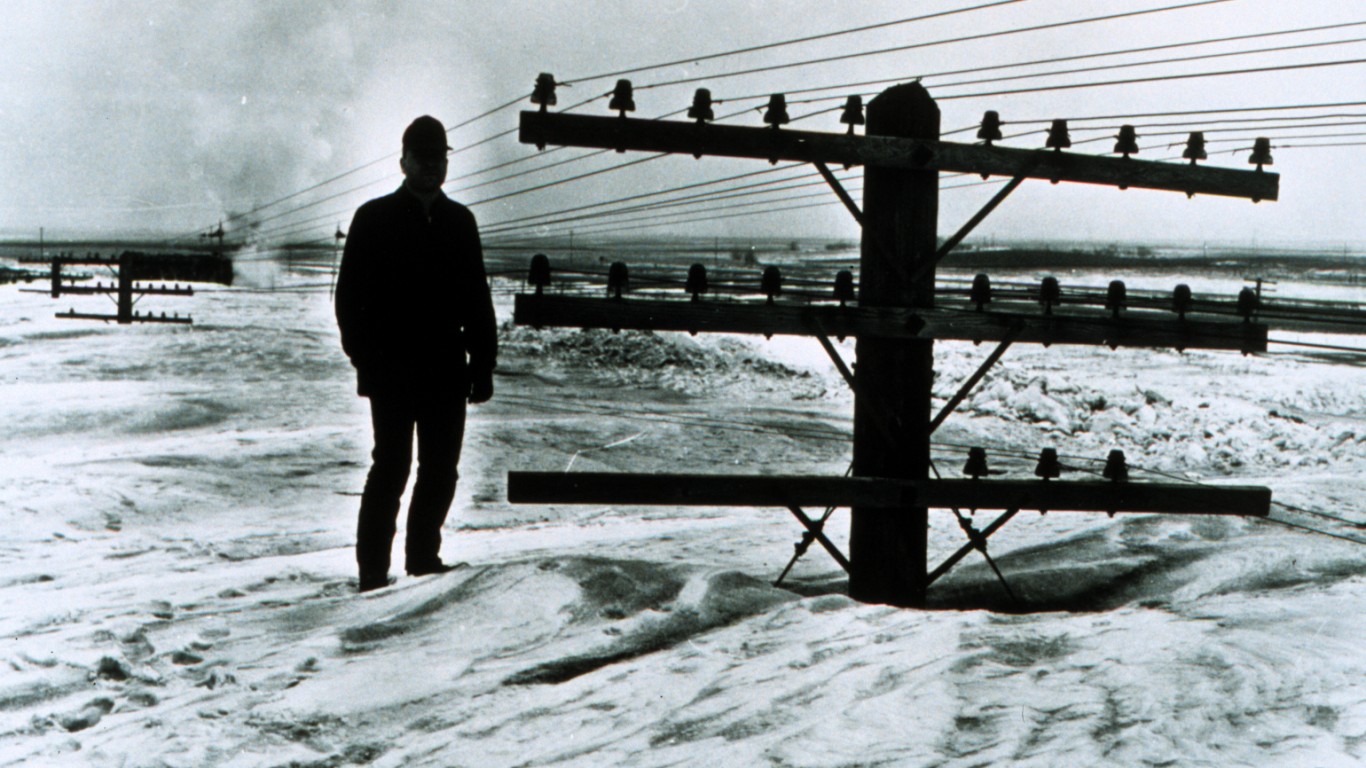
19. The Blizzard of 1966
> Duration: Feb. 28, 1966 – Mar. 6, 1966
> Region: Northern Rockies and Plains
> Affected area: 466,796 square miles
> Population affected: 4.8 million
> Notable snowfall: 30.5 inches (Devils Lake, ND)
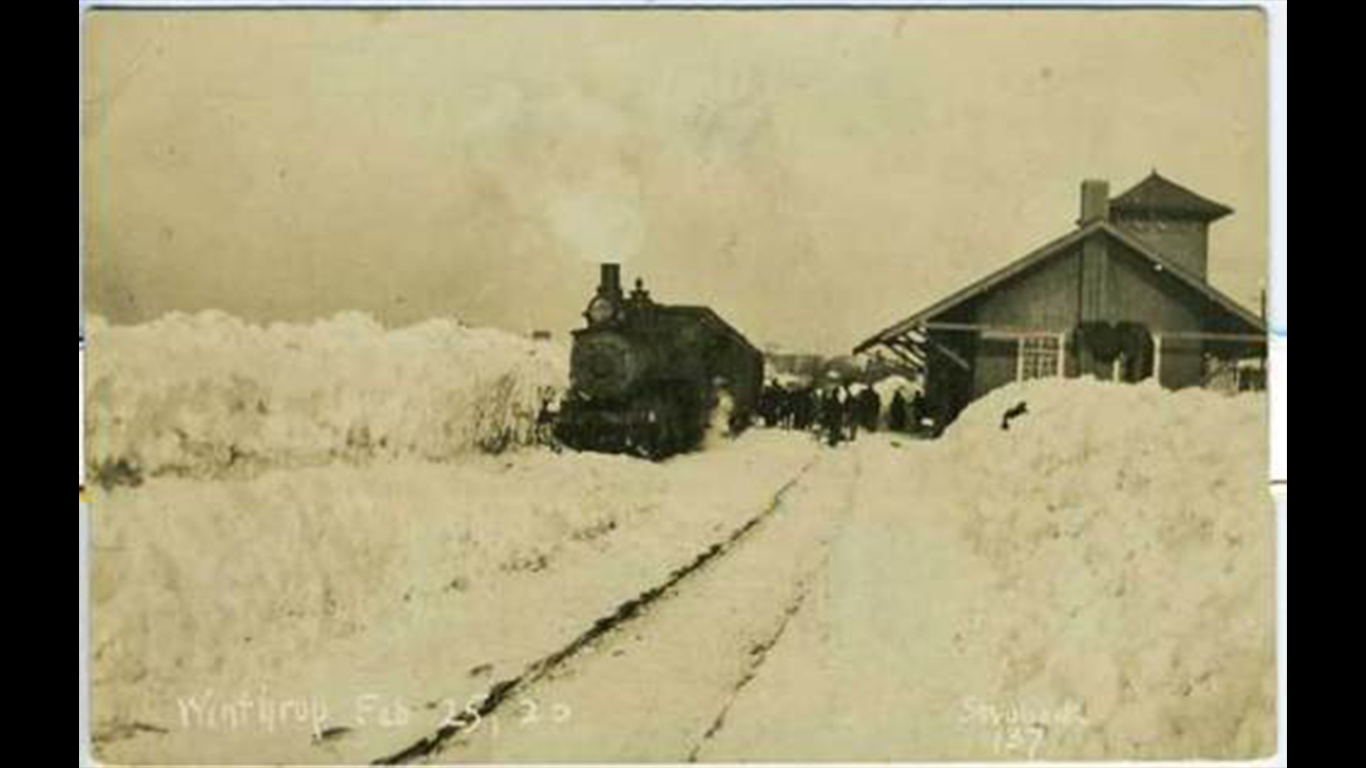
18. The Blizzard of 1920
> Duration: Apr. 15, 1920 – Apr. 19, 1920
> Region: Northern Rockies and Plains
> Affected area: 350,813 square miles
> Population affected: 2.4 million
> Notable snowfall: 28.3 inches (Denver, CO)
[in-text-ad-2]
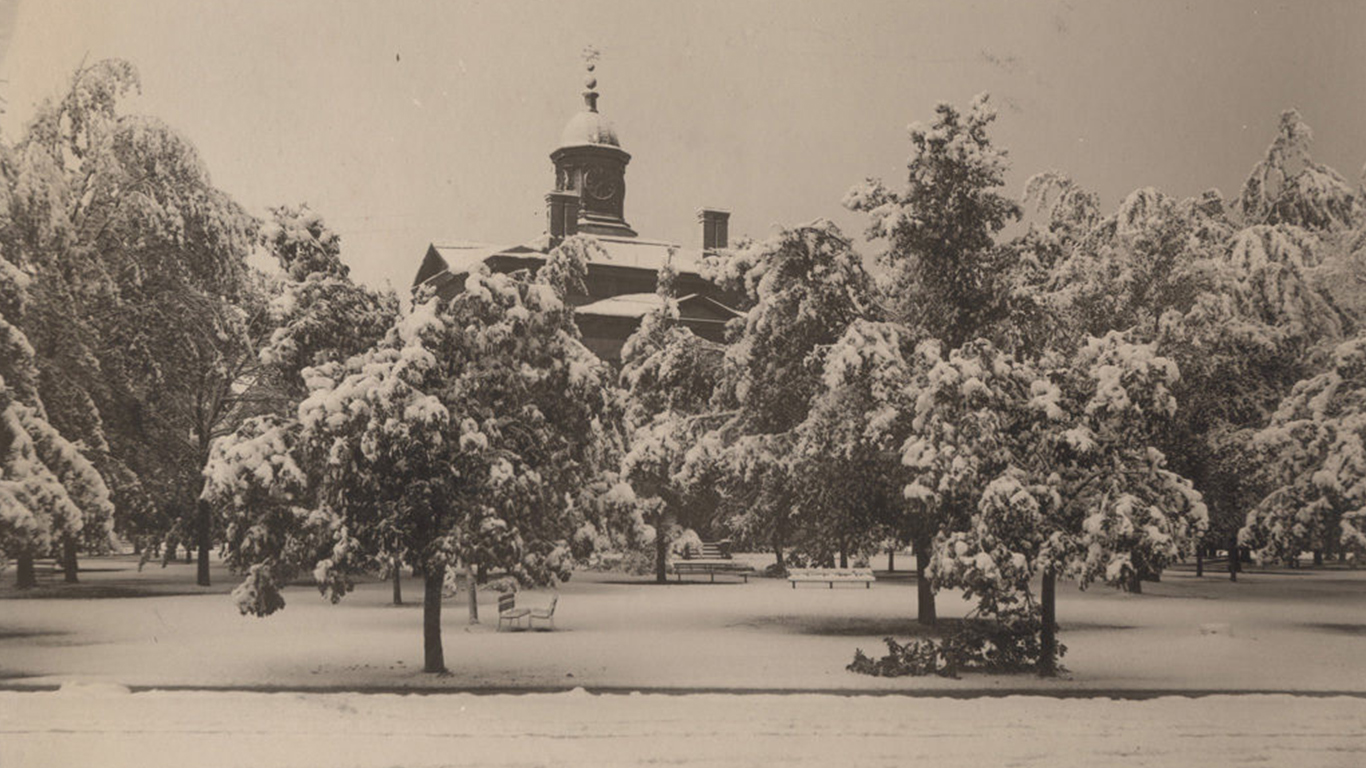
17. The Historic Texas Snowstorm
> Duration: Dec. 19, 1929 – Dec. 24, 1929
> Region: South
> Affected area: 380,488 square miles
> Population affected: 31.2 million
> Notable snowfall: 26 inches (Hillsboro, TX)
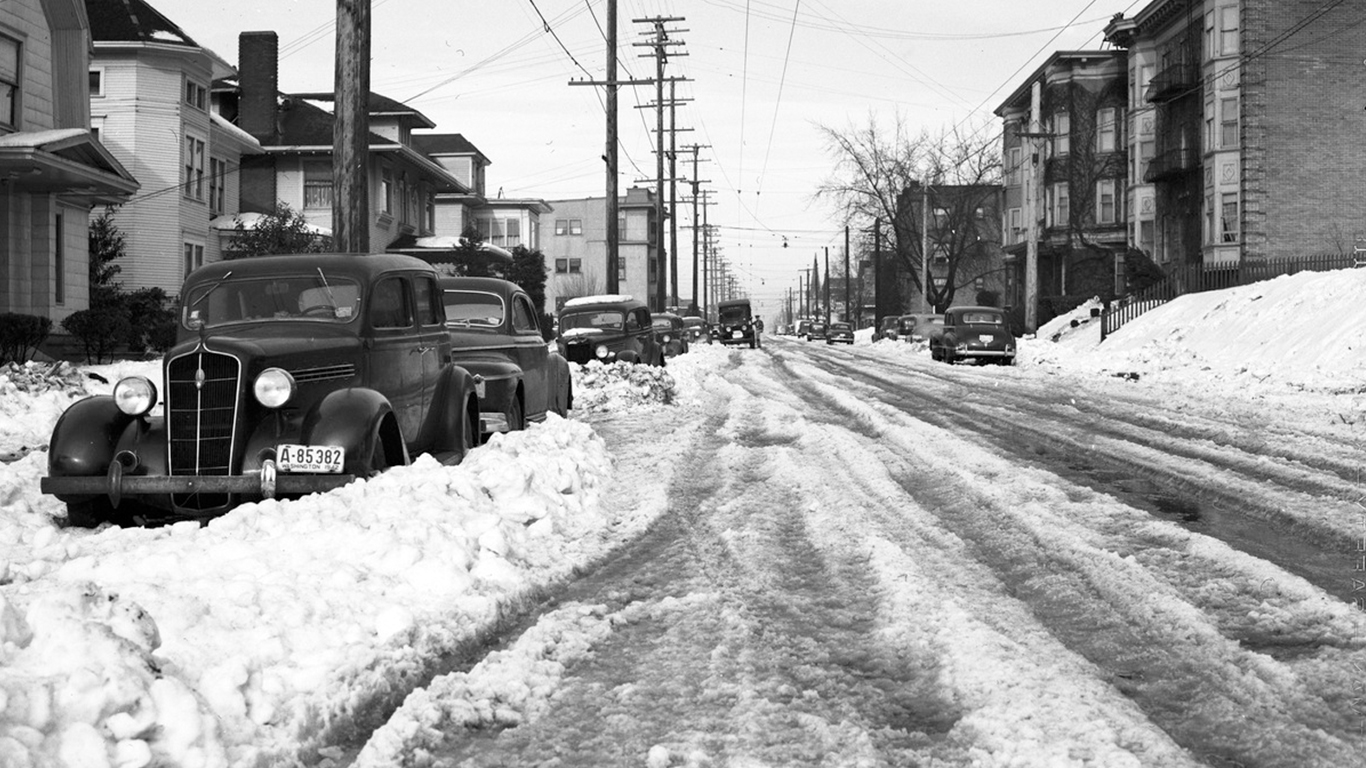
16. The Blizzard of 1943
> Duration: Jan. 19, 1943 – Jan. 26, 1943
> Region: Northern Rockies and Plains
> Affected area: 358,424 square miles
> Population affected: 3.1 million
> Notable snowfall: 14.4 inches (Portland, OR)
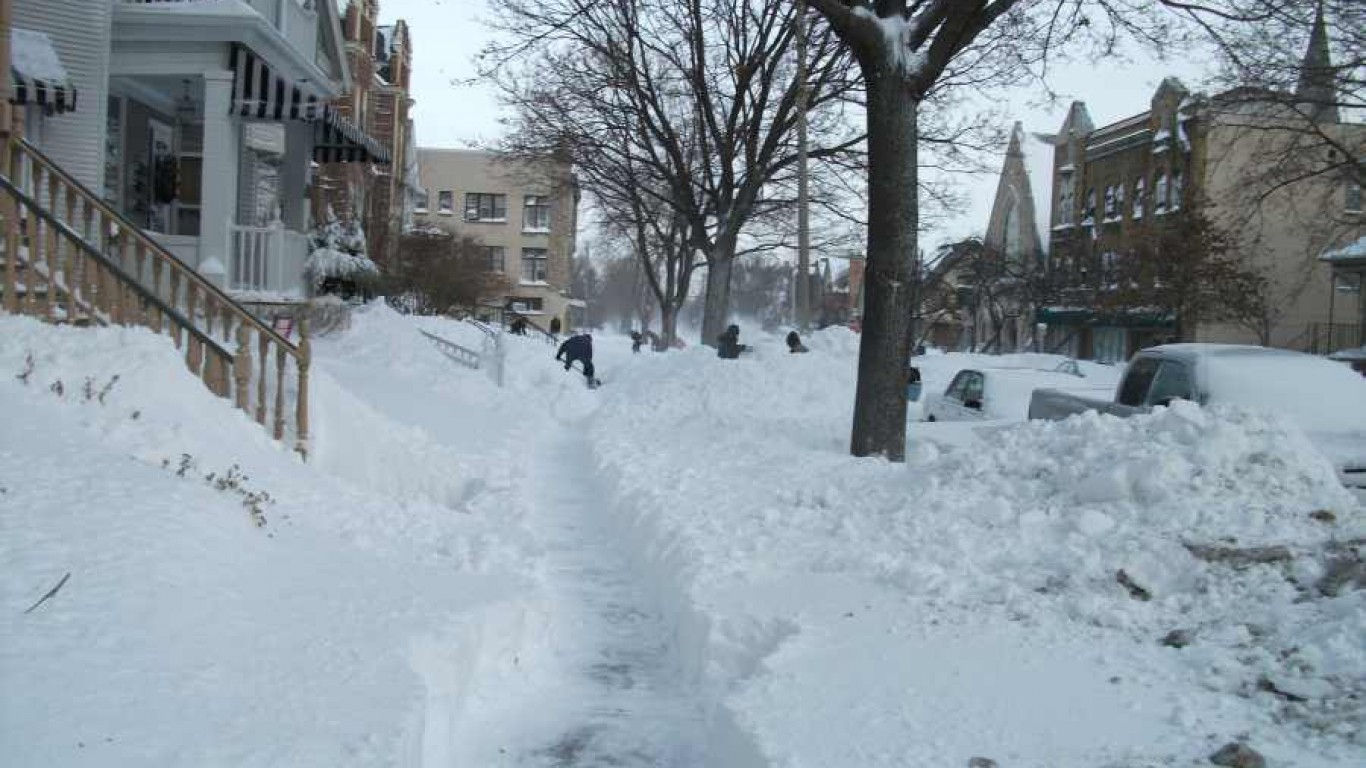
15. The Groundhog Day Blizzard
> Duration: Feb. 1, 2011 – Feb. 4, 2011
> Region: Ohio Valley
> Affected area: 241,595 square miles
> Population affected: 41.3 million
> Notable snowfall: 23.5 inches (Racine, WI)
[in-text-ad]
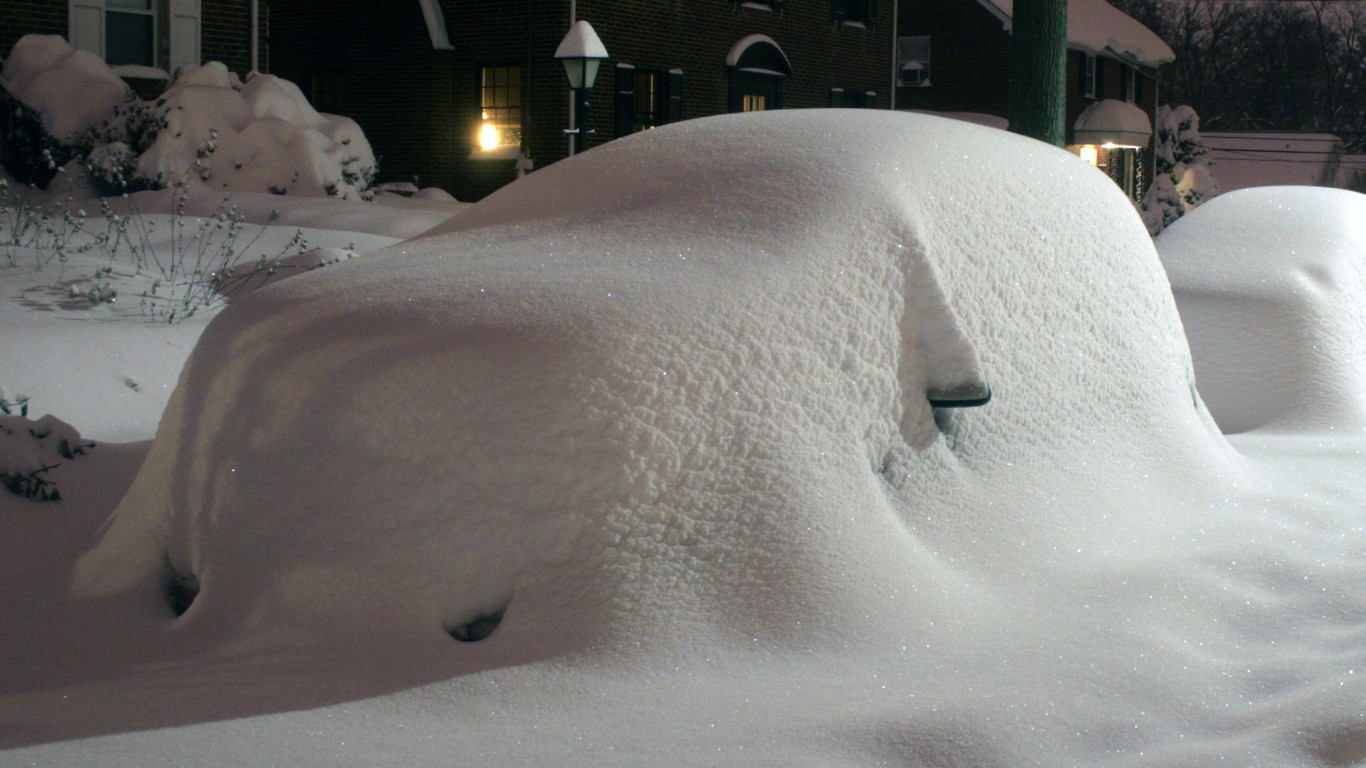
14. The Blizzard of 1993
> Duration: Nov. 21, 1993 – Nov. 29, 1993
> Region: Northern Rockies and Plains
> Affected area: 468,083 square miles
> Population affected: 4.8 million
> Notable snowfall: NA
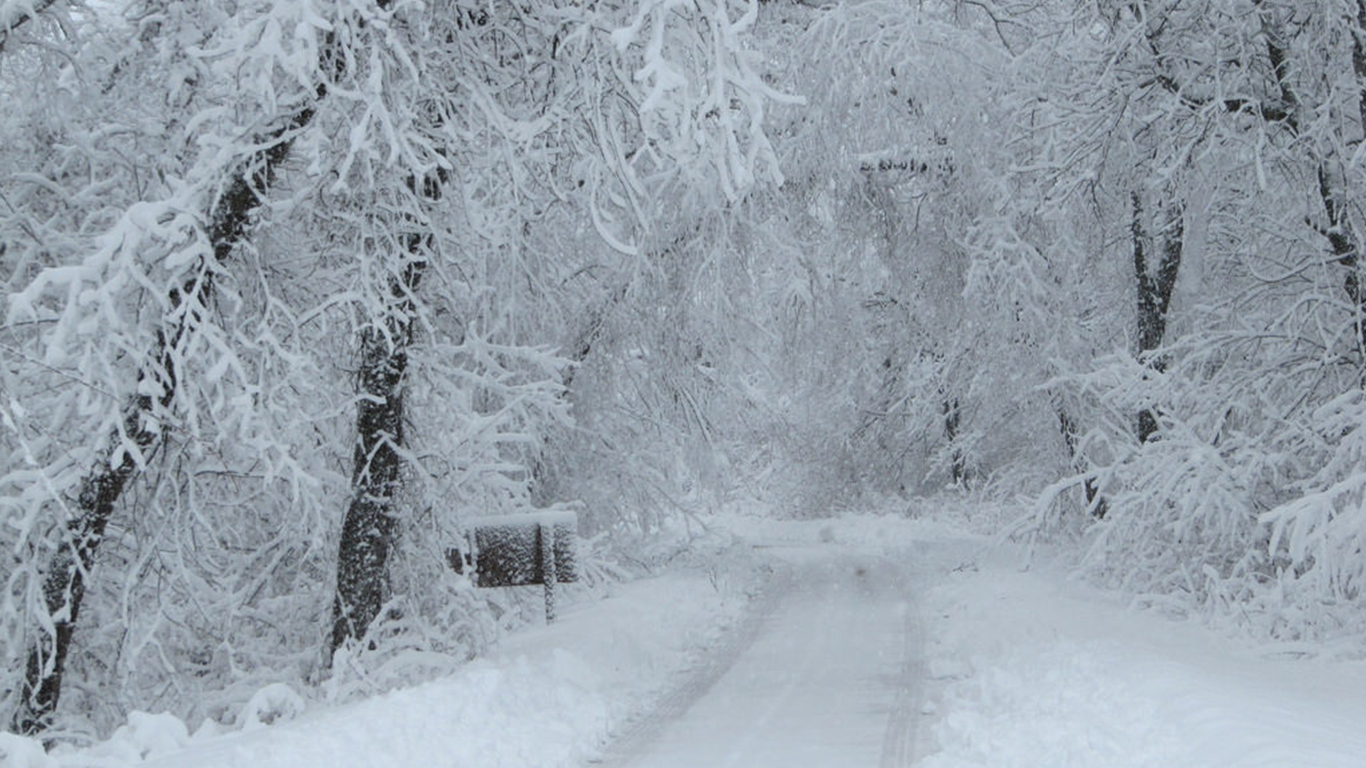
13. The Post-Thanksgiving Day Storm of 1985
> Duration: Nov. 28, 1985 – Dec. 2, 1985
> Region: Upper Midwest
> Affected area: 251,618 square miles
> Population affected: 23.9 million
> Notable snowfall: 30 inches (Marquette, WI)
[in-text-ad-2]
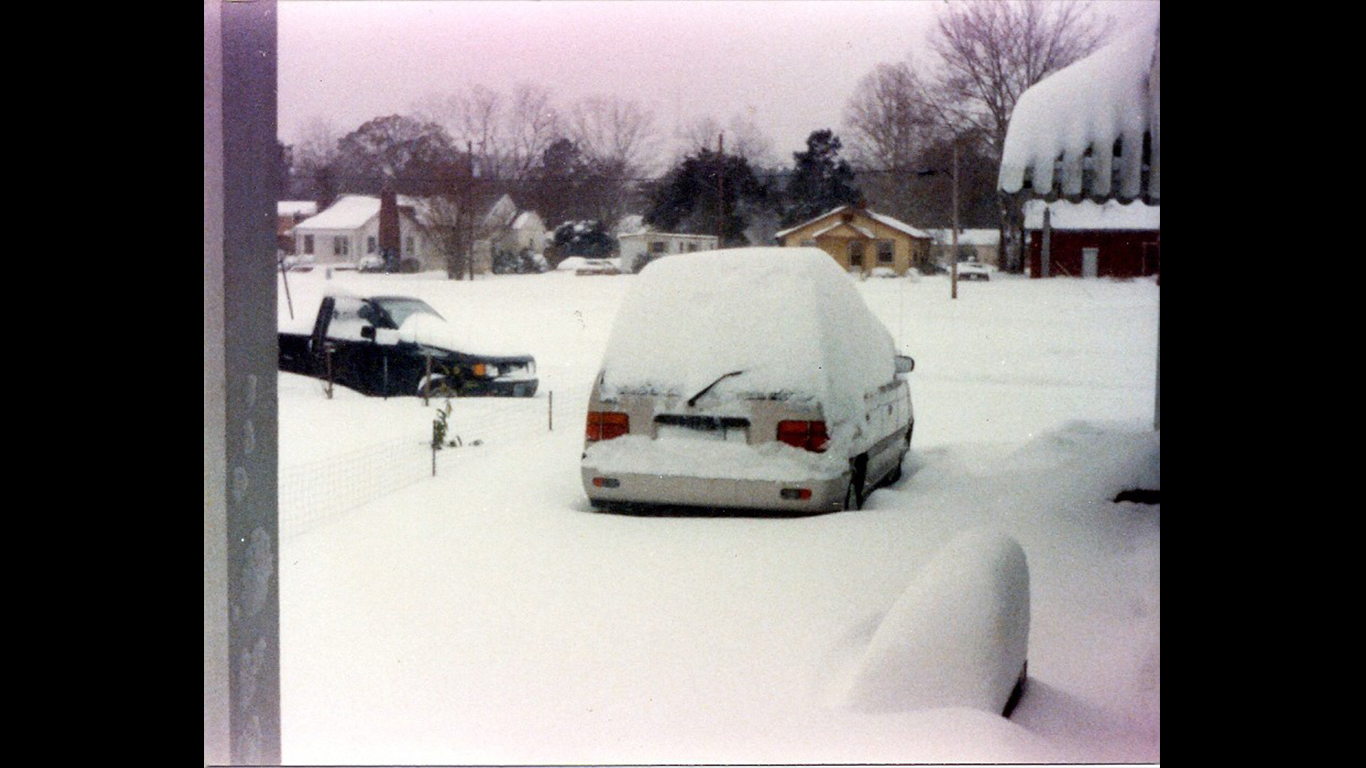
12. The Blizzard of 1988
> Duration: Jan. 5, 1988 – Jan. 9, 1988
> Region: South
> Affected area: 369,821 square miles
> Population affected: 22.3 million
> Notable snowfall: 20 inches (Macon County, NC)
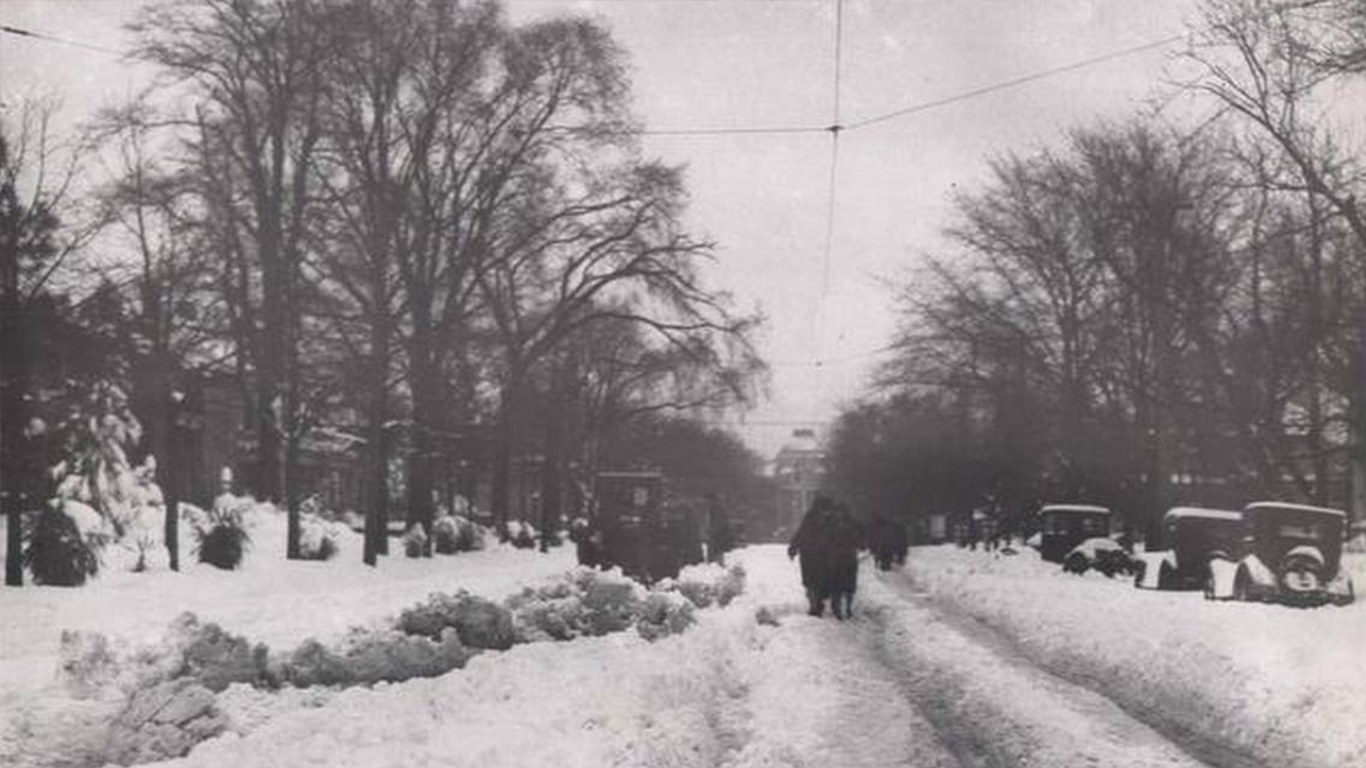
11. The Blizzard of 1927, Southeastern United States
> Duration: Feb. 27, 1927 – Mar. 3, 1927
> Region: Southeast
> Affected area: 142,285 square miles
> Population affected: 26.5 million
> Notable snowfall: 30-40 inches (Wilson, NC)
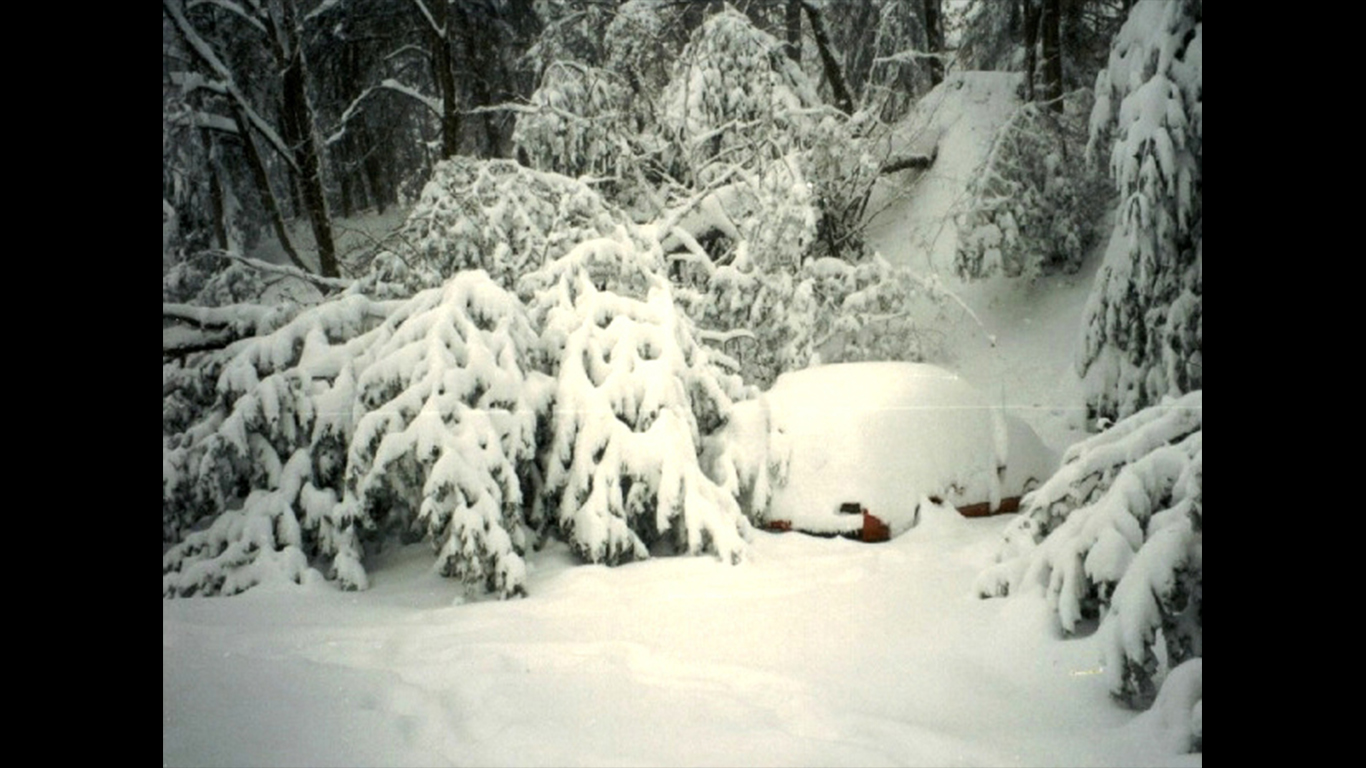
10. The Storm of the Century
> Duration: Mar. 12, 1993 – Mar. 15, 1993
> Region: Ohio Valley, Southeast, Northeast
> Affected area: 551,948 square miles
> Population affected: 120.8 million
> Notable snowfall: 56 inches (Mount LeConte, TN)
[in-text-ad]
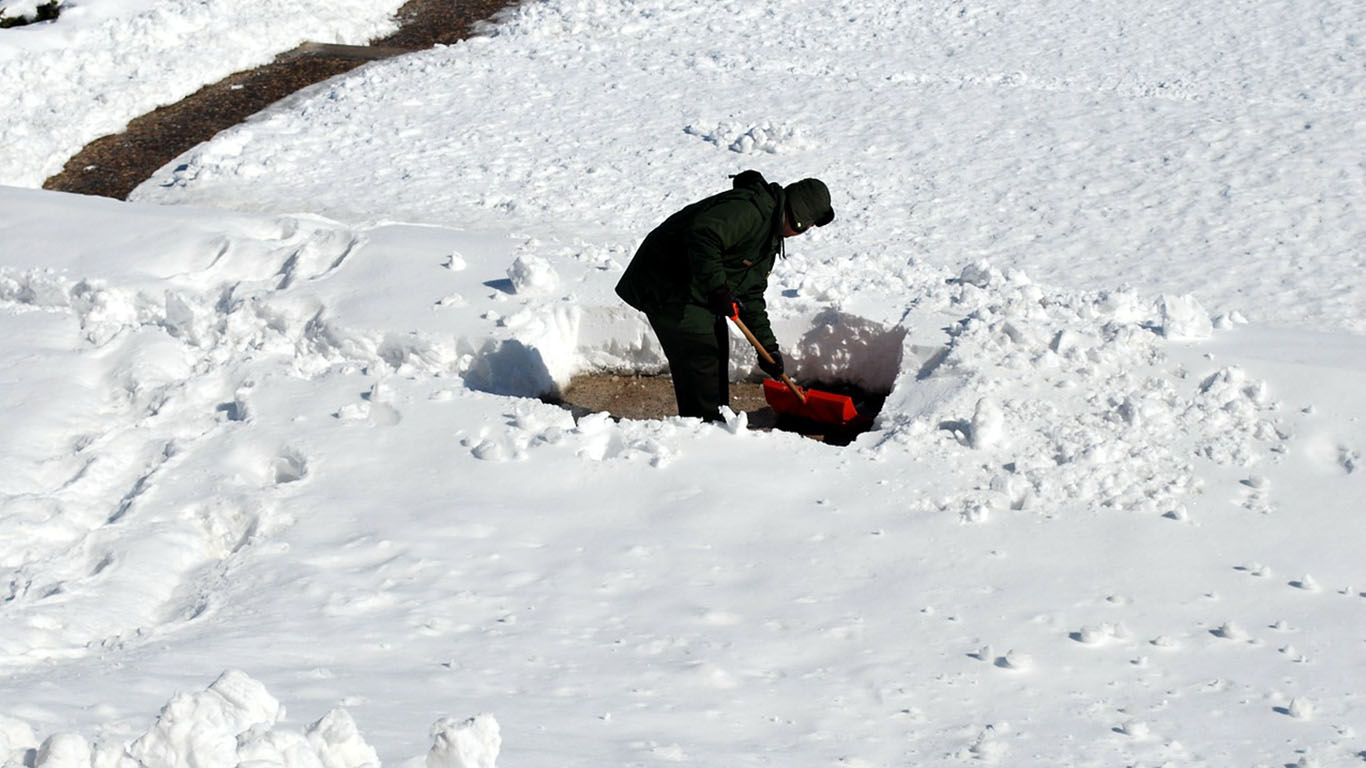
9. The Blizzard of 1984
> Duration: Apr. 25, 1984 – Apr. 28, 1984
> Region: Northern Rockies and Plains
> Affected area: 418,380 square miles
> Population affected: 3.1 million
> Notable snowfall: 24 inches (Campbell County, WY)
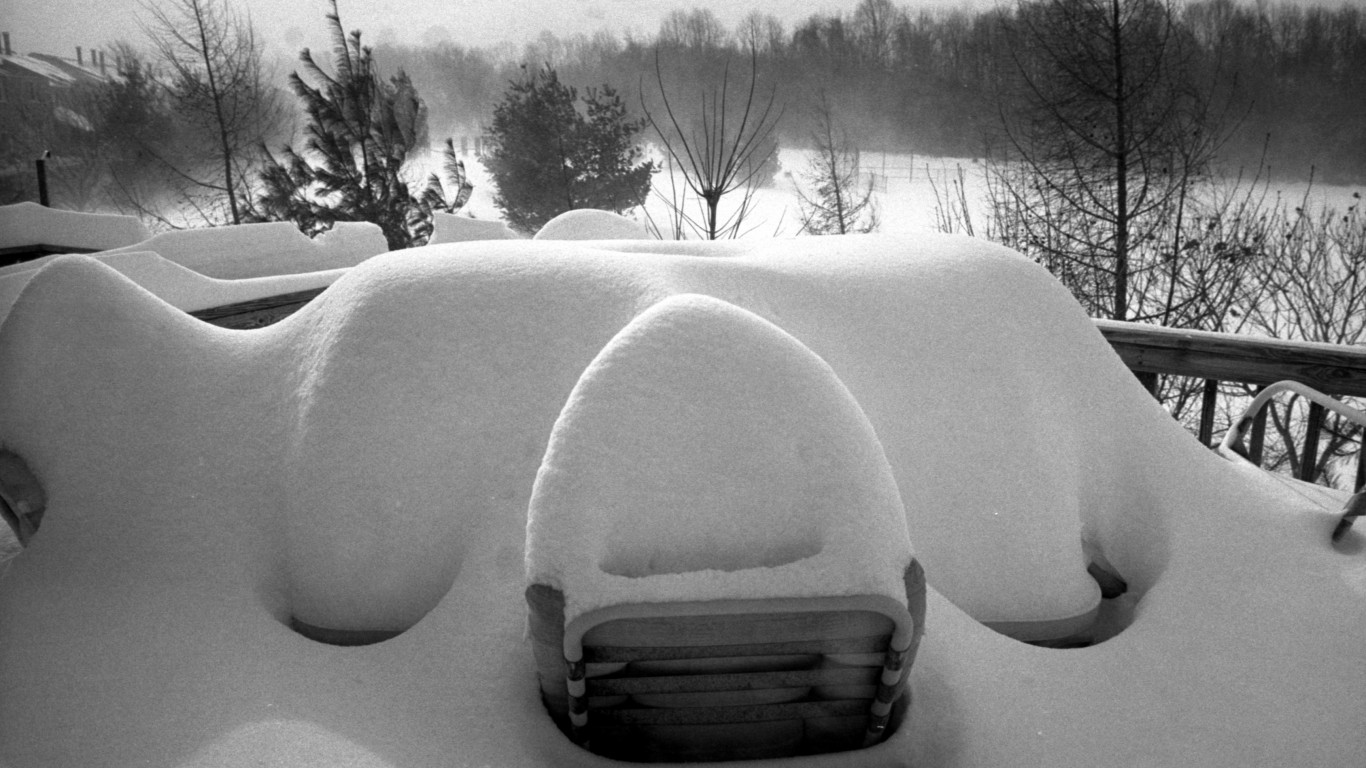
8. The Blizzard of 1996
> Duration: Jan. 6, 1996 – Jan. 9, 1996
> Region: Southeast, Northeast
> Affected area: 331,486 square miles
> Population affected: 89.5 million
> Notable snowfall: 26.6 inches (Baltimore, MD)
[in-text-ad-2]
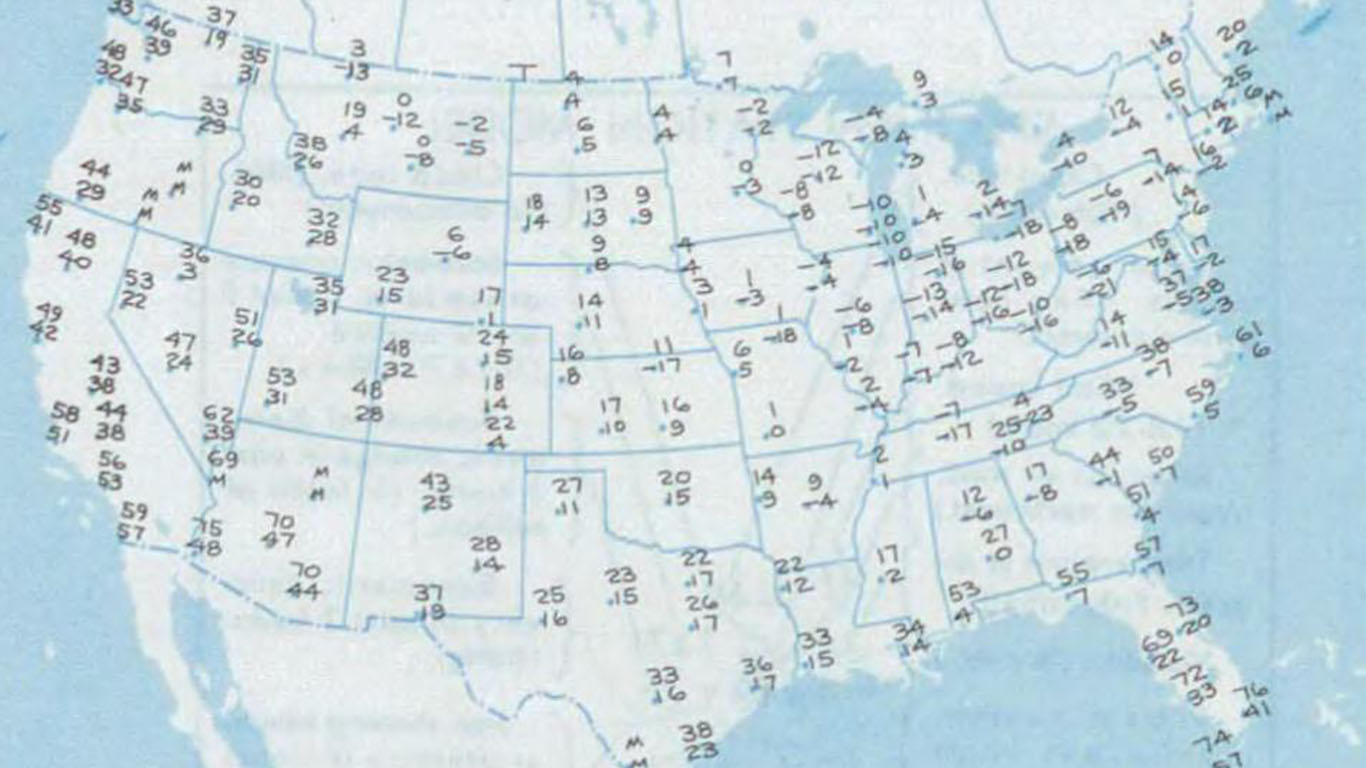
7. The Great Cold Outbreak of 1985
> Duration: Feb. 7, 1985 – Feb. 15, 1985
> Region: Upper Midwest
> Affected area: 252,012 square miles
> Population affected: 23.9 million
> Notable snowfall: N/A
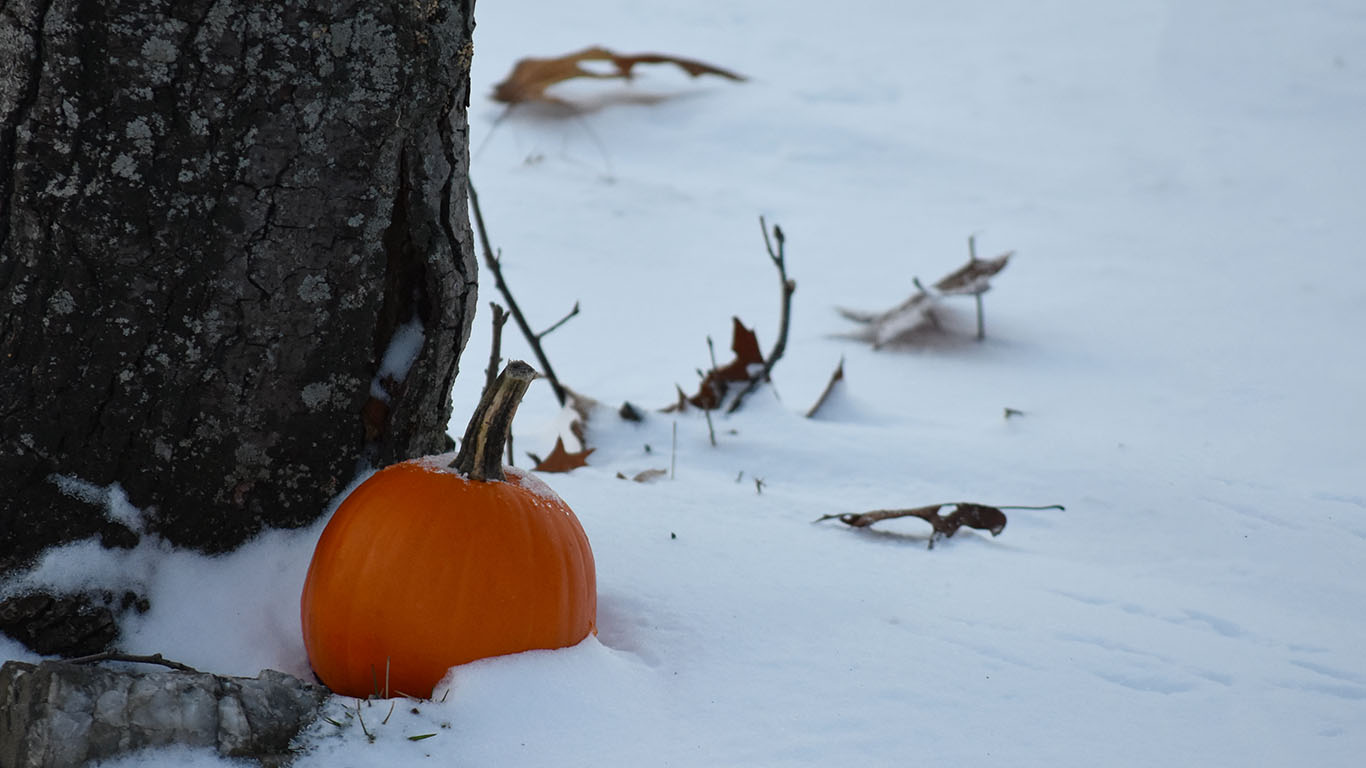
6. The Halloween Blizzard of 1991
> Duration: Oct. 31, 1991 – Nov. 4, 1991
> Region: Upper Midwest
> Affected area: 251,176 square miles
> Population affected: 23.5 million
> Notable snowfall: 28 inches (Twin Cities, MN)
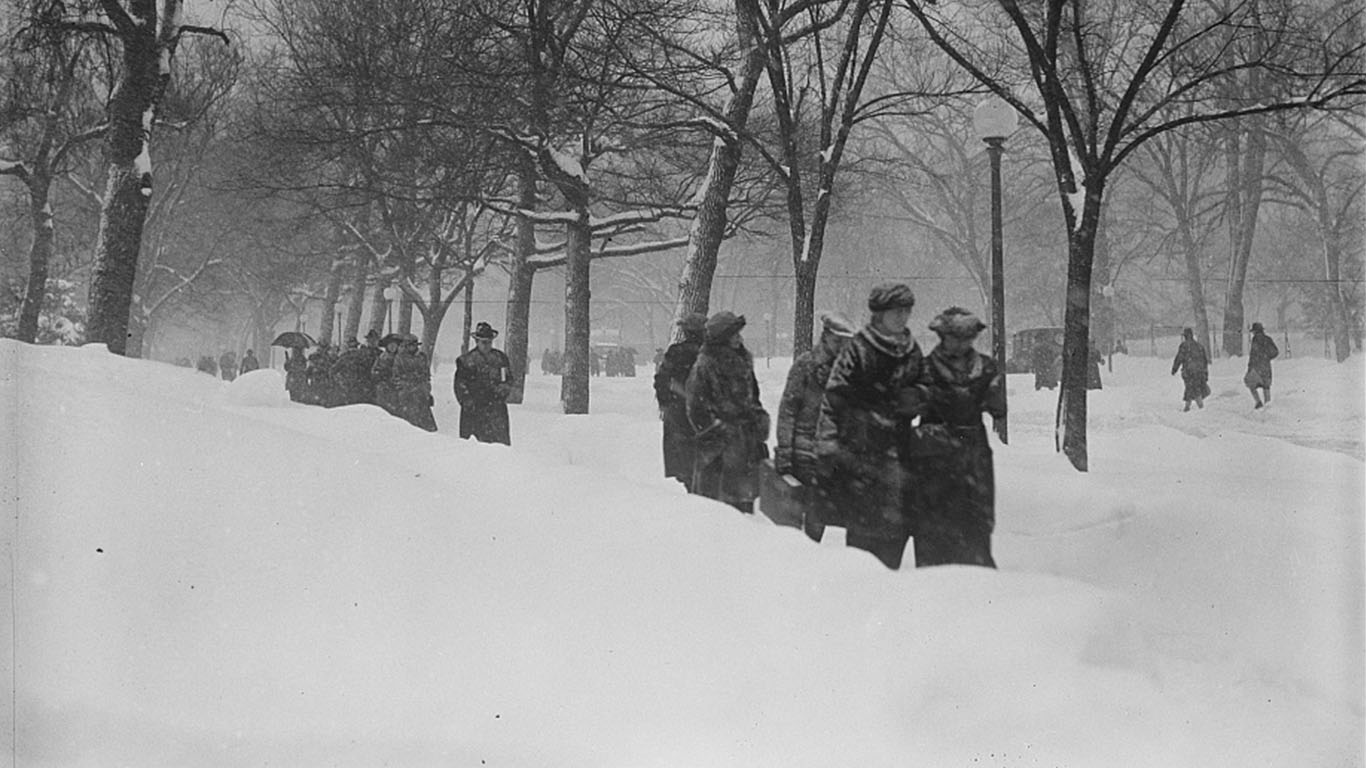
5. The Blizzard of 1921
> Duration: Feb. 18, 1921 – Feb. 22, 1921
> Region: South
> Affected area: 256,548 square miles
> Population affected: 16.7 million
> Notable snowfall: N/A
[in-text-ad]
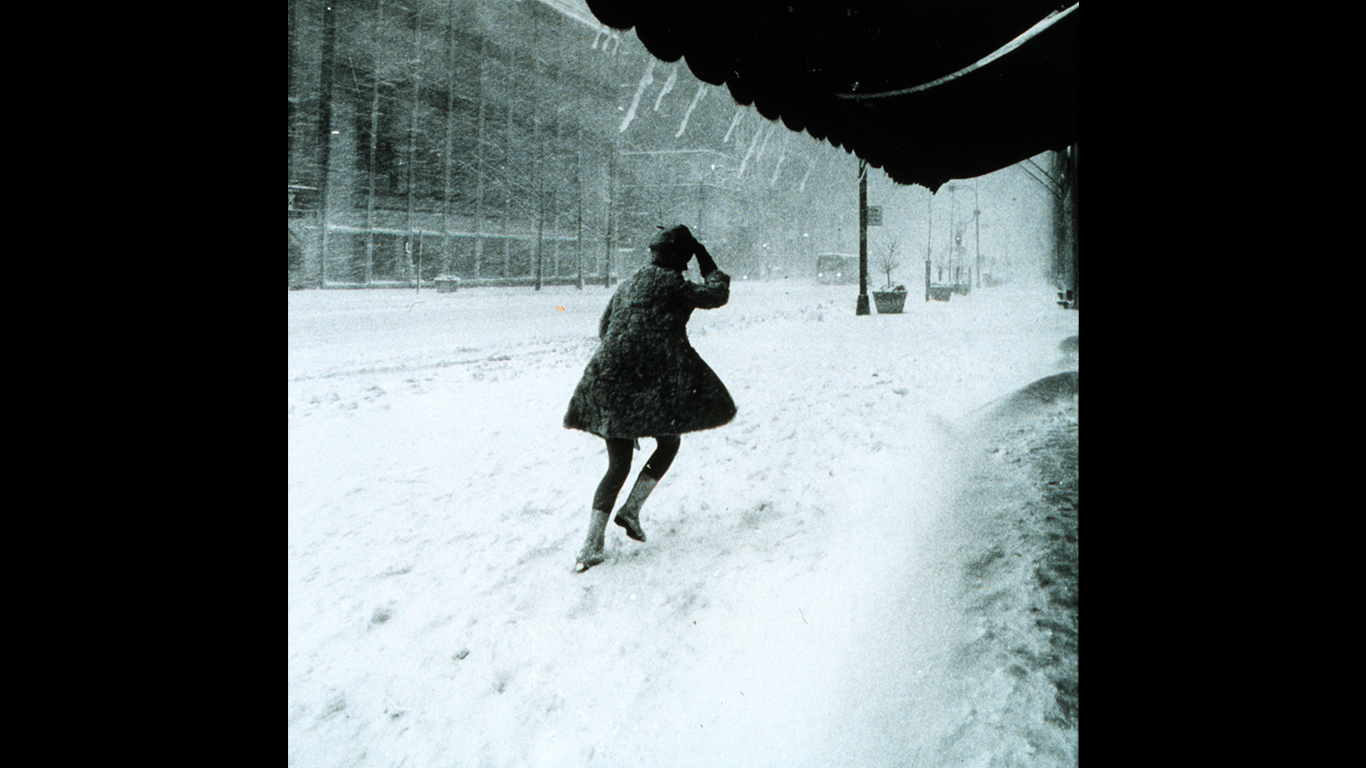
4. The 100-Hour Snowstorm of February 1969
> Duration: Feb. 22, 1969 – Feb. 28, 1969
> Region: Northeast
> Affected area: 174,950 square miles
> Population affected: 58.9 million
> Notable snowfall: 77 inches (Coos County, NH)
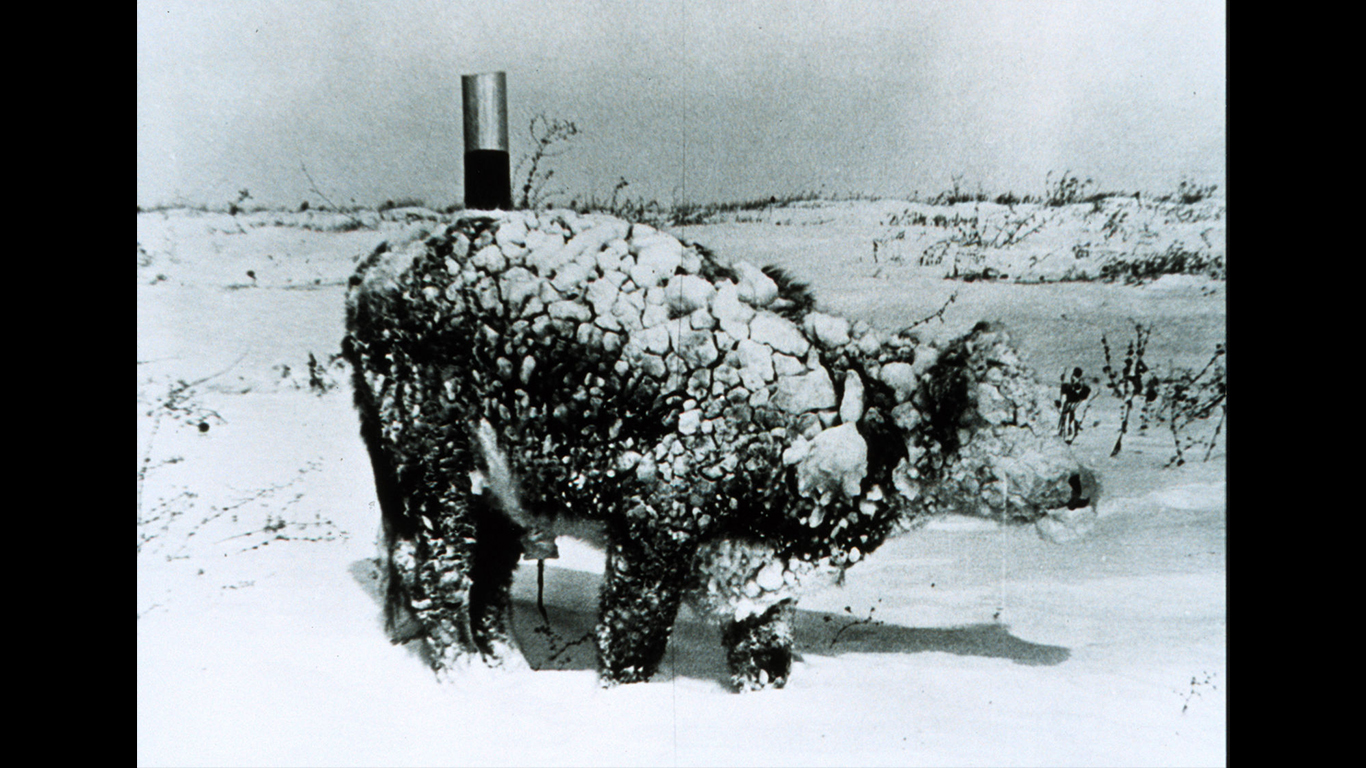
3. The Blizzard of 1927, Northern Rockies
> Duration: Apr. 10, 1927 – Apr. 15, 1927
> Region: Northern Rockies and Plains
> Affected area: 335,119 square miles
> Population affected: 2.1 million
> Notable snowfall: N/A
[in-text-ad-2]
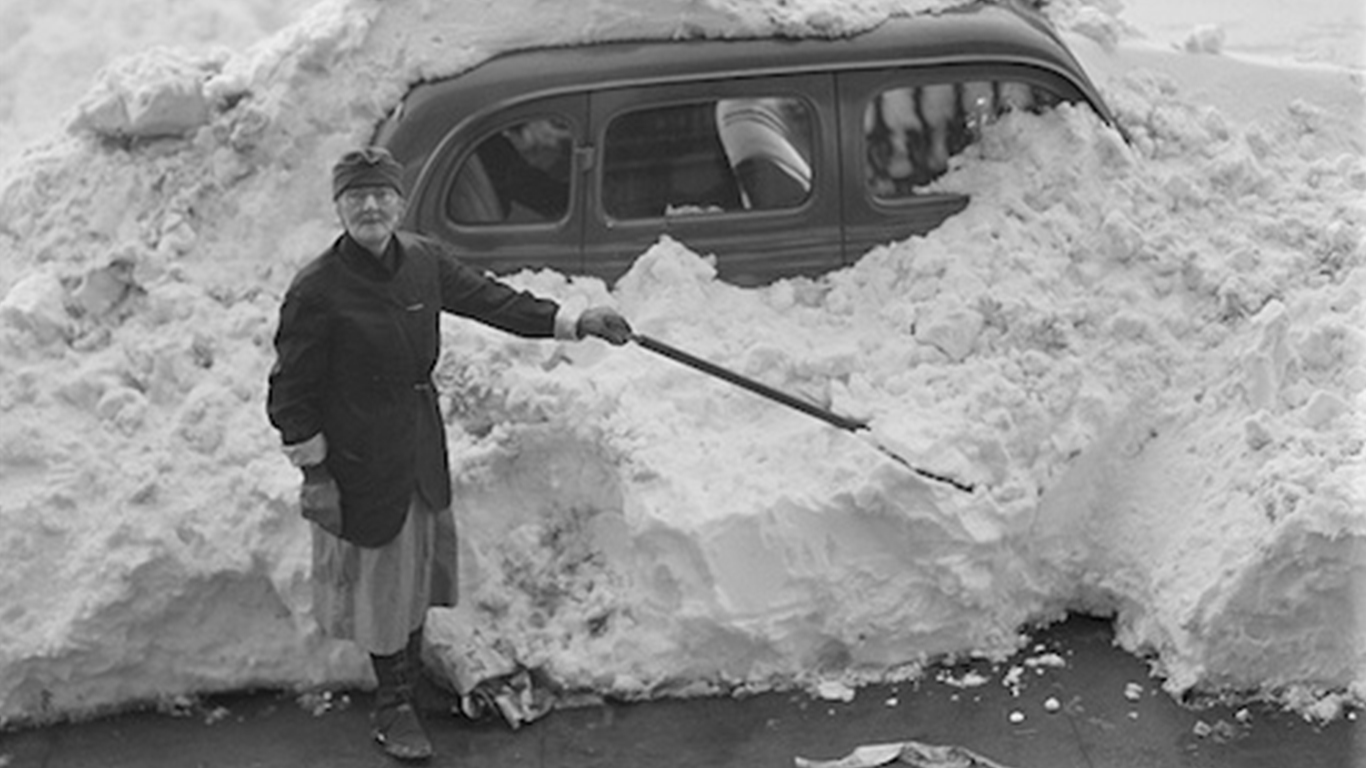
2. The Great Appalachian Storm of 1950
> Duration: Nov. 22, 1950 – Nov. 30, 1950
> Region: Ohio Valley
> Affected area: 308,845 square miles
> Population affected: 49.2 million
> Notable snowfall: 57 inches (Central Appalachia)
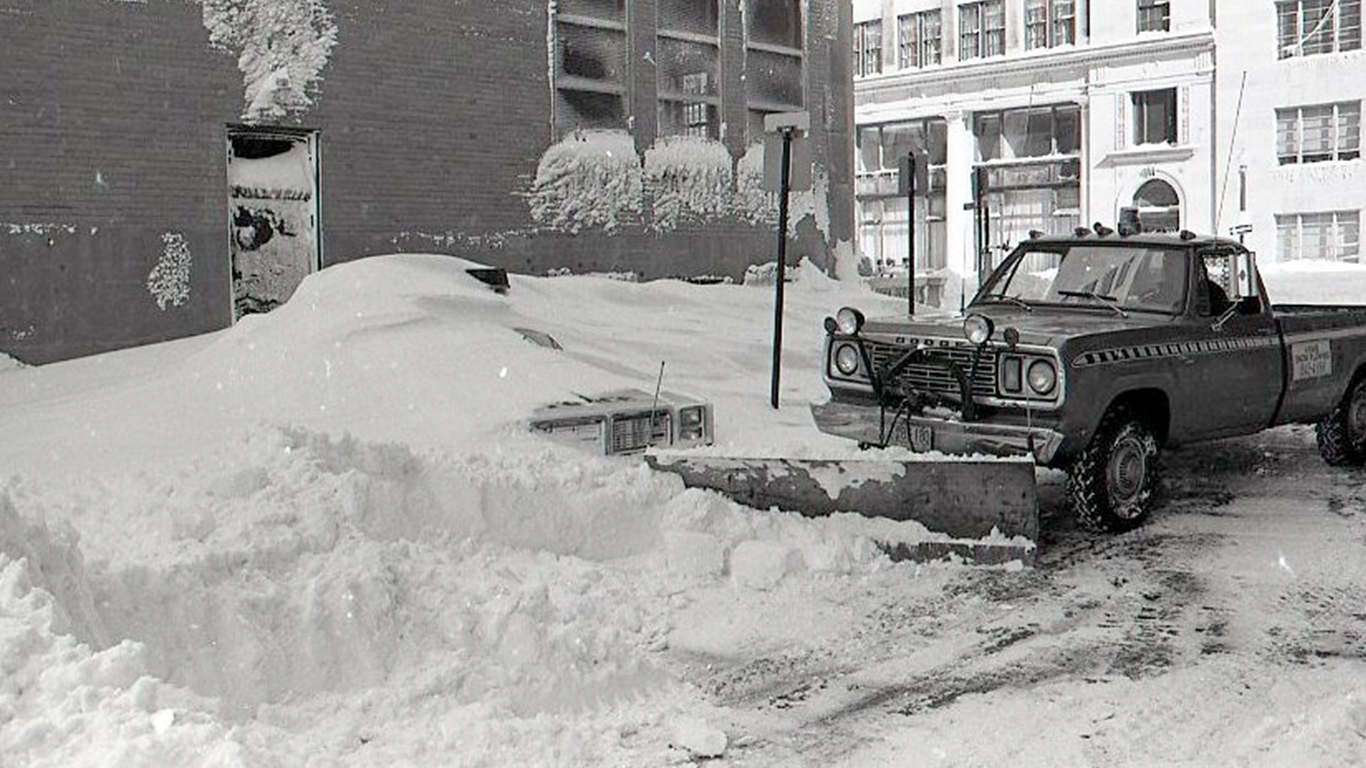
1. The White Hurricane
> Duration: Jan. 23, 1978 – Jan. 28, 1978
> Region: Upper Midwest
> Affected area: 233,580 square miles
> Population affected: 23.6 million
> Notable snowfall: 12.9 inches (Dayton, OH)
Are You Ahead, or Behind on Retirement? (sponsor)
If you’re one of the over 4 Million Americans set to retire this year, you may want to pay attention.
Finding a financial advisor who puts your interest first can be the difference between a rich retirement and barely getting by, and today it’s easier than ever. SmartAsset’s free tool matches you with up to three fiduciary financial advisors that serve your area in minutes. Each advisor has been carefully vetted, and must act in your best interests. Start your search now.
Don’t waste another minute; get started right here and help your retirement dreams become a retirement reality.
Thank you for reading! Have some feedback for us?
Contact the 24/7 Wall St. editorial team.
 24/7 Wall St.
 24/7 Wall St.
 24/7 Wall St.
 24/7 Wall St.