Special Report
How the Price of Ammunition Has Changed Each Year Since the 1970s

Published:

The United States is in the midst of a period of historic inflation. The average price of goods and services was up a multi-decade high of 9.1% year over year in June 2022. And though inflation has cooled somewhat since, very few market segments have been spared from surging prices, and consumers are still feeling the pinch – including sports men and women.
As any hunter or recreational shooter will tell you, ammunition prices have gone through the roof in recent years. From 2019 to 2022, ammunition prices have climbed by an estimated 19%, outpacing inflation, which climbed 14% over the same period.
Rising ammo prices in the pandemic era are the continuation of a trend that began long before the current inflation crisis. Small arms ammunition prices shot up 157% from 2000 to 2022, a period in which inflation climbed by a relatively modest 70%. To illustrate the impact of rising prices, a box of 20 .223 caliber rifle rounds cost about $12 in the year 2000. Today, the same ammunition costs more than $30.
Using data from the Bureau of Labor Statistics, 24/7 Wall St. determined how much ammunition prices have climbed each year since the 1970s. Changing prices were calculated using the producer price index for the small arms ammunition manufacturing industry, as the BLS does not track ammunition prices on the consumer side. Though producer prices may not be an exact match to what consumers pay in a given year, producer costs are ultimately passed down to the consumer.
The largest single-year increase in ammo prices since 1976 occurred in 2008, when the small arms ammunition manufacturing price index climbed by 23%. The second largest increase took place a year earlier, when the index rose by 14%. Partially as a result, between 2004 and 2015, ammunition prices more than doubled. Recent years have also seen significant price increases, with ammo production costs spiking 7% in 2022 and 8% in 2021. (Here is a look at the states where the government is profiting the most from gun and ammunition sales.)
Rising ammunition prices often occur during times of scarcity. The U.S. went through several ammo shortages between 2008 and 2016 that some industry experts attribute to panic buying. More recent price increases are linked to soaring demand, as gun sales hit record highs during the pandemic. This coincided with supply chain disruptions, a decline in lead refinement, and increased competition and scarcity of raw materials such as copper and gunpowder. (Here is a look at which Americans own the most guns.)
Click here to see how the price of ammunition has changed each year since the 1970s.
Click here to see our detailed methodology.

1977
> Change in ammunition prices from prev. year: +8.4% (8th largest increase in 46 yrs.)
> Change in price of all consumer goods and services from prev. year: +6.5% (6th largest increase in 46 yrs.)
> Change in ammunition prices from 1976 to 1977: +8.4%
> Change in price of all consumer goods and services from 1976 to 1977: +6.5%
[in-text-ad]
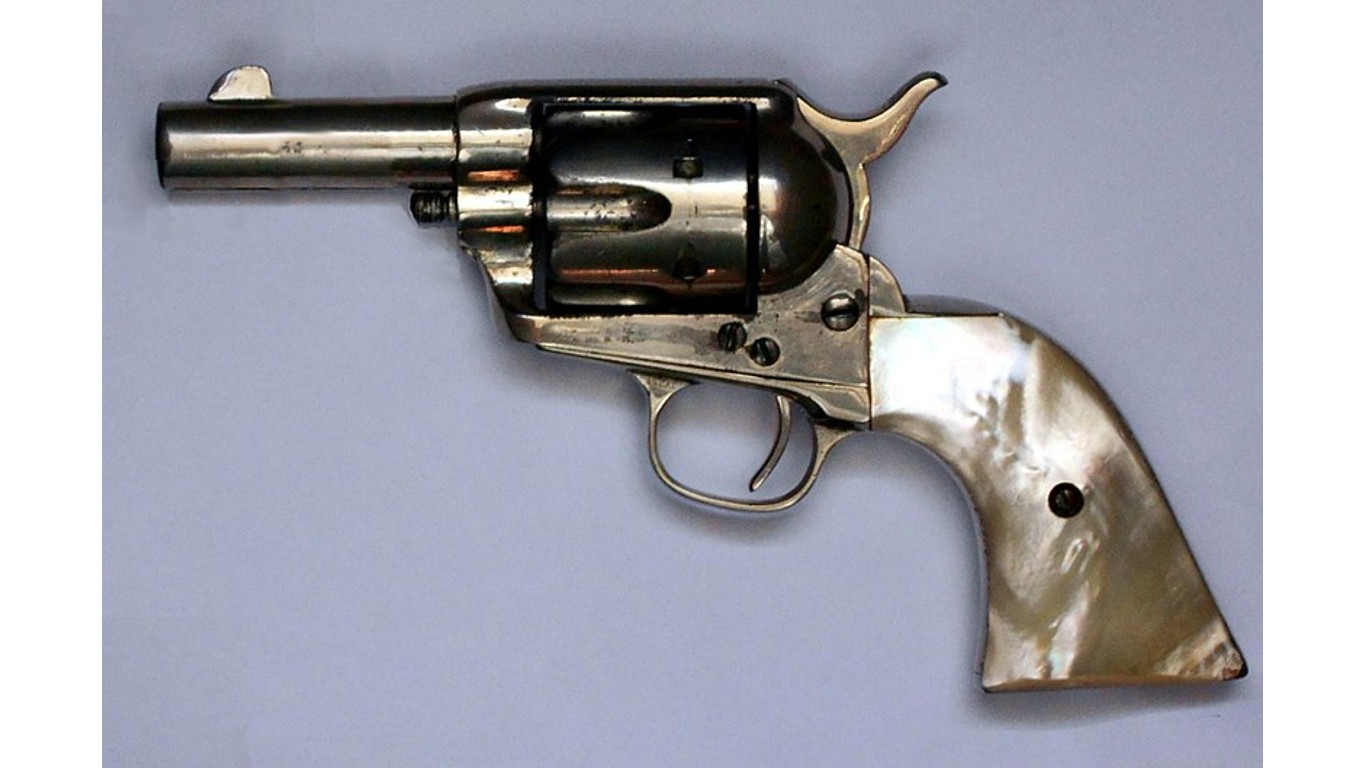
1978
> Change in ammunition prices from prev. year: +7.9% (10th largest increase in 46 yrs.)
> Change in price of all consumer goods and services from prev. year: +7.6% (5th largest increase in 46 yrs.)
> Change in ammunition prices from 1976 to 1978: +16.9%
> Change in price of all consumer goods and services from 1976 to 1978: +14.6%
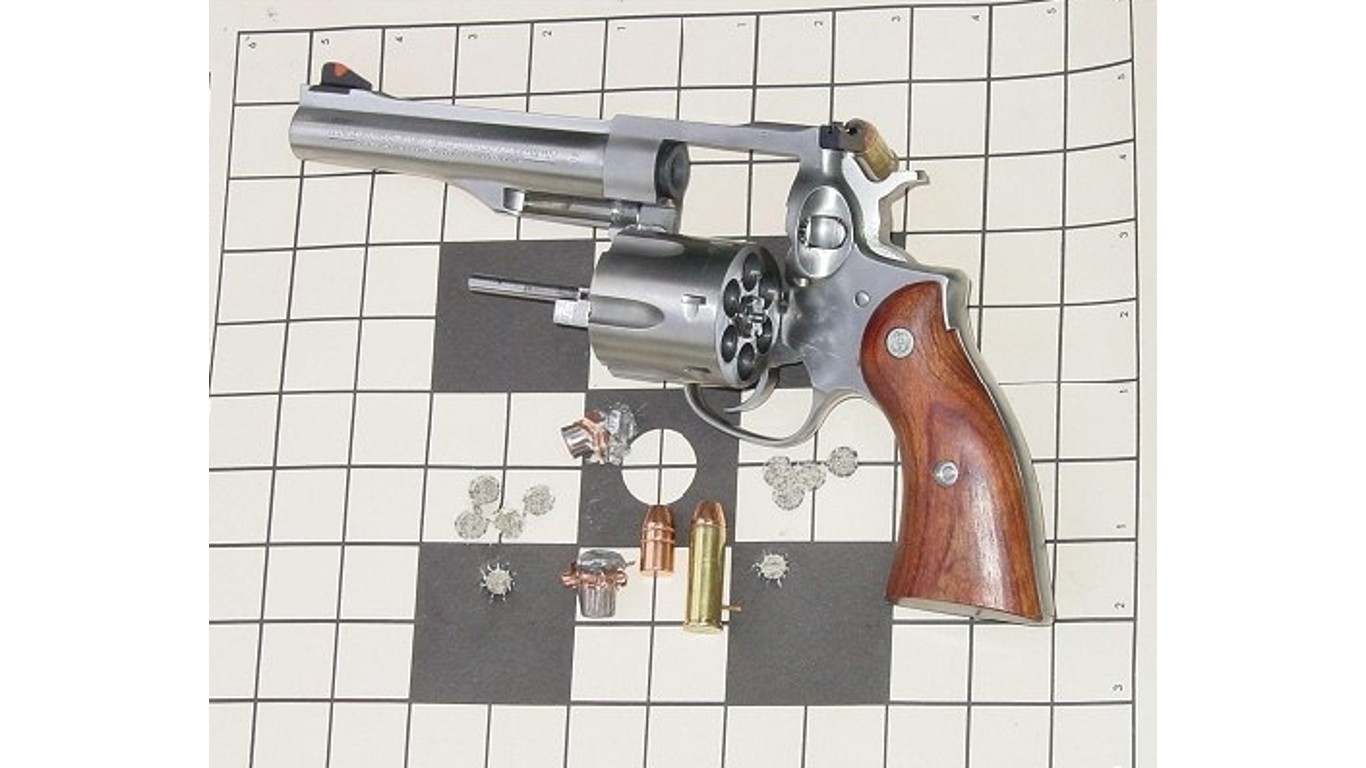
1979
> Change in ammunition prices from prev. year: +10.6% (4th largest increase in 46 yrs.)
> Change in price of all consumer goods and services from prev. year: +11.3% (2nd largest increase in 46 yrs.)
> Change in ammunition prices from 1976 to 1979: +29.4%
> Change in price of all consumer goods and services from 1976 to 1979: +27.6%
1980
> Change in ammunition prices from prev. year: +10.1% (5th largest increase in 46 yrs.)
> Change in price of all consumer goods and services from prev. year: +13.5% (largest increase in 46 yrs.)
> Change in ammunition prices from 1976 to 1980: +42.4%
> Change in price of all consumer goods and services from 1976 to 1980: +44.8%
[in-text-ad-2]
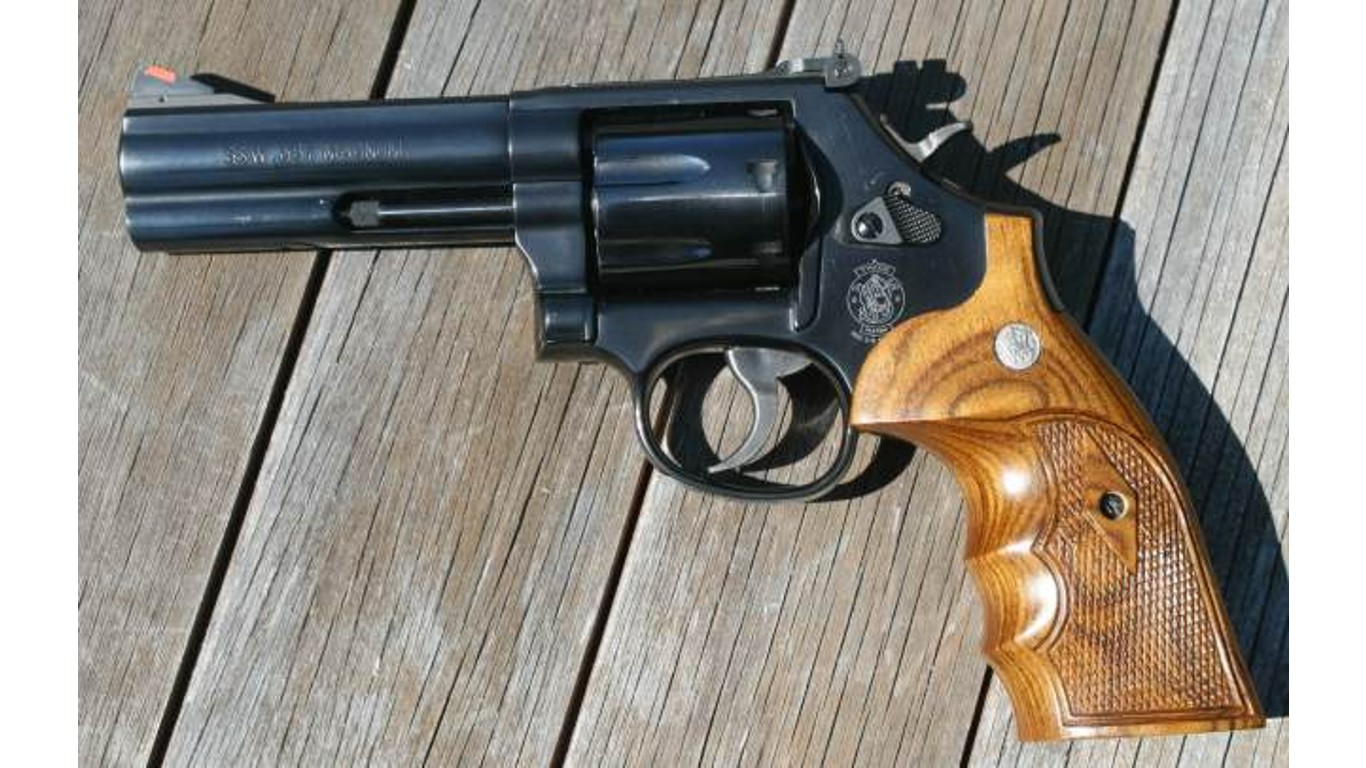
1981
> Change in ammunition prices from prev. year: +9.3% (7th largest increase in 46 yrs.)
> Change in price of all consumer goods and services from prev. year: +10.3% (3rd largest increase in 46 yrs.)
> Change in ammunition prices from 1976 to 1981: +55.6%
> Change in price of all consumer goods and services from 1976 to 1981: +59.8%

1982
> Change in ammunition prices from prev. year: +3.2% (20th largest increase in 46 yrs.)
> Change in price of all consumer goods and services from prev. year: +6.2% (7th largest increase in 46 yrs.)
> Change in ammunition prices from 1976 to 1982: +60.7%
> Change in price of all consumer goods and services from 1976 to 1982: +69.6%
[in-text-ad]
1983
> Change in ammunition prices from prev. year: +9.9% (6th largest increase in 46 yrs.)
> Change in price of all consumer goods and services from prev. year: +3.2% (20th largest increase in 46 yrs.)
> Change in ammunition prices from 1976 to 1983: +76.7%
> Change in price of all consumer goods and services from 1976 to 1983: +75.0%

1984
> Change in ammunition prices from prev. year: +5.4% (14th largest increase in 46 yrs.)
> Change in price of all consumer goods and services from prev. year: +4.3% (11th largest increase in 46 yrs.)
> Change in ammunition prices from 1976 to 1984: +86.2%
> Change in price of all consumer goods and services from 1976 to 1984: +82.6%

1985
> Change in ammunition prices from prev. year: +6.4% (12th largest increase in 46 yrs.)
> Change in price of all consumer goods and services from prev. year: +3.6% (16th largest increase in 46 yrs.)
> Change in ammunition prices from 1976 to 1985: +98.1%
> Change in price of all consumer goods and services from 1976 to 1985: +89.1%
[in-text-ad-2]

1986
> Change in ammunition prices from prev. year: +2.3% (28th largest increase in 46 yrs.)
> Change in price of all consumer goods and services from prev. year: +1.9% (36th largest increase in 46 yrs.)
> Change in ammunition prices from 1976 to 1986: +102.5%
> Change in price of all consumer goods and services from 1976 to 1986: +92.6%

1987
> Change in ammunition prices from prev. year: -3.2% (largest decrease in 46 yrs.)
> Change in price of all consumer goods and services from prev. year: +3.6% (15th largest increase in 46 yrs.)
> Change in ammunition prices from 1976 to 1987: +96.1%
> Change in price of all consumer goods and services from 1976 to 1987: +99.6%
[in-text-ad]
1988
> Change in ammunition prices from prev. year: +3.0% (22nd largest increase in 46 yrs.)
> Change in price of all consumer goods and services from prev. year: +4.1% (13th largest increase in 46 yrs.)
> Change in ammunition prices from 1976 to 1988: +101.9%
> Change in price of all consumer goods and services from 1976 to 1988: +107.9%

1989
> Change in ammunition prices from prev. year: +4.9% (16th largest increase in 46 yrs.)
> Change in price of all consumer goods and services from prev. year: +4.8% (9th largest increase in 46 yrs.)
> Change in ammunition prices from 1976 to 1989: +111.9%
> Change in price of all consumer goods and services from 1976 to 1989: +117.9%

1990
> Change in ammunition prices from prev. year: +0.1% (smallest increase in 46 yrs.)
> Change in price of all consumer goods and services from prev. year: +5.4% (8th largest increase in 46 yrs.)
> Change in ammunition prices from 1976 to 1990: +112.1%
> Change in price of all consumer goods and services from 1976 to 1990: +129.7%
[in-text-ad-2]

1991
> Change in ammunition prices from prev. year: +3.4% (19th largest increase in 46 yrs.)
> Change in price of all consumer goods and services from prev. year: +4.2% (12th largest increase in 46 yrs.)
> Change in ammunition prices from 1976 to 1991: +119.3%
> Change in price of all consumer goods and services from 1976 to 1991: +139.4%
1992
> Change in ammunition prices from prev. year: -0.5% (4th largest decrease in 46 yrs.)
> Change in price of all consumer goods and services from prev. year: +3.0% (22nd largest increase in 46 yrs.)
> Change in ammunition prices from 1976 to 1992: +118.1%
> Change in price of all consumer goods and services from 1976 to 1992: +146.6%
[in-text-ad]
1993
> Change in ammunition prices from prev. year: +2.1% (29th largest increase in 46 yrs.)
> Change in price of all consumer goods and services from prev. year: +3.0% (23rd largest increase in 46 yrs.)
> Change in ammunition prices from 1976 to 1993: +122.6%
> Change in price of all consumer goods and services from 1976 to 1993: +154.0%
1994
> Change in ammunition prices from prev. year: +0.5% (35th largest increase in 46 yrs.)
> Change in price of all consumer goods and services from prev. year: +2.6% (29th largest increase in 46 yrs.)
> Change in ammunition prices from 1976 to 1994: +123.7%
> Change in price of all consumer goods and services from 1976 to 1994: +160.5%

1995
> Change in ammunition prices from prev. year: +2.4% (27th largest increase in 46 yrs.)
> Change in price of all consumer goods and services from prev. year: +2.8% (27th largest increase in 46 yrs.)
> Change in ammunition prices from 1976 to 1995: +129.2%
> Change in price of all consumer goods and services from 1976 to 1995: +167.8%
[in-text-ad-2]

1996
> Change in ammunition prices from prev. year: +1.1% (32nd largest increase in 46 yrs.)
> Change in price of all consumer goods and services from prev. year: +3.0% (24th largest increase in 46 yrs.)
> Change in ammunition prices from 1976 to 1996: +131.7%
> Change in price of all consumer goods and services from 1976 to 1996: +175.7%

1997
> Change in ammunition prices from prev. year: +0.5% (37th largest increase in 46 yrs.)
> Change in price of all consumer goods and services from prev. year: +2.3% (31st largest increase in 46 yrs.)
> Change in ammunition prices from 1976 to 1997: +132.9%
> Change in price of all consumer goods and services from 1976 to 1997: +182.1%
[in-text-ad]

1998
> Change in ammunition prices from prev. year: +0.8% (34th largest increase in 46 yrs.)
> Change in price of all consumer goods and services from prev. year: +1.6% (41st largest increase in 46 yrs.)
> Change in ammunition prices from 1976 to 1998: +134.8%
> Change in price of all consumer goods and services from 1976 to 1998: +186.5%

1999
> Change in ammunition prices from prev. year: -1.1% (3rd largest decrease in 46 yrs.)
> Change in price of all consumer goods and services from prev. year: +2.2% (33rd largest increase in 46 yrs.)
> Change in ammunition prices from 1976 to 1999: +132.3%
> Change in price of all consumer goods and services from 1976 to 1999: +192.8%
2000
> Change in ammunition prices from prev. year: -2.3% (2nd largest decrease in 46 yrs.)
> Change in price of all consumer goods and services from prev. year: +3.4% (18th largest increase in 46 yrs.)
> Change in ammunition prices from 1976 to 2000: +127.0%
> Change in price of all consumer goods and services from 1976 to 2000: +202.6%
[in-text-ad-2]

2001
> Change in ammunition prices from prev. year: -0.5% (5th largest decrease in 46 yrs.)
> Change in price of all consumer goods and services from prev. year: +2.8% (26th largest increase in 46 yrs.)
> Change in ammunition prices from 1976 to 2001: +125.9%
> Change in price of all consumer goods and services from 1976 to 2001: +211.2%

2002
> Change in ammunition prices from prev. year: -0.1% (7th largest decrease in 46 yrs.)
> Change in price of all consumer goods and services from prev. year: +1.6% (40th largest increase in 46 yrs.)
> Change in ammunition prices from 1976 to 2002: +125.7%
> Change in price of all consumer goods and services from 1976 to 2002: +216.2%
[in-text-ad]

2003
> Change in ammunition prices from prev. year: +0.5% (36th largest increase in 46 yrs.)
> Change in price of all consumer goods and services from prev. year: +2.3% (32nd largest increase in 46 yrs.)
> Change in ammunition prices from 1976 to 2003: +126.8%
> Change in price of all consumer goods and services from 1976 to 2003: +223.4%

2004
> Change in ammunition prices from prev. year: +1.4% (31st largest increase in 46 yrs.)
> Change in price of all consumer goods and services from prev. year: +2.7% (28th largest increase in 46 yrs.)
> Change in ammunition prices from 1976 to 2004: +130.0%
> Change in price of all consumer goods and services from 1976 to 2004: +232.0%

2005
> Change in ammunition prices from prev. year: +5.2% (15th largest increase in 46 yrs.)
> Change in price of all consumer goods and services from prev. year: +3.4% (17th largest increase in 46 yrs.)
> Change in ammunition prices from 1976 to 2005: +142.0%
> Change in price of all consumer goods and services from 1976 to 2005: +243.2%
[in-text-ad-2]
2006
> Change in ammunition prices from prev. year: +6.0% (13th largest increase in 46 yrs.)
> Change in price of all consumer goods and services from prev. year: +3.2% (19th largest increase in 46 yrs.)
> Change in ammunition prices from 1976 to 2006: +156.6%
> Change in price of all consumer goods and services from 1976 to 2006: +254.3%

2007
> Change in ammunition prices from prev. year: +13.9% (2nd largest increase in 46 yrs.)
> Change in price of all consumer goods and services from prev. year: +2.8% (25th largest increase in 46 yrs.)
> Change in ammunition prices from 1976 to 2007: +192.2%
> Change in price of all consumer goods and services from 1976 to 2007: +264.4%
[in-text-ad]

2008
> Change in ammunition prices from prev. year: +22.8% (largest increase in 46 yrs.)
> Change in price of all consumer goods and services from prev. year: +3.8% (14th largest increase in 46 yrs.)
> Change in ammunition prices from 1976 to 2008: +258.9%
> Change in price of all consumer goods and services from 1976 to 2008: +278.4%
2009
> Change in ammunition prices from prev. year: -0.1% (smallest decrease in 46 yrs.)
> Change in price of all consumer goods and services from prev. year: -0.4% (largest decrease in 46 yrs.)
> Change in ammunition prices from 1976 to 2009: +258.8%
> Change in price of all consumer goods and services from 1976 to 2009: +277.0%

2010
> Change in ammunition prices from prev. year: +4.2% (17th largest increase in 46 yrs.)
> Change in price of all consumer goods and services from prev. year: +1.6% (38th largest increase in 46 yrs.)
> Change in ammunition prices from 1976 to 2010: +273.7%
> Change in price of all consumer goods and services from 1976 to 2010: +283.2%
[in-text-ad-2]

2011
> Change in ammunition prices from prev. year: +11.5% (3rd largest increase in 46 yrs.)
> Change in price of all consumer goods and services from prev. year: +3.2% (21st largest increase in 46 yrs.)
> Change in ammunition prices from 1976 to 2011: +316.7%
> Change in price of all consumer goods and services from 1976 to 2011: +295.3%

2012
> Change in ammunition prices from prev. year: +2.6% (25th largest increase in 46 yrs.)
> Change in price of all consumer goods and services from prev. year: +2.1% (35th largest increase in 46 yrs.)
> Change in ammunition prices from 1976 to 2012: +327.6%
> Change in price of all consumer goods and services from 1976 to 2012: +303.5%
[in-text-ad]
2013
> Change in ammunition prices from prev. year: +3.6% (18th largest increase in 46 yrs.)
> Change in price of all consumer goods and services from prev. year: +1.5% (42nd largest increase in 46 yrs.)
> Change in ammunition prices from 1976 to 2013: +343.2%
> Change in price of all consumer goods and services from 1976 to 2013: +309.4%

2014
> Change in ammunition prices from prev. year: +2.6% (26th largest increase in 46 yrs.)
> Change in price of all consumer goods and services from prev. year: +1.6% (39th largest increase in 46 yrs.)
> Change in ammunition prices from 1976 to 2014: +354.7%
> Change in price of all consumer goods and services from 1976 to 2014: +316.1%

2015
> Change in ammunition prices from prev. year: +2.8% (24th largest increase in 46 yrs.)
> Change in price of all consumer goods and services from prev. year: +0.1% (smallest increase in 46 yrs.)
> Change in ammunition prices from 1976 to 2015: +367.3%
> Change in price of all consumer goods and services from 1976 to 2015: +316.6%
[in-text-ad-2]

2016
> Change in ammunition prices from prev. year: +1.5% (30th largest increase in 46 yrs.)
> Change in price of all consumer goods and services from prev. year: +1.3% (43rd largest increase in 46 yrs.)
> Change in ammunition prices from 1976 to 2016: +374.1%
> Change in price of all consumer goods and services from 1976 to 2016: +321.8%
2017
> Change in ammunition prices from prev. year: -0.4% (6th largest decrease in 46 yrs.)
> Change in price of all consumer goods and services from prev. year: +2.1% (34th largest increase in 46 yrs.)
> Change in ammunition prices from 1976 to 2017: +372.2%
> Change in price of all consumer goods and services from 1976 to 2017: +330.8%
[in-text-ad]

2018
> Change in ammunition prices from prev. year: +3.0% (21st largest increase in 46 yrs.)
> Change in price of all consumer goods and services from prev. year: +2.4% (30th largest increase in 46 yrs.)
> Change in ammunition prices from 1976 to 2018: +386.6%
> Change in price of all consumer goods and services from 1976 to 2018: +341.3%
2019
> Change in ammunition prices from prev. year: +0.8% (33rd largest increase in 46 yrs.)
> Change in price of all consumer goods and services from prev. year: +1.8% (37th largest increase in 46 yrs.)
> Change in ammunition prices from 1976 to 2019: +390.7%
> Change in price of all consumer goods and services from 1976 to 2019: +349.3%

2020
> Change in ammunition prices from prev. year: +2.9% (23rd largest increase in 46 yrs.)
> Change in price of all consumer goods and services from prev. year: +1.2% (44th largest increase in 46 yrs.)
> Change in ammunition prices from 1976 to 2020: +404.7%
> Change in price of all consumer goods and services from 1976 to 2020: +354.9%
[in-text-ad-2]
2021
> Change in ammunition prices from prev. year: +8.1% (9th largest increase in 46 yrs.)
> Change in price of all consumer goods and services from prev. year: +4.7% (10th largest increase in 46 yrs.)
> Change in ammunition prices from 1976 to 2021: +445.5%
> Change in price of all consumer goods and services from 1976 to 2021: +376.2%

2022
> Change in ammunition prices from prev. year: +6.8% (11th largest increase in 46 yrs.)
> Change in price of all consumer goods and services from prev. year: +8.0% (4th largest increase in 46 yrs.)
> Change in ammunition prices from 1976 to 2022: +482.6%
> Change in price of all consumer goods and services from 1976 to 2022: +414.3%
Methodology
To determine how ammunition prices have changed each year since 1976, 24/7 Wall St. reviewed inflation data from the Bureau of Labor Statistics. Because consumer prices for small arms ammunition are not available, we used the producer price index for the small arms ammunition manufacturing industry as a proxy. Producer prices may not be an exact match what consumers pay in a given year, but producer costs are inevitably passed down to the consumer.
As a benchmark for how changes in ammunition prices compare to overall inflation, we also reviewed the change in the overall consumer price index for each year over the same period.
Credit card companies are handing out rewards and benefits to win the best customers. A good cash back card can be worth thousands of dollars a year in free money, not to mention other perks like travel, insurance, and access to fancy lounges. See our top picks for the best credit cards today. You won’t want to miss some of these offers.
Flywheel Publishing has partnered with CardRatings for our coverage of credit card products. Flywheel Publishing and CardRatings may receive a commission from card issuers.
Thank you for reading! Have some feedback for us?
Contact the 24/7 Wall St. editorial team.