
Last week, Canadian health officials revised government recommendations for alcohol consumption from two drinks per day to two drinks per week, and strongly suggested that citizens cut out alcohol altogether.
While that may seem excessive, a growing body of evidence suggests that any alcohol consumption, however moderate, can have negative health consequences. Even low levels of drinking increase the risk of high blood pressure, heart disease, and certain types of cancer – and as alcohol consumption rises, so do the health risks.
According to a recent study, excessive drinking results in about 140,000 deaths each year in the United States. Most of these deaths are caused by chronic health conditions, such as liver disease, but also include acute causes, such as roadway accidents and alcohol poisoning. (Read about 25 famous people who drank themselves to death.)
Understanding that there is no such thing as risk-free drinking, the Centers for Disease Control and Prevention – while not going so far as its Canadian counterpart – defines moderate drinking as 2 drinks or less per day for men, and no more than one drink per day for women. Still, despite the well-publicized health risks, more than two-thirds of adult drinkers regularly exceed those levels.
In some parts of the country, excessive drinking is far more common than in others. Using data from the National Institute on Alcohol Abuse and Alcoholism, 24/7 Tempo reviewed per capita alcohol consumption in each of the 50 states. States are ranked by the gallons of alcohol consumed per resident 14 and older in 2020.
As part of a program to improve public health in the United States, the Department of Health and Human Services set a goal to reduce alcohol consumption from 2.3 gallons in 2017 to 2.1 gallons in 2020. According to the latest data, only seven states fall below that national benchmark.
Across the 50 states, alcohol consumption ranged from about 1.4 gallons in 2020, to over 4.8 gallons. The states with the highest per capita alcohol consumption span the country, from the Northeast to the West, while the states with the lowest consumption rates are concentrated in the South.
Click here to see the states where people drink the most alcohol
Not surprisingly, adults in states with the highest per capita alcohol consumption are more likely to engage in excessive drinking – meaning four more drinks in a single occasion or more than one drink per day for women, or five or more drinks in a single occasion or more than two drinks per day for men. Similarly, in states with higher per capita alcohol consumption, a larger share of fatal car crashes involve alcohol impaired drivers. (Here’s a look at when you’re most likely to die in a drunk driving accident in every state.)
To compile a list of the states with the highest alcohol consumption from all beverages per capita, 24/7 Tempo reviewed a report by the data site Statista, which analyzed data published in April 2022 from the National Institute on Alcohol Abuse and Alcoholism (NIAAA). Data is for 2020 and is for people 14 years and older. Population data came from the U.S. Census Bureau’s 2021 American Community Survey. Data on excessive drinking among adults and alcohol-impaired driving fatalities came from the 2022 County Health Rankings & Roadmaps, a Robert Wood Johnson Foundation and University of Wisconsin Population Health Institute joint program and is for 2019.
50. Utah
> Per capita annual alcohol consumption (14 and older): 1.36 gallons
> Excessive drinking rate among adults: 11.9% — the lowest
> Share of driving fatalities involving alcohol: 21.7% — 6th lowest (total: 291)
> Population: 3,337,975
[in-text-ad]
49. West Virginia
> Per capita annual alcohol consumption (14 and older): 1.82 gallons
> Excessive drinking rate among adults: 15.2% — 4th lowest
> Share of driving fatalities involving alcohol: 26.1% — 18th lowest (total: 364)
> Population: 1,782,959
 24/7 Wall St.
48. Oklahoma
> Per capita annual alcohol consumption (14 and older): 1.85 gallons
> Excessive drinking rate among adults: 14.5% — 2nd lowest
> Share of driving fatalities involving alcohol: 26.8% — 20th lowest (total: 881)
> Population: 3,986,639

47. Georgia
> Per capita annual alcohol consumption (14 and older): 1.91 gallons
> Excessive drinking rate among adults: 17.8% — 17th lowest
> Share of driving fatalities involving alcohol: 20.7% — 5th lowest (total: 1,606)
> Population: 10,799,566
[in-text-ad-2]
46. Arkansas
> Per capita annual alcohol consumption (14 and older): 1.92 gallons
> Excessive drinking rate among adults: 15.9% — 6th lowest
> Share of driving fatalities involving alcohol: 25.7% — 15th lowest (total: 706)
> Population: 3,025,891

45. Alabama
> Per capita annual alcohol consumption (14 and older): 2.08 gallons
> Excessive drinking rate among adults: 14.8% — 3rd lowest
> Share of driving fatalities involving alcohol: 25.9% — 17th lowest (total: 1,255)
> Population: 5,039,877
[in-text-ad]

44. Idaho
> Per capita annual alcohol consumption (14 and older): 2.10 gallons
> Excessive drinking rate among adults: 19.6% — 24th lowest
> Share of driving fatalities involving alcohol: 31.1% — 18th highest (total: 363)
> Population: 1,900,923
 24/7 Wall St.
43. Kentucky
> Per capita annual alcohol consumption (14 and older): 2.12 gallons
> Excessive drinking rate among adults: 18.2% — 18th lowest
> Share of driving fatalities involving alcohol: 25.5% — 14th lowest (total: 981)
> Population: 4,509,394

42. Kansas
> Per capita annual alcohol consumption (14 and older): 2.12 gallons
> Excessive drinking rate among adults: 20.0% — 24th highest
> Share of driving fatalities involving alcohol: 19.4% — 3rd lowest (total: 413)
> Population: 2,934,582
[in-text-ad-2]

41. Ohio
> Per capita annual alcohol consumption (14 and older): 2.12 gallons
> Excessive drinking rate among adults: 20.7% — 18th highest
> Share of driving fatalities involving alcohol: 32.5% — 14th highest (total: 1,875)
> Population: 11,780,017

40. South Carolina
> Per capita annual alcohol consumption (14 and older): 2.12 gallons
> Excessive drinking rate among adults: 21.7% — 14th highest
> Share of driving fatalities involving alcohol: 32.8% — 12th highest (total: 1,677)
> Population: 5,190,705
[in-text-ad]

39. Maryland
> Per capita annual alcohol consumption (14 and older): 2.15 gallons
> Excessive drinking rate among adults: 16.0% — 7th lowest
> Share of driving fatalities involving alcohol: 28.3% — 25th lowest (total: 755)
> Population: 6,165,129
 24/7 Wall St.
38. Nebraska
> Per capita annual alcohol consumption (14 and older): 2.17 gallons
> Excessive drinking rate among adults: 23.2% — 8th highest
> Share of driving fatalities involving alcohol: 33.2% — 10th highest (total: 384)
> Population: 1,963,692

37. New York
> Per capita annual alcohol consumption (14 and older): 2.22 gallons
> Excessive drinking rate among adults: 19.0% — 19th lowest
> Share of driving fatalities involving alcohol: 20.2% — 4th lowest (total: 1,002)
> Population: 19,835,913
[in-text-ad-2]

36. Arizona
> Per capita annual alcohol consumption (14 and older): 2.24 gallons
> Excessive drinking rate among adults: 17.4% — 12th lowest
> Share of driving fatalities involving alcohol: 22.3% — 8th lowest (total: 1,112)
> Population: 7,276,316
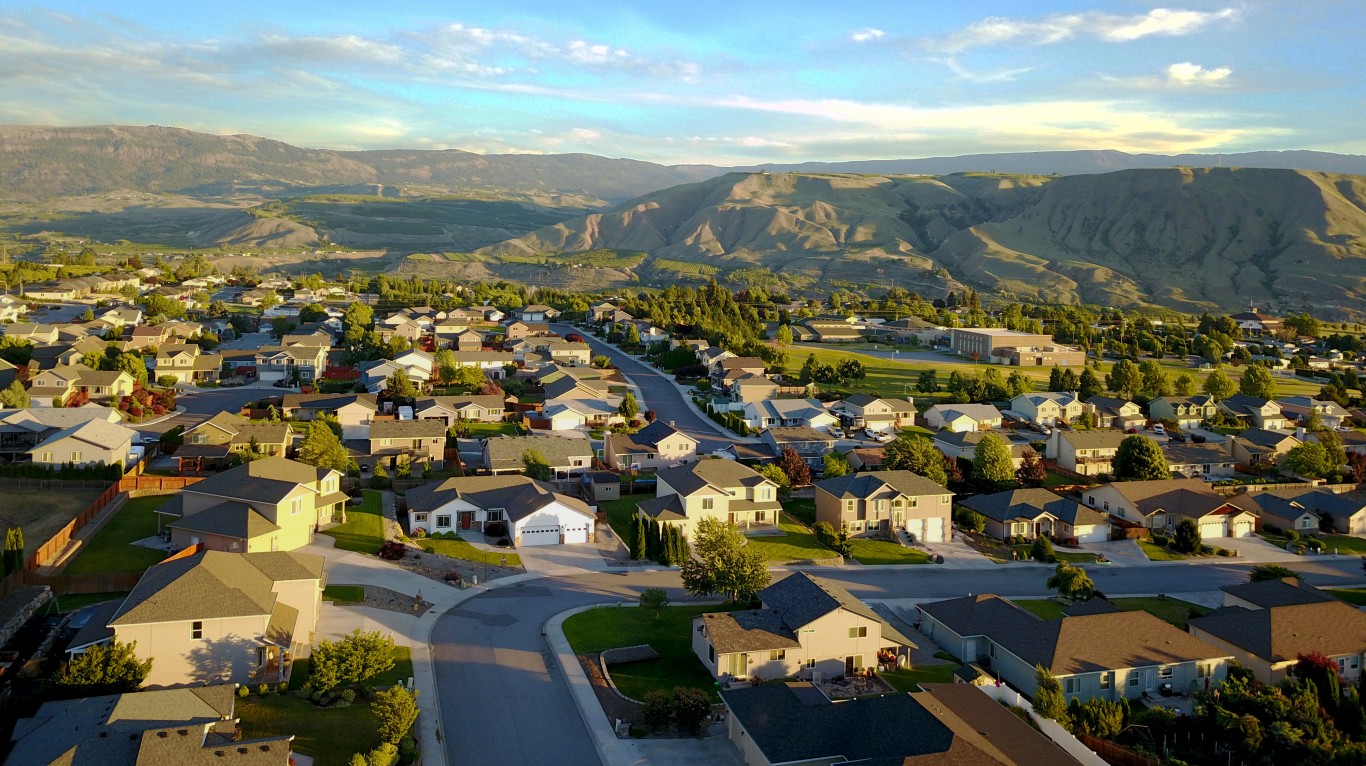
35. Washington
> Per capita annual alcohol consumption (14 and older): 2.26 gallons
> Excessive drinking rate among adults: 16.5% — 10th lowest
> Share of driving fatalities involving alcohol: 32.7% — 13th highest (total: 892)
> Population: 7,738,692
[in-text-ad]

34. Virginia
> Per capita annual alcohol consumption (14 and older): 2.27 gallons
> Excessive drinking rate among adults: 17.3% — 13th lowest
> Share of driving fatalities involving alcohol: 30.3% — 21st highest (total: 1,243)
> Population: 8,642,274
 24/7 Wall St.
33. Tennessee
> Per capita annual alcohol consumption (14 and older): 2.30 gallons
> Excessive drinking rate among adults: 17.2% — 11th lowest
> Share of driving fatalities involving alcohol: 23.5% — 10th lowest (total: 1,280)
> Population: 6,975,218

32. New Mexico
> Per capita annual alcohol consumption (14 and older): 2.30 gallons
> Excessive drinking rate among adults: 17.4% — 14th lowest
> Share of driving fatalities involving alcohol: 29.4% — 23rd highest (total: 588)
> Population: 2,115,877
[in-text-ad-2]

31. North Carolina
> Per capita annual alcohol consumption (14 and older): 2.31 gallons
> Excessive drinking rate among adults: 16.5% — 9th lowest
> Share of driving fatalities involving alcohol: 25.9% — 16th lowest (total: 1,864)
> Population: 10,551,162
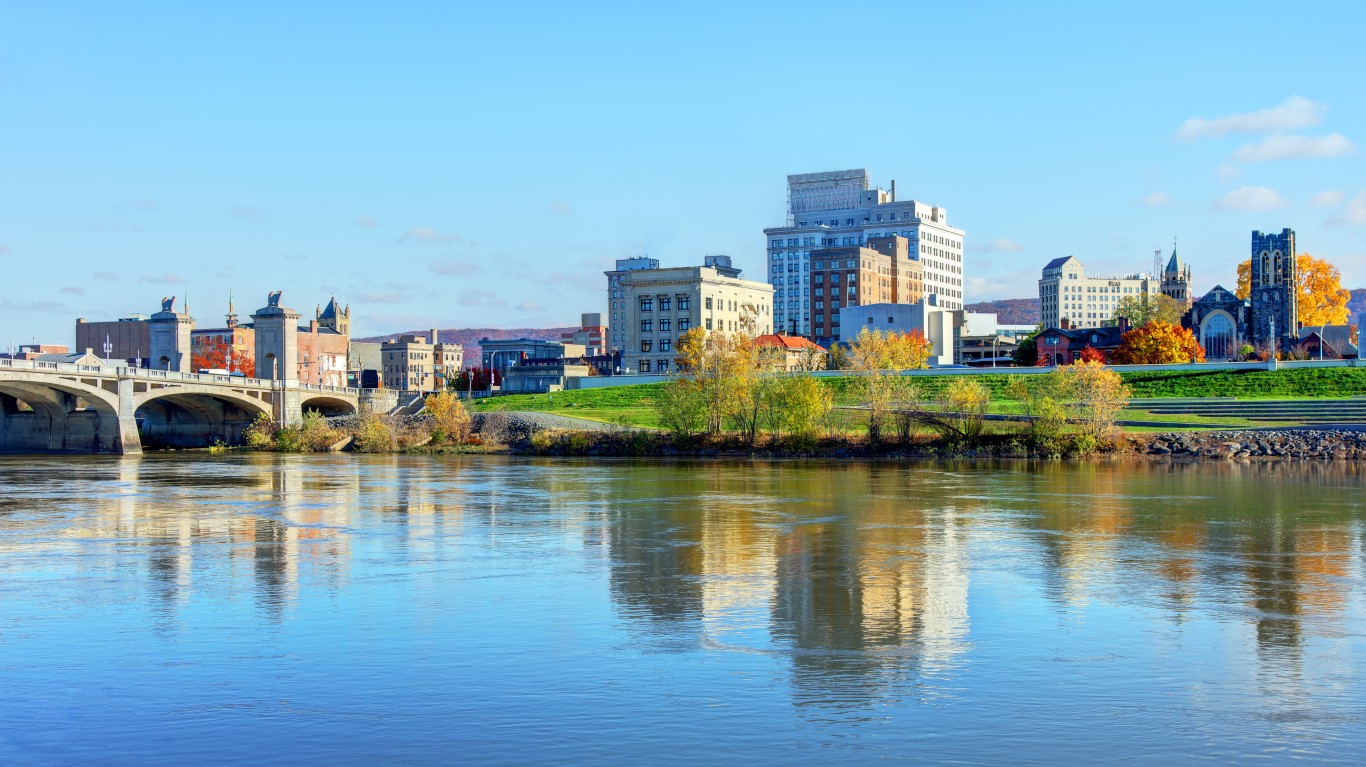
30. Pennsylvania
> Per capita annual alcohol consumption (14 and older): 2.32 gallons
> Excessive drinking rate among adults: 19.8% — 26th lowest
> Share of driving fatalities involving alcohol: 25.4% — 12th lowest (total: 1,447)
> Population: 12,964,056
[in-text-ad]

29. Indiana
> Per capita annual alcohol consumption (14 and older): 2.34 gallons
> Excessive drinking rate among adults: 17.7% — 15th lowest
> Share of driving fatalities involving alcohol: 19.0% — 2nd lowest (total: 817)
> Population: 6,805,985
28. South Dakota
> Per capita annual alcohol consumption (14 and older): 2.34 gallons
> Excessive drinking rate among adults: 24.4% — 3rd highest
> Share of driving fatalities involving alcohol: 36.1% — 5th highest (total: 223)
> Population: 895,376

27. Mississippi
> Per capita annual alcohol consumption (14 and older): 2.39 gallons
> Excessive drinking rate among adults: 15.9% — 5th lowest
> Share of driving fatalities involving alcohol: 18.5% — the lowest (total: 635)
> Population: 2,949,965
[in-text-ad-2]

26. Texas
> Per capita annual alcohol consumption (14 and older): 2.41 gallons
> Excessive drinking rate among adults: 19.6% — 25th lowest
> Share of driving fatalities involving alcohol: 25.4% — 13th lowest (total: 4,739)
> Population: 29,527,941

25. Illinois
> Per capita annual alcohol consumption (14 and older): 2.42 gallons
> Excessive drinking rate among adults: 22.9% — 9th highest
> Share of driving fatalities involving alcohol: 28.8% — 26th lowest (total: 1,557)
> Population: 12,671,469
[in-text-ad]
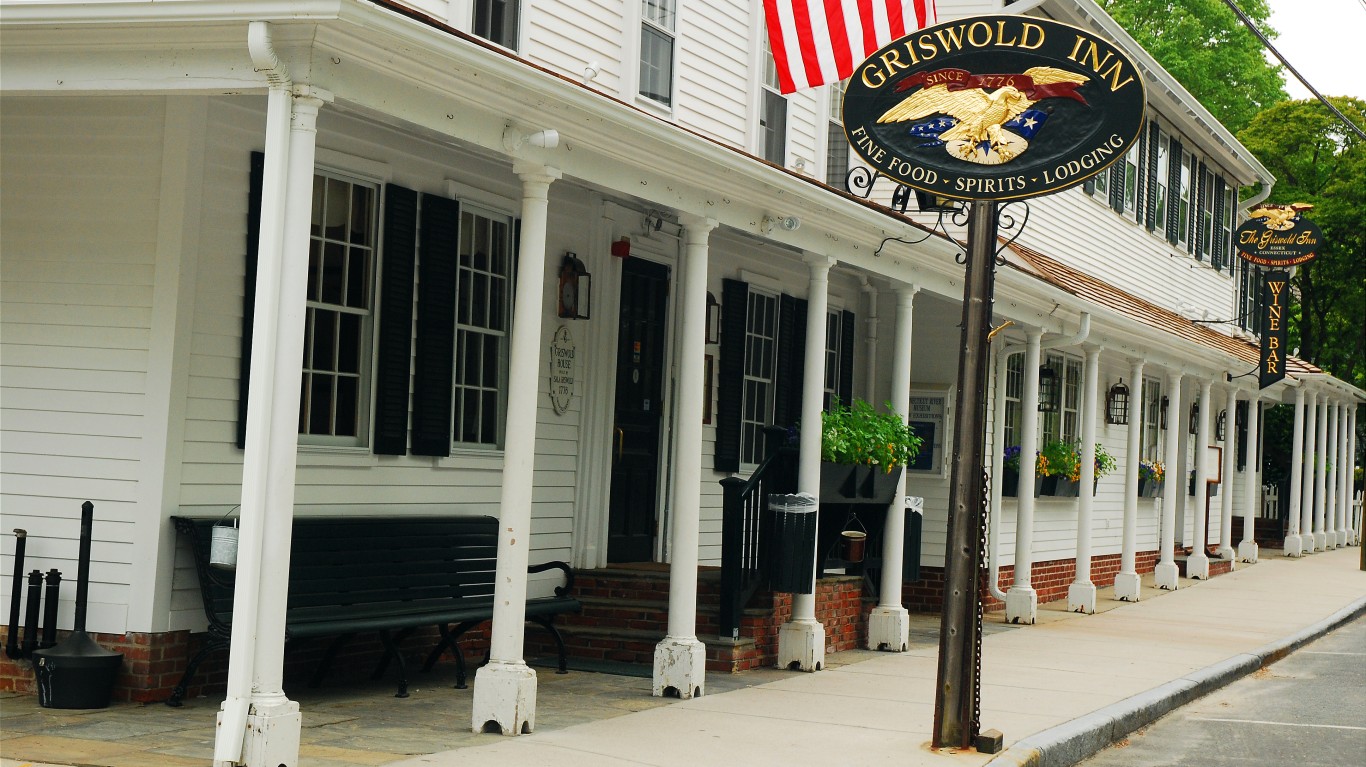
24. Connecticut
> Per capita annual alcohol consumption (14 and older): 2.50 gallons
> Excessive drinking rate among adults: 19.2% — 21st lowest
> Share of driving fatalities involving alcohol: 30.4% — 20th highest (total: 432)
> Population: 3,605,597

23. Iowa
> Per capita annual alcohol consumption (14 and older): 2.50 gallons
> Excessive drinking rate among adults: 24.6% — 2nd highest
> Share of driving fatalities involving alcohol: 26.8% — 19th lowest (total: 461)
> Population: 3,193,079
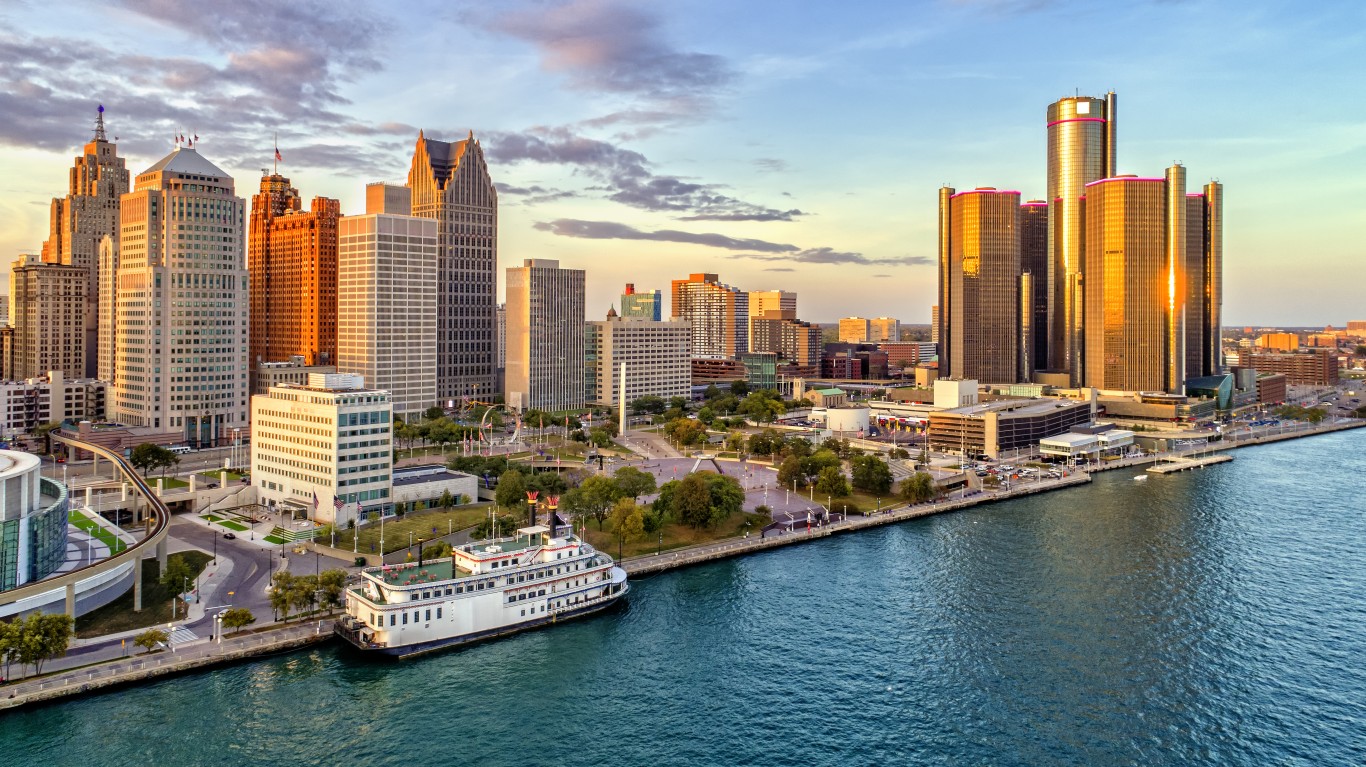
22. Michigan
> Per capita annual alcohol consumption (14 and older): 2.53 gallons
> Excessive drinking rate among adults: 20.5% — 20th highest
> Share of driving fatalities involving alcohol: 29.2% — 24th highest (total: 1,502)
> Population: 10,050,811
[in-text-ad-2]

21. Louisiana
> Per capita annual alcohol consumption (14 and older): 2.59 gallons
> Excessive drinking rate among adults: 21.9% — 12th highest
> Share of driving fatalities involving alcohol: 31.2% — 17th highest (total: 1,203)
> Population: 4,624,047
20. Massachusetts
> Per capita annual alcohol consumption (14 and older): 2.62 gallons
> Excessive drinking rate among adults: 22.5% — 10th highest
> Share of driving fatalities involving alcohol: 30.5% — 19th highest (total: 541)
> Population: 6,984,723
[in-text-ad]
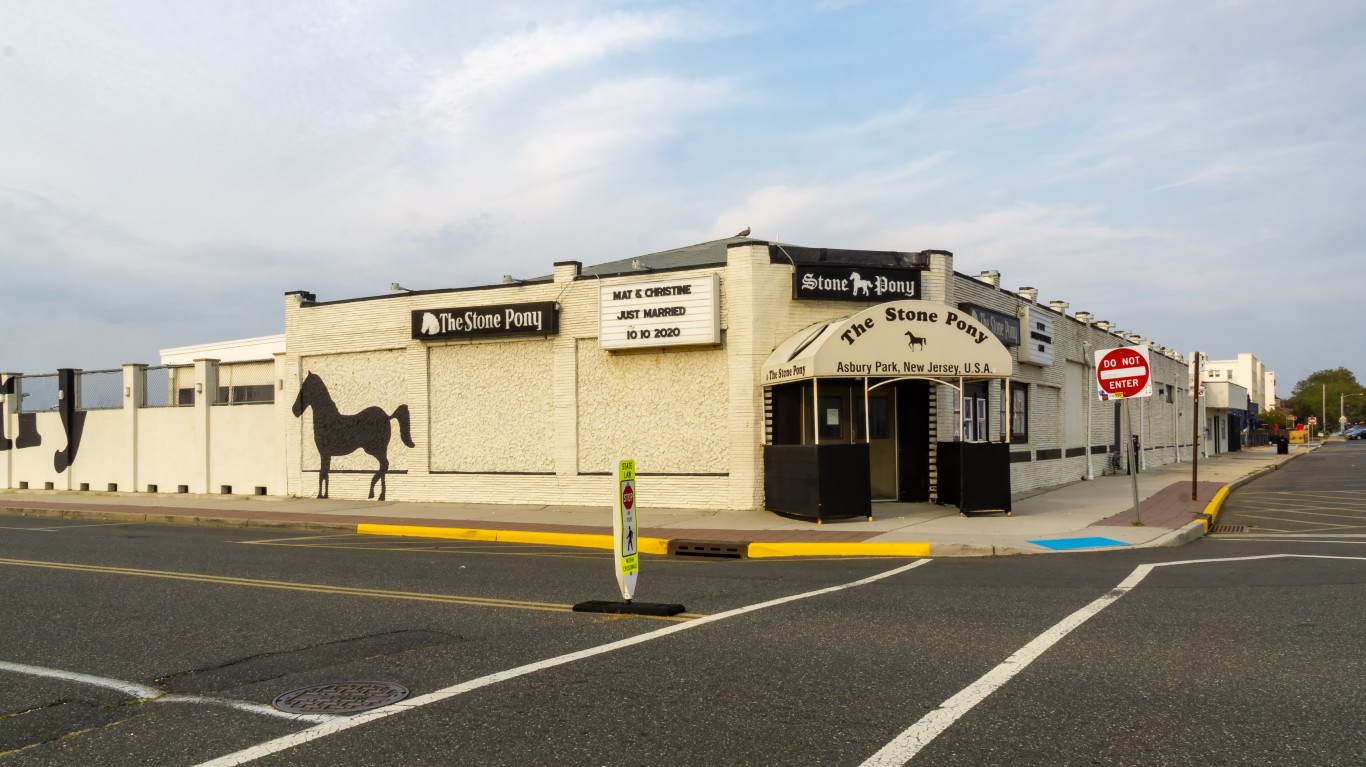
19. New Jersey
> Per capita annual alcohol consumption (14 and older): 2.63 gallons
> Excessive drinking rate among adults: 16.0% — 8th lowest
> Share of driving fatalities involving alcohol: 22.8% — 9th lowest (total: 669)
> Population: 9,267,130

18. California
> Per capita annual alcohol consumption (14 and older): 2.63 gallons
> Excessive drinking rate among adults: 18.8% — 20th lowest
> Share of driving fatalities involving alcohol: 27.7% — 23rd lowest (total: 5,185)
> Population: 39,237,836

17. Missouri
> Per capita annual alcohol consumption (14 and older): 2.68 gallons
> Excessive drinking rate among adults: 19.5% — 23rd lowest
> Share of driving fatalities involving alcohol: 27.6% — 22nd lowest (total: 1,286)
> Population: 6,168,187
[in-text-ad-2]

16. Hawaii
> Per capita annual alcohol consumption (14 and older): 2.71 gallons
> Excessive drinking rate among adults: 20.7% — 17th highest
> Share of driving fatalities involving alcohol: 31.5% — 16th highest (total: 169)
> Population: 1,441,553

15. Oregon
> Per capita annual alcohol consumption (14 and older): 2.71 gallons
> Excessive drinking rate among adults: 21.2% — 15th highest
> Share of driving fatalities involving alcohol: 27.9% — 24th lowest (total: 680)
> Population: 4,246,155
[in-text-ad]

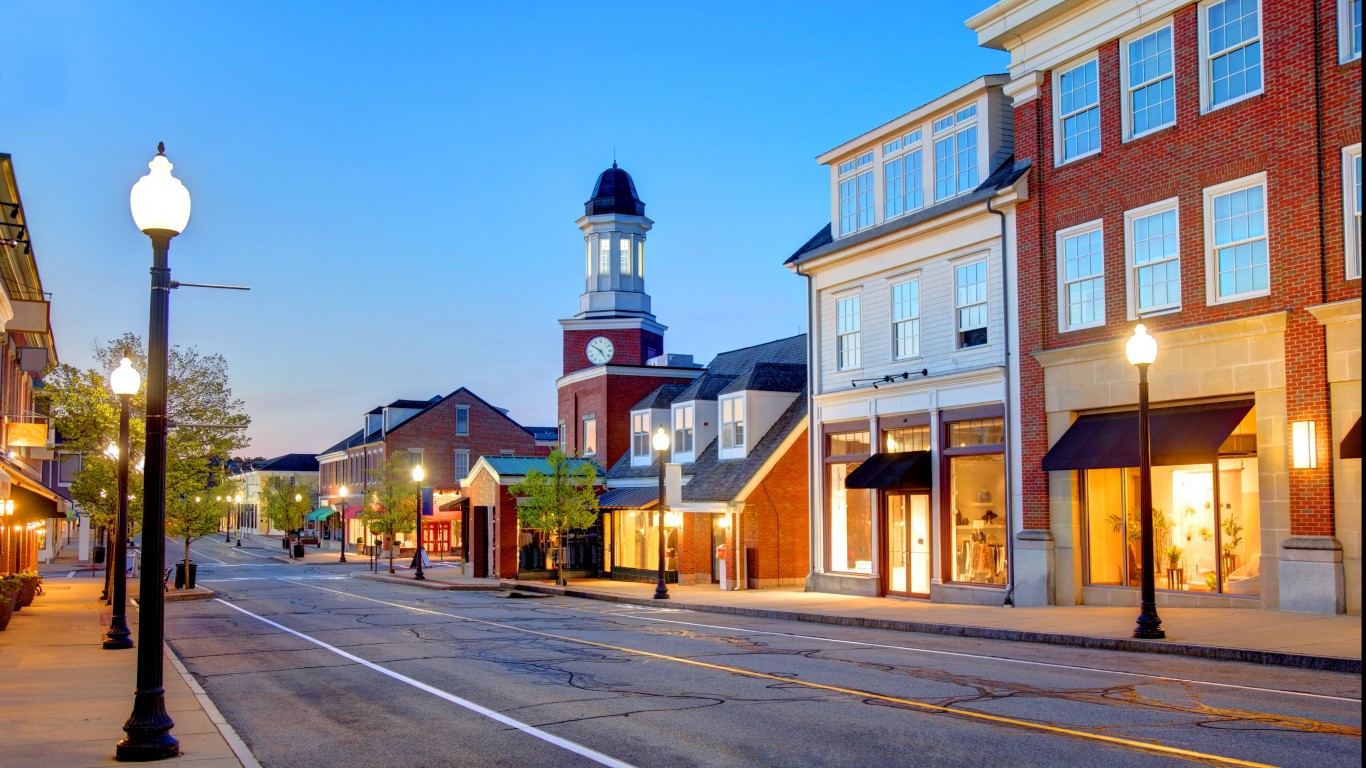
14. Rhode Island
> Per capita annual alcohol consumption (14 and older): 2.71 gallons
> Excessive drinking rate among adults: 21.7% — 13th highest
> Share of driving fatalities involving alcohol: 40.3% — 3rd highest (total: 128)
> Population: 1,095,610

13. Florida
> Per capita annual alcohol consumption (14 and older): 2.74 gallons
> Excessive drinking rate among adults: 20.2% — 22nd highest
> Share of driving fatalities involving alcohol: 22.0% — 7th lowest (total: 3,503)
> Population: 21,781,128
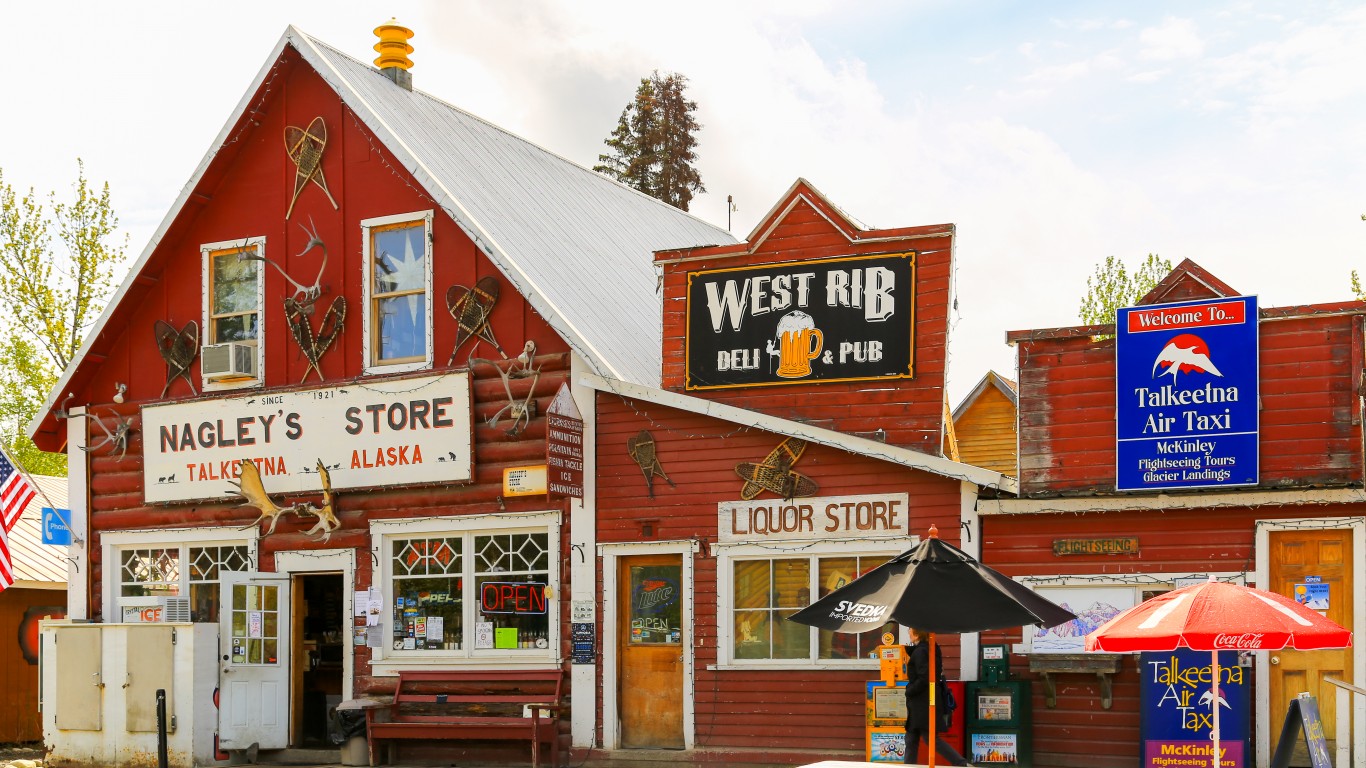
12. Alaska
> Per capita annual alcohol consumption (14 and older): 2.83 gallons
> Excessive drinking rate among adults: 18.1% — 16th lowest
> Share of driving fatalities involving alcohol: 36.9% — 4th highest (total: 138)
> Population: 732,673
[in-text-ad-2]

11. Minnesota
> Per capita annual alcohol consumption (14 and older): 2.85 gallons
> Excessive drinking rate among adults: 23.4% — 6th highest
> Share of driving fatalities involving alcohol: 29.9% — 22nd highest (total: 564)
> Population: 5,707,390
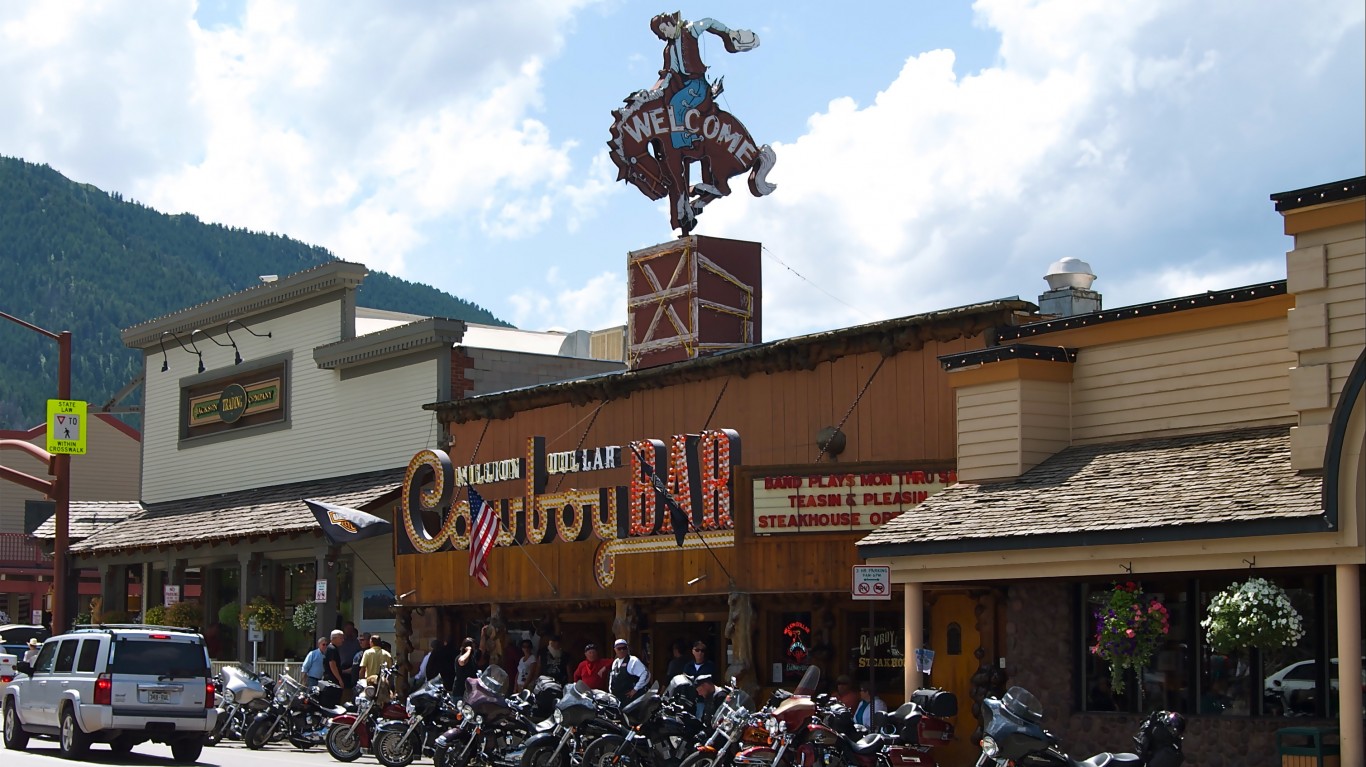
10. Wyoming
> Per capita annual alcohol consumption (14 and older): 2.94 gallons
> Excessive drinking rate among adults: 20.5% — 21st highest
> Share of driving fatalities involving alcohol: 31.8% — 15th highest (total: 197)
> Population: 578,803
[in-text-ad]

9. Colorado
> Per capita annual alcohol consumption (14 and older): 2.97 gallons
> Excessive drinking rate among adults: 20.1% — 23rd highest
> Share of driving fatalities involving alcohol: 34.0% — 9th highest (total: 1,055)
> Population: 5,812,069
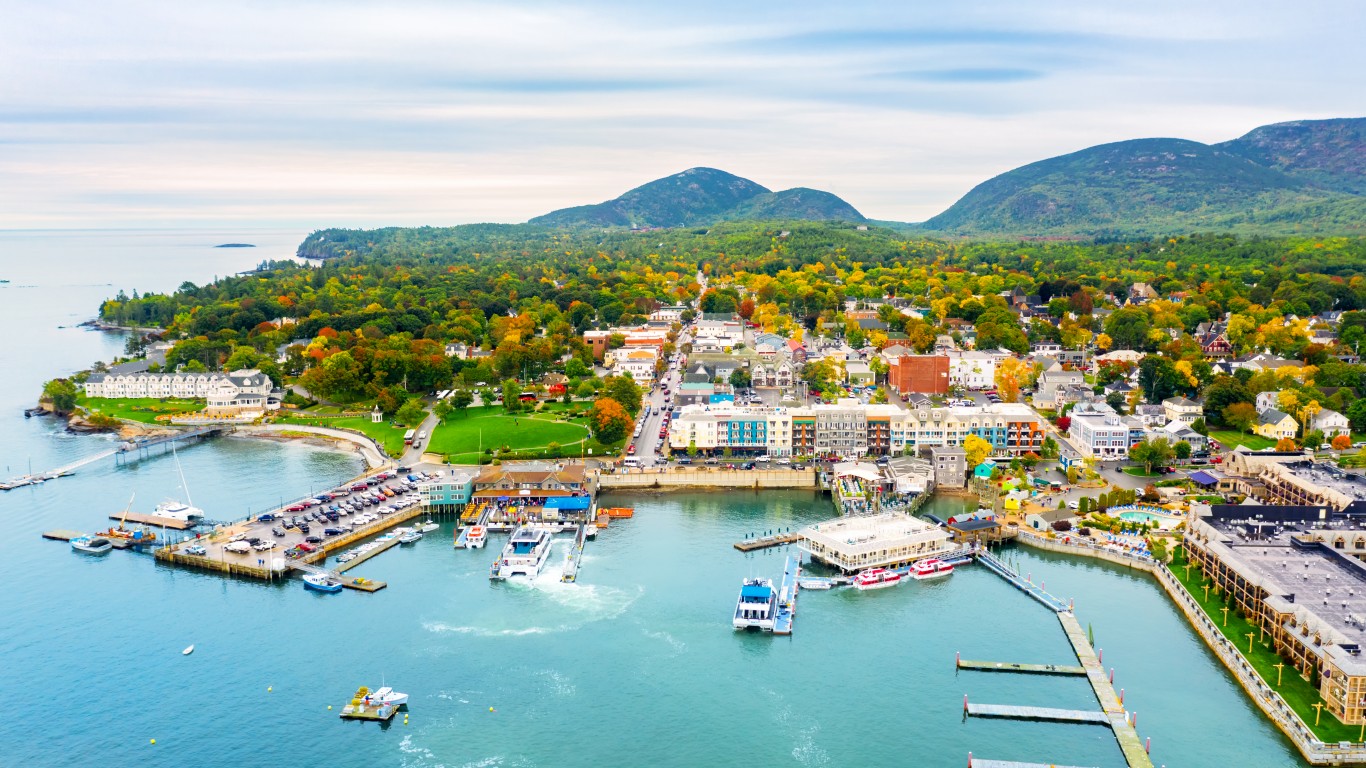
8. Maine
> Per capita annual alcohol consumption (14 and older): 2.99 gallons
> Excessive drinking rate among adults: 22.5% — 11th highest
> Share of driving fatalities involving alcohol: 34.4% — 8th highest (total: 272)
> Population: 1,372,247
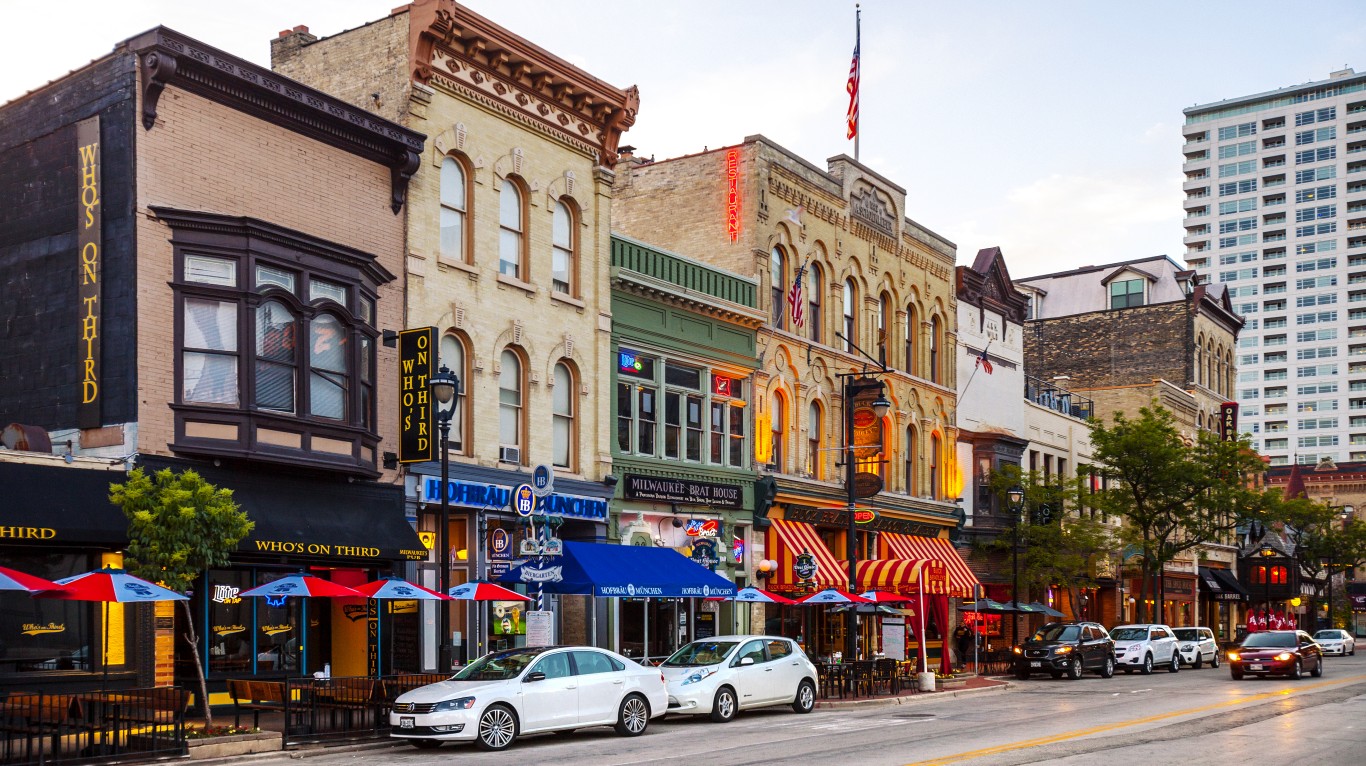
7. Wisconsin
> Per capita annual alcohol consumption (14 and older): 3.11 gallons
> Excessive drinking rate among adults: 25.2% — the highest
> Share of driving fatalities involving alcohol: 35.6% — 6th highest (total: 1,064)
> Population: 5,895,908
[in-text-ad-2]
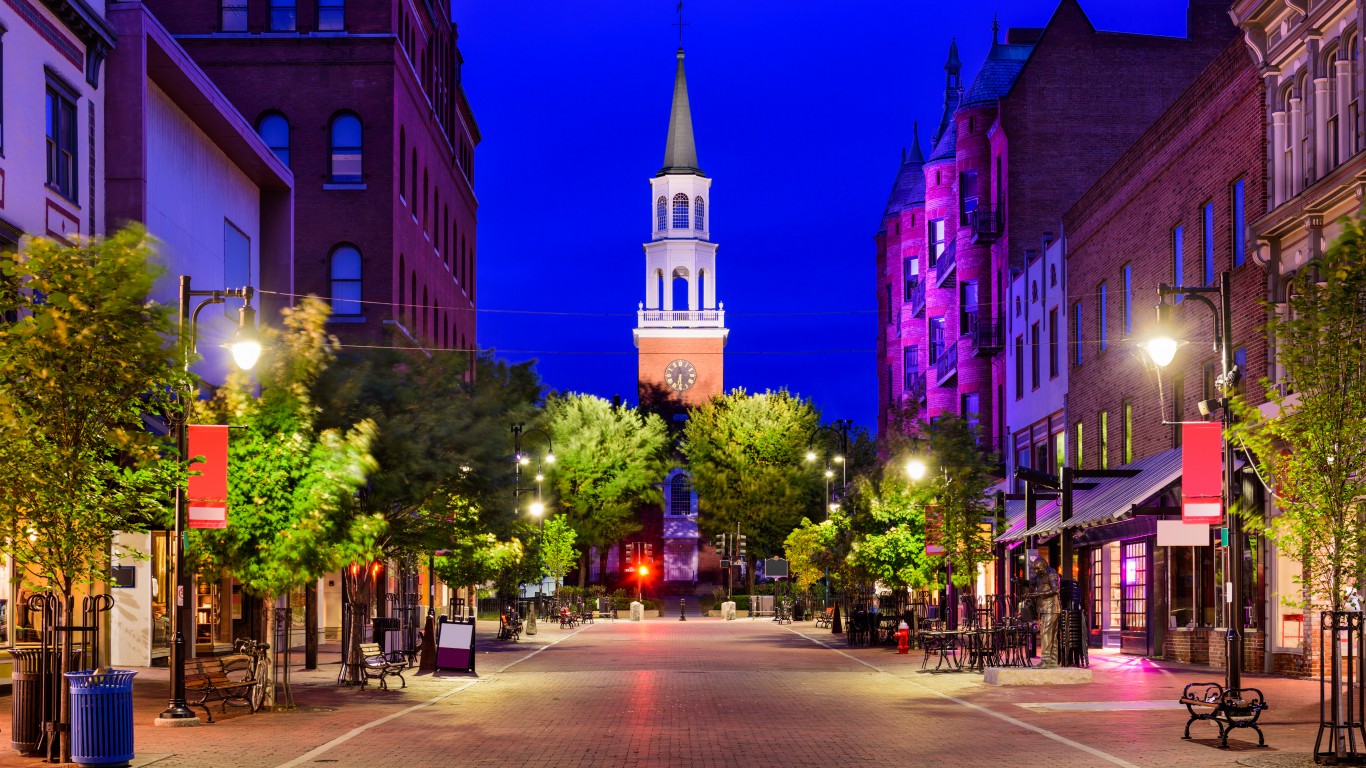
6. Vermont
> Per capita annual alcohol consumption (14 and older): 3.22 gallons
> Excessive drinking rate among adults: 23.2% — 7th highest
> Share of driving fatalities involving alcohol: 35.4% — 7th highest (total: 109)
> Population: 645,570

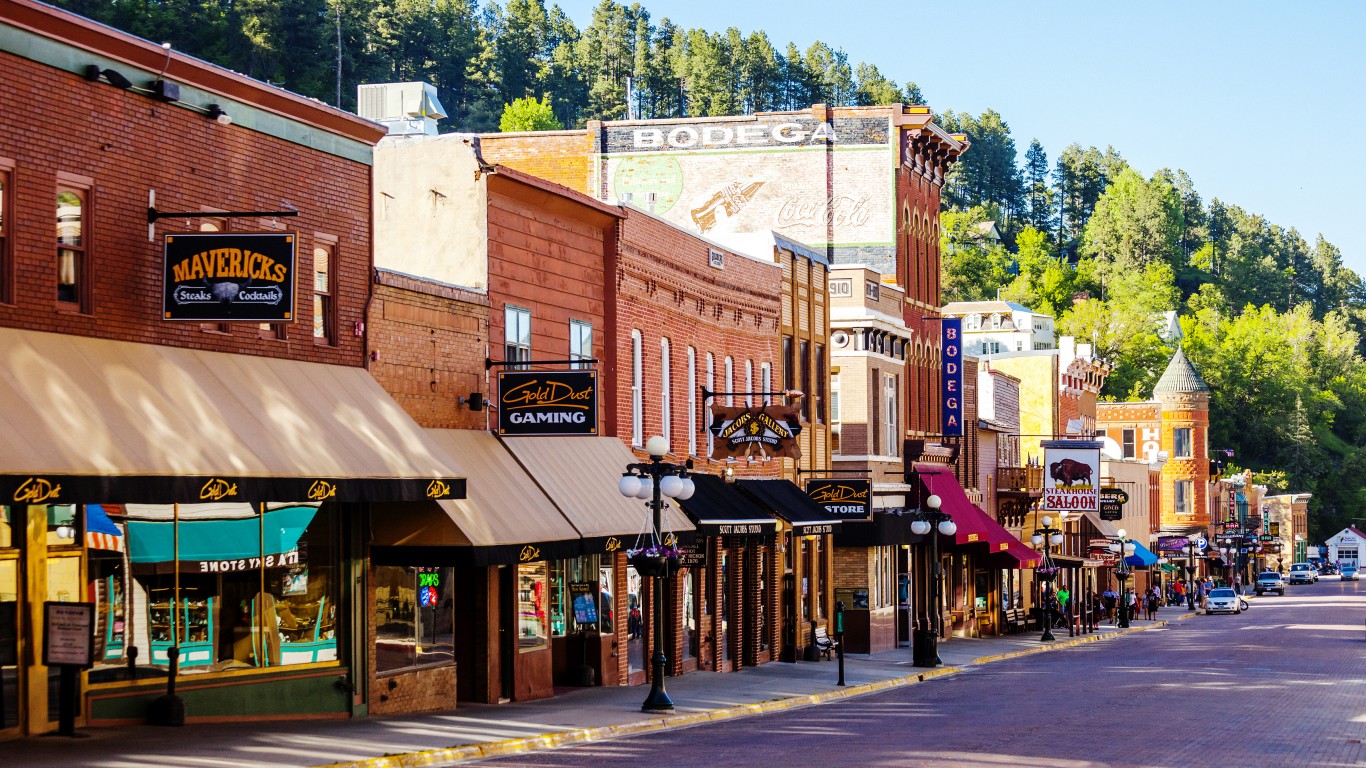
5. North Dakota
> Per capita annual alcohol consumption (14 and older): 3.26 gallons
> Excessive drinking rate among adults: 24.1% — 5th highest
> Share of driving fatalities involving alcohol: 41.4% — 2nd highest (total: 221)
> Population: 774,948
[in-text-ad]
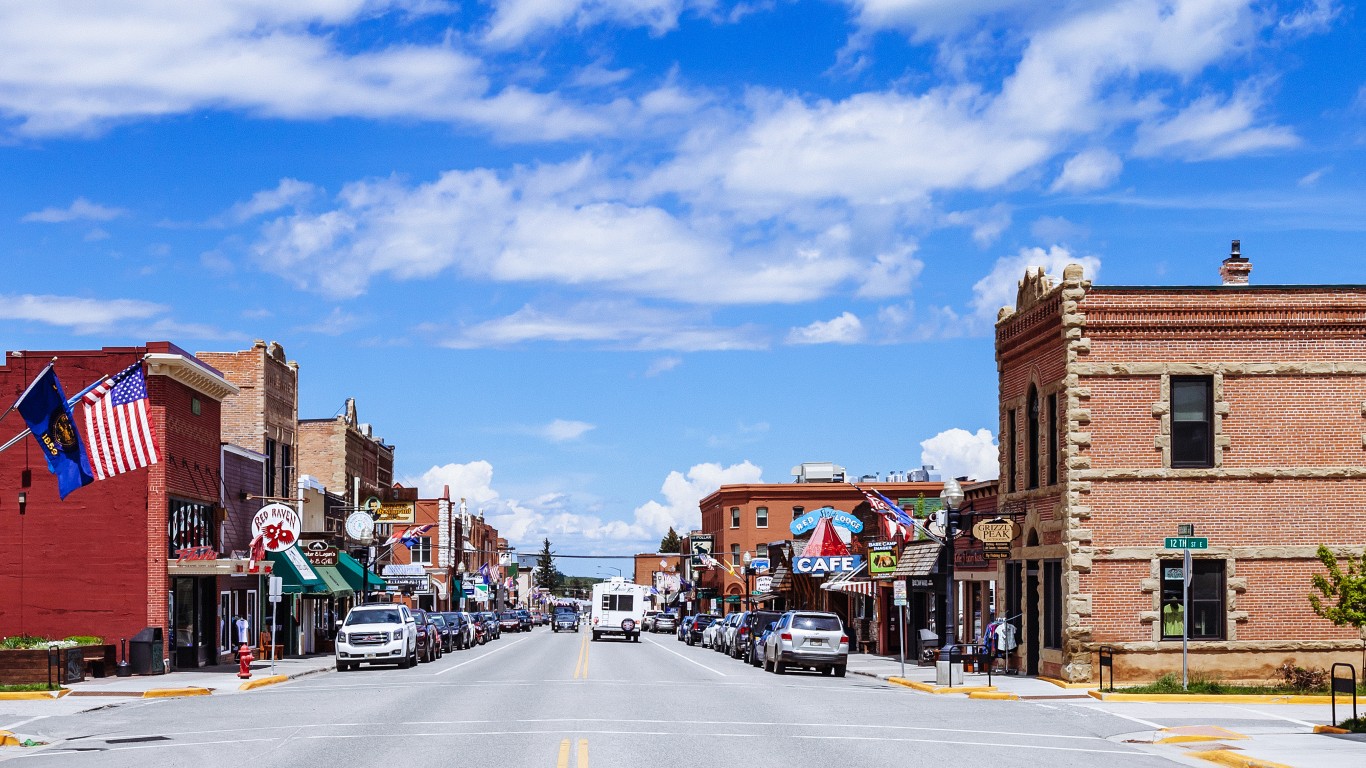
4. Montana
> Per capita annual alcohol consumption (14 and older): 3.32 gallons
> Excessive drinking rate among adults: 24.3% — 4th highest
> Share of driving fatalities involving alcohol: 46.4% — the highest (total: 443)
> Population: 1,104,271
 24/7 Wall St.
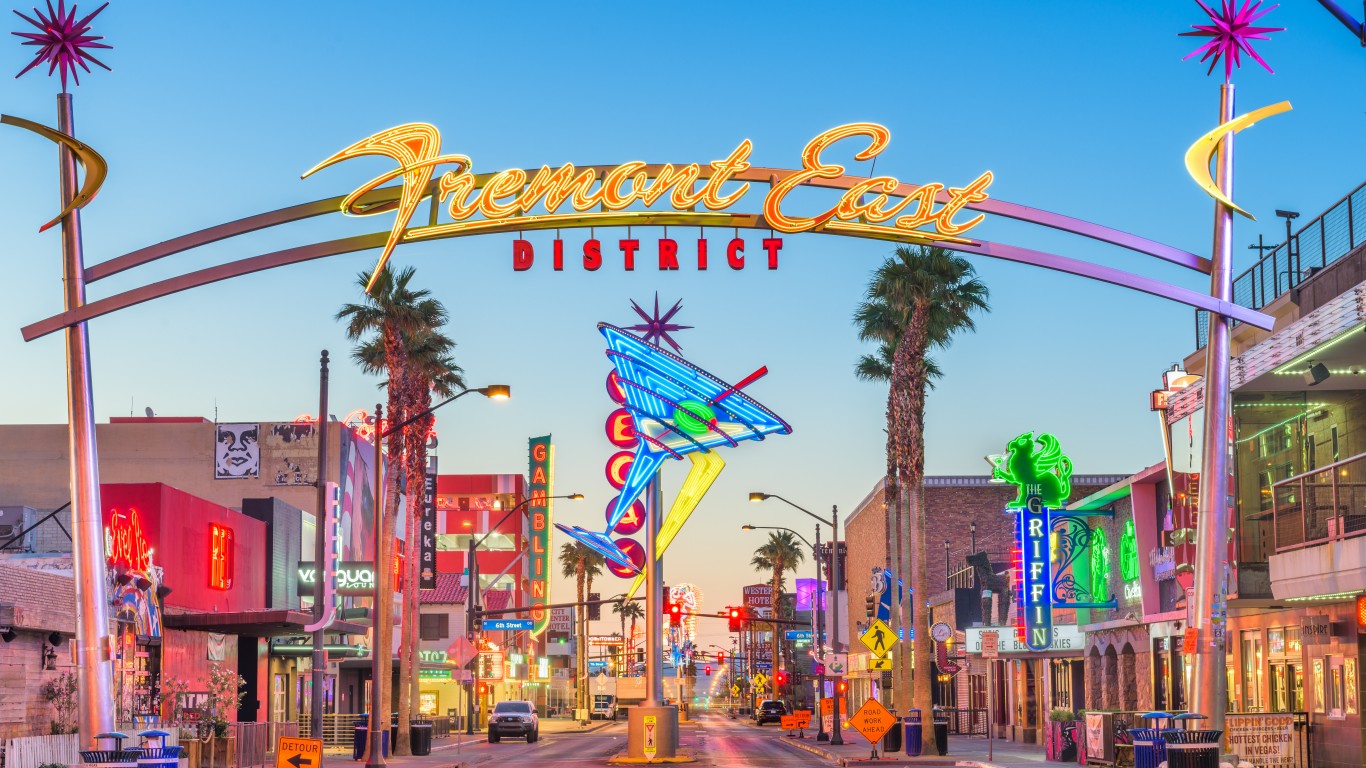
3. Nevada
> Per capita annual alcohol consumption (14 and older): 3.43 gallons
> Excessive drinking rate among adults: 19.5% — 22nd lowest
> Share of driving fatalities involving alcohol: 27.3% — 21st lowest (total: 435)
> Population: 3,143,991
2. Delaware
> Per capita annual alcohol consumption (14 and older): 4.01 gallons
> Excessive drinking rate among adults: 20.5% — 19th highest
> Share of driving fatalities involving alcohol: 25.0% — 11th lowest (total: 149)
> Population: 1,003,384
[in-text-ad-2]

1. New Hampshire
> Per capita annual alcohol consumption (14 and older): 4.83 gallons
> Excessive drinking rate among adults: 20.8% — 16th highest
> Share of driving fatalities involving alcohol: 33.1% — 11th highest (total: 195)
> Population: 1,388,992
Get Ready To Retire (Sponsored)
Start by taking a quick retirement quiz from SmartAsset that will match you with up to 3 financial advisors that serve your area and beyond in 5 minutes, or less.
Each advisor has been vetted by SmartAsset and is held to a fiduciary standard to act in your best interests.
Here’s how it works:
1. Answer SmartAsset advisor match quiz
2. Review your pre-screened matches at your leisure. Check out the advisors’ profiles.
3. Speak with advisors at no cost to you. Have an introductory call on the phone or introduction in person and choose whom to work with in the future
Thank you for reading! Have some feedback for us?
Contact the 24/7 Wall St. editorial team.
Latest from 24/7


Our expert who first called NVIDIA in 2009 is predicting 2025 will see a historic AI breakthrough.
You can follow him investing $500,000 of his own money on our top AI stocks for free.