During the COVID-19 pandemic, demand for single-family housing surged as supply constraints reduced inventory. These conditions not only sent home values soaring, but also gave mortgage lenders and sellers greater leverage in negotiating the terms of home sales. While in recent months these conditions have changed drastically, buyers in many markets are now also forced to put down more cash up front.
According to realtor.com, a real estate data platform, the average down payment for a single family home hit 14% in 2022, up from 11% in 2019. Using the most recent national median home value as reported by the U.S. Census Bureau, this means the average down payment rose from about $31,000 to over $39,000 in the three-year period. (Here is a look at the states where home values increased the most during COVID.)
Historically, banks have required homebuyers to make a downpayment of at least 20% of the sale price. But in many U.S. metropolitan areas, average down payments are considerably higher than that.
Using September 2022 home sale data, realtor.com compiled a list of cities where buyers need a large down payment. 24/7 Wall St. identified the 10 U.S. metro areas with the highest average down payments. Realtor.com considered the average down payment in America’s 300 largest metro areas, limiting the rankings to one per state to ensure geographic diversity. For each market we added relevant data from the U.S. Census Bureau’s 2021 American Community Survey.
High average down payments are indicative of tight housing markets in high demand areas, and, not surprisingly, many of the metro areas on this list also have higher than average home values. The median home purchase price on the places on this list ranges from $375,000 to $900,000, all well above the national median home value of $281,400. (Here is a look at the cities with the most expensive homes.)
Another common feature many of the housing market on this list share is that they are popular vacation and retirement destinations. Historically, down payment rates for second homes have been far higher than for primary residences. And places on this list, which include parts of Hawaii; Boulder, Colorado; and Cape Cod, Massachusetts, are popular spots for vacation homes.
Click here to see 10 cities where home buyers make the highest downpayments.
Click here to see our detailed methodology.
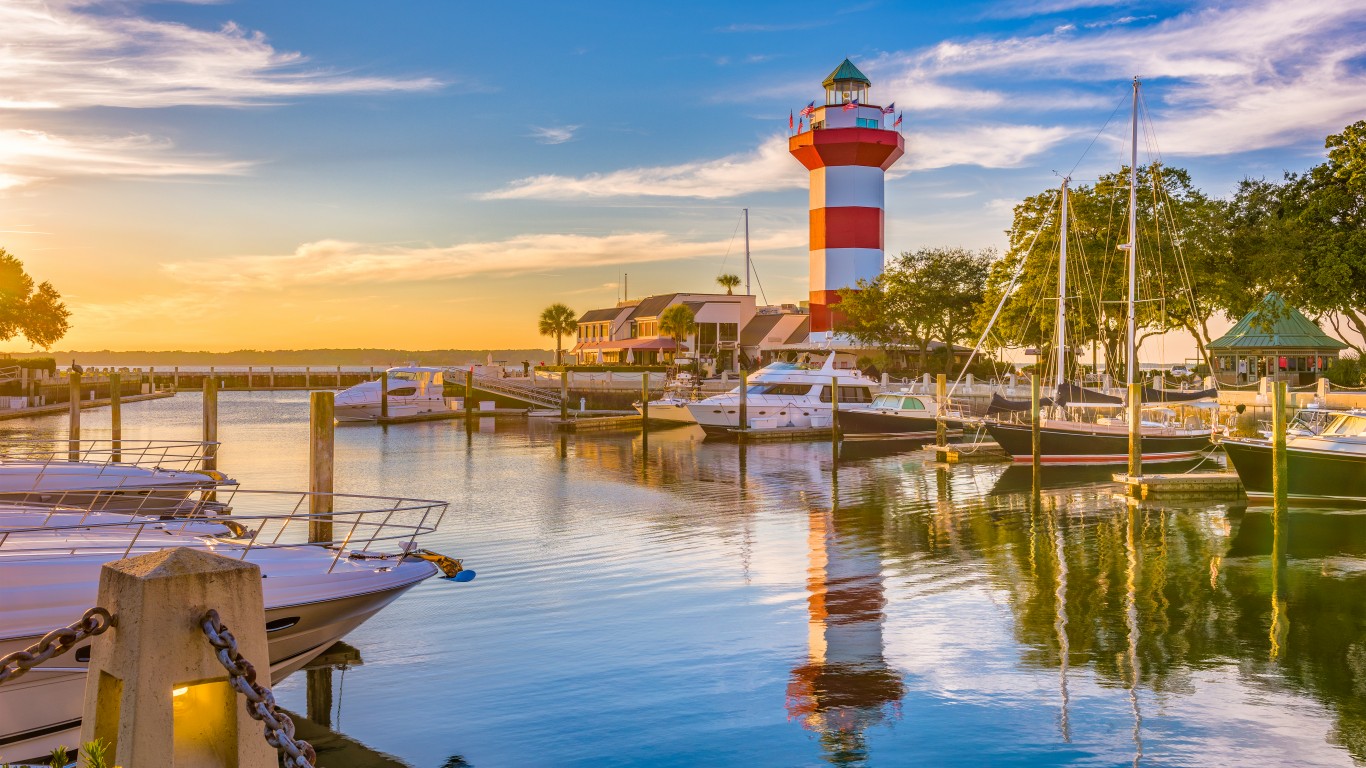
10. Hilton Head, SC
> Avg. down payment: 23.7%
> Median home purchase price: $425,000
> Homeownership rate: 74.7%
> Median monthly housing costs: $1,599 (incl. mortgage payments)
> Typical home size: 6.5 rooms
> Overall cost of living: 2.0% less expensive than avg.
[in-text-ad]
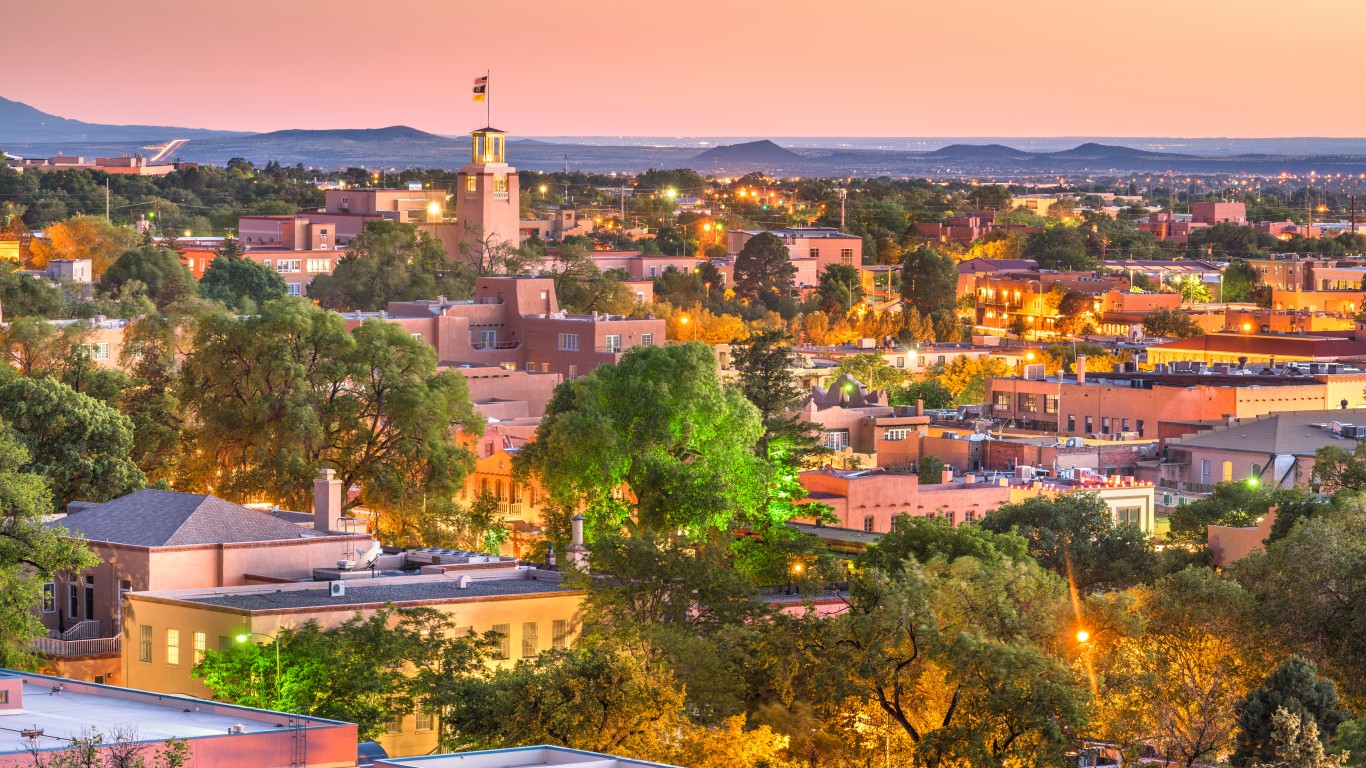
9. Santa Fe, NM
> Avg. down payment: 23.8%
> Median home purchase price: $510,000
> Homeownership rate: 74.4%
> Median monthly housing costs: $1,619 (incl. mortgage payments)
> Typical home size: 5.8 rooms
> Overall cost of living: 5.6% less expensive than avg.
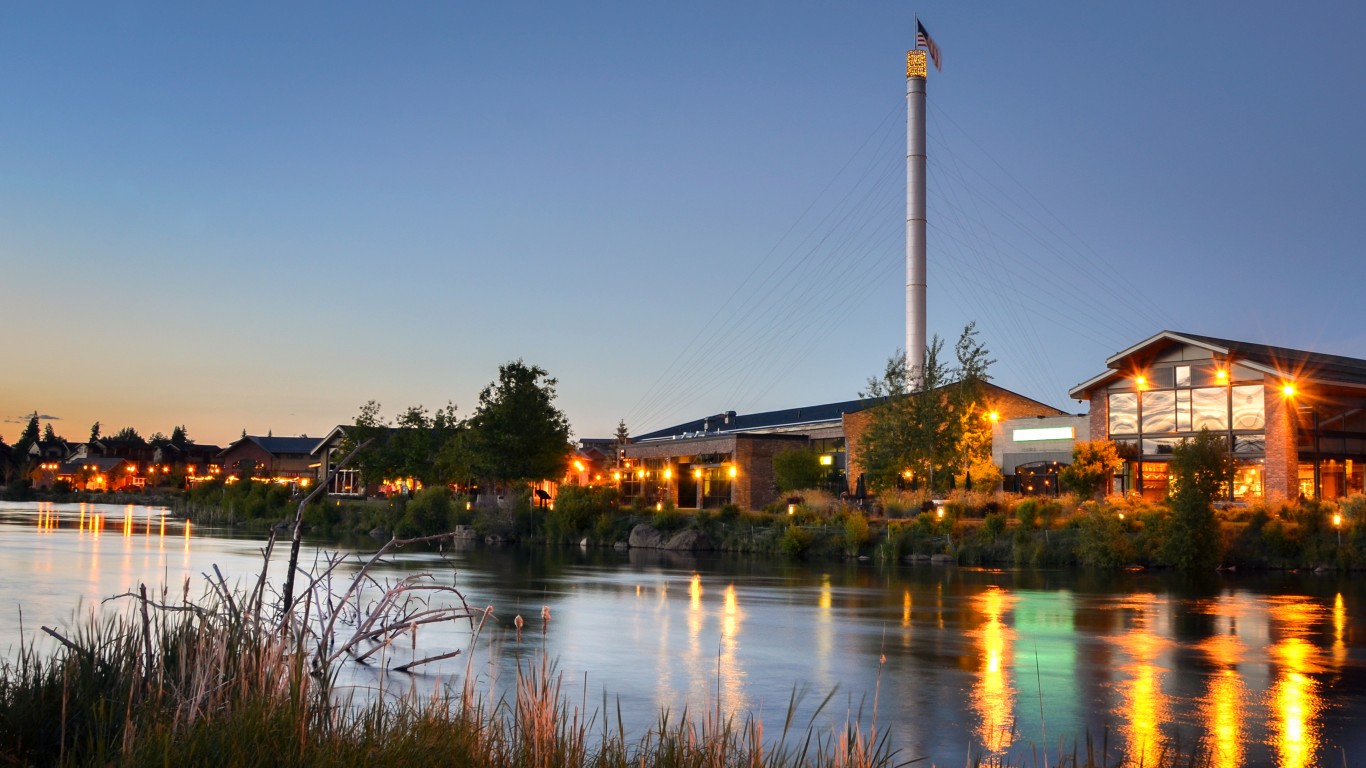
8. Bend, OR
> Avg. down payment: 23.9%
> Median home purchase price: $545,000
> Homeownership rate: 74.9%
> Median monthly housing costs: $1,843 (incl. mortgage payments)
> Typical home size: 5.9 rooms
> Overall cost of living: 2.2% more expensive than avg.
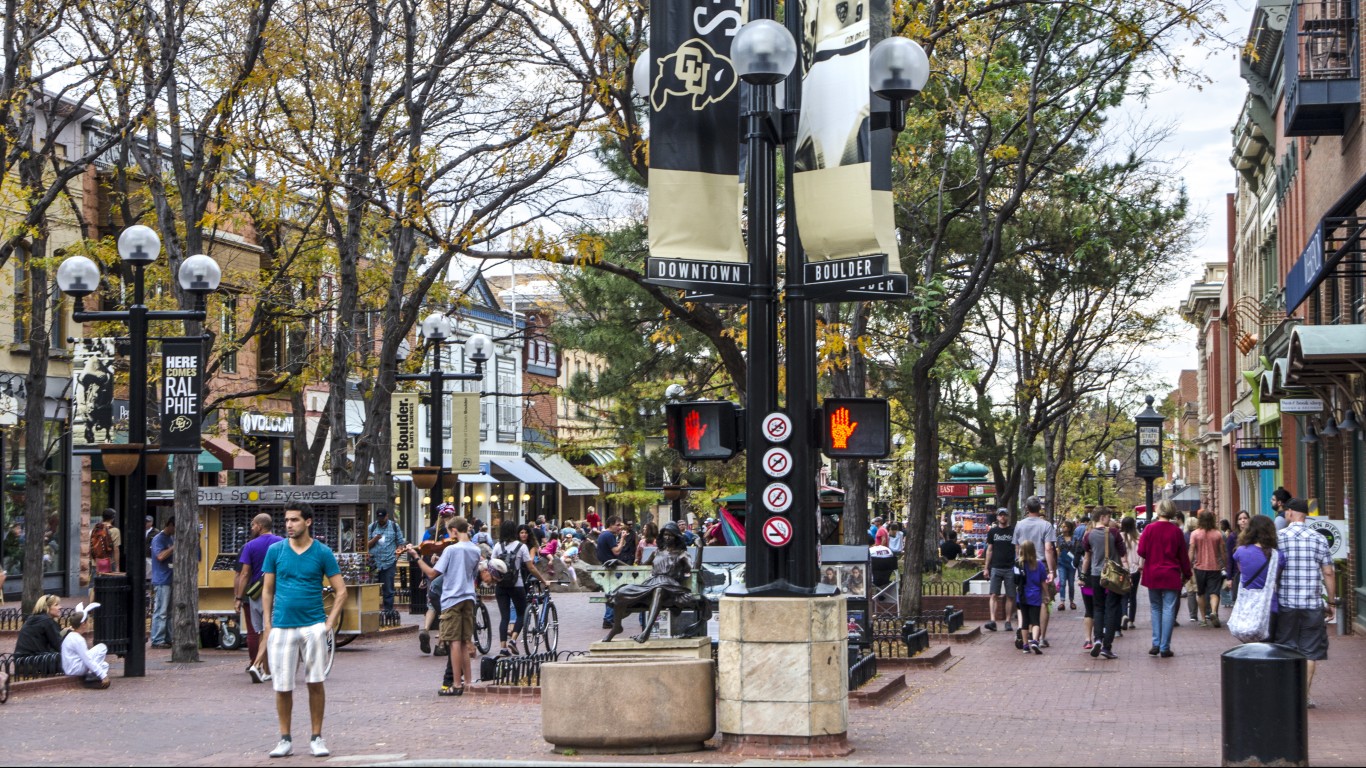
7. Boulder, CO
> Avg. down payment: 23.9%
> Median home purchase price: $683,150
> Homeownership rate: 61.7%
> Median monthly housing costs: $2,291 (incl. mortgage payments)
> Typical home size: 7.1 rooms
> Overall cost of living: 2.6% more expensive than avg.
[in-text-ad-2]

6. Maui, HI
> Avg. down payment: 24.0%
> Median home purchase price: $900,000
> Homeownership rate: 67.1%
> Median monthly housing costs: $2,464 (incl. mortgage payments)
> Typical home size: 5.3 rooms
> Overall cost of living: 9.0% more expensive than avg.
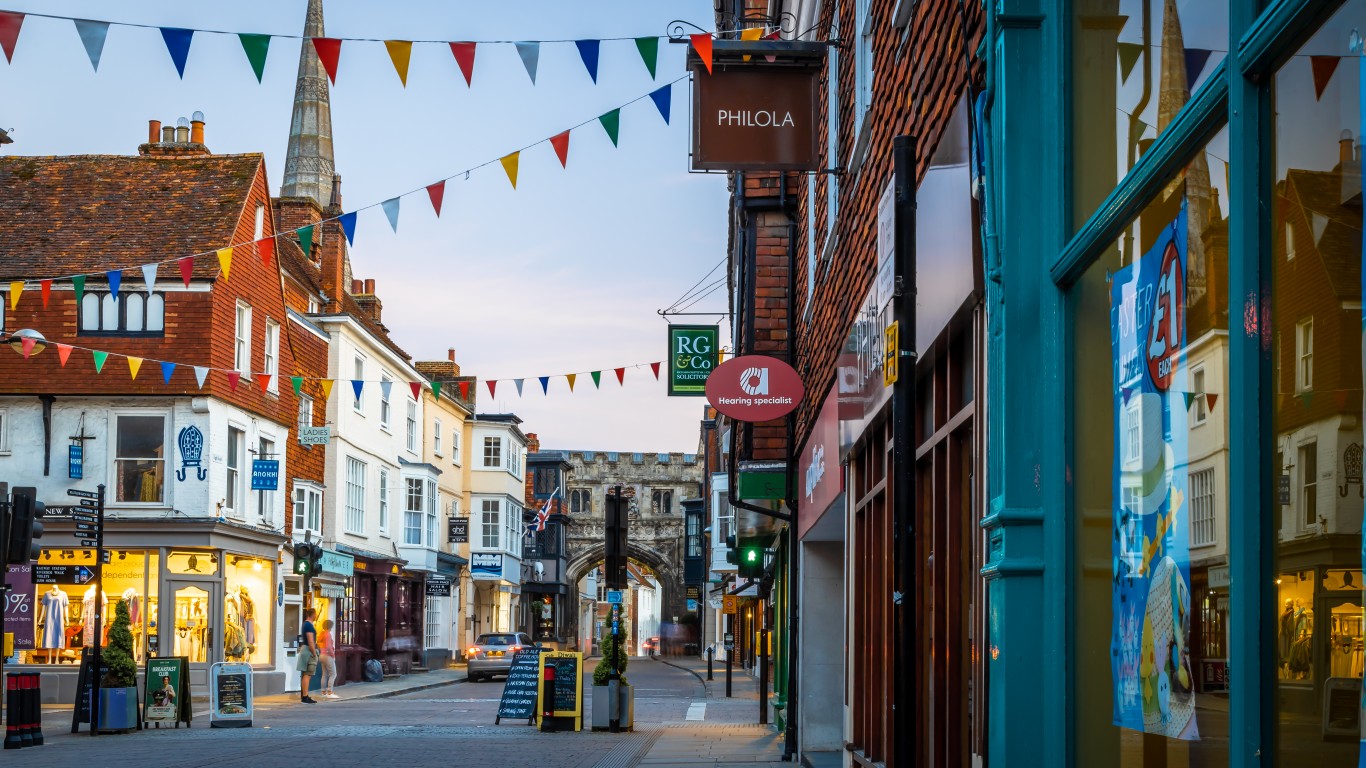
5. Salisbury, MD
> Avg. down payment: 24.0%
> Median home purchase price: $409,990
> Homeownership rate: 76.1%
> Median monthly housing costs: $1,483 (incl. mortgage payments)
> Typical home size: 6.8 rooms
> Overall cost of living: 7.8% less expensive than avg.
[in-text-ad]
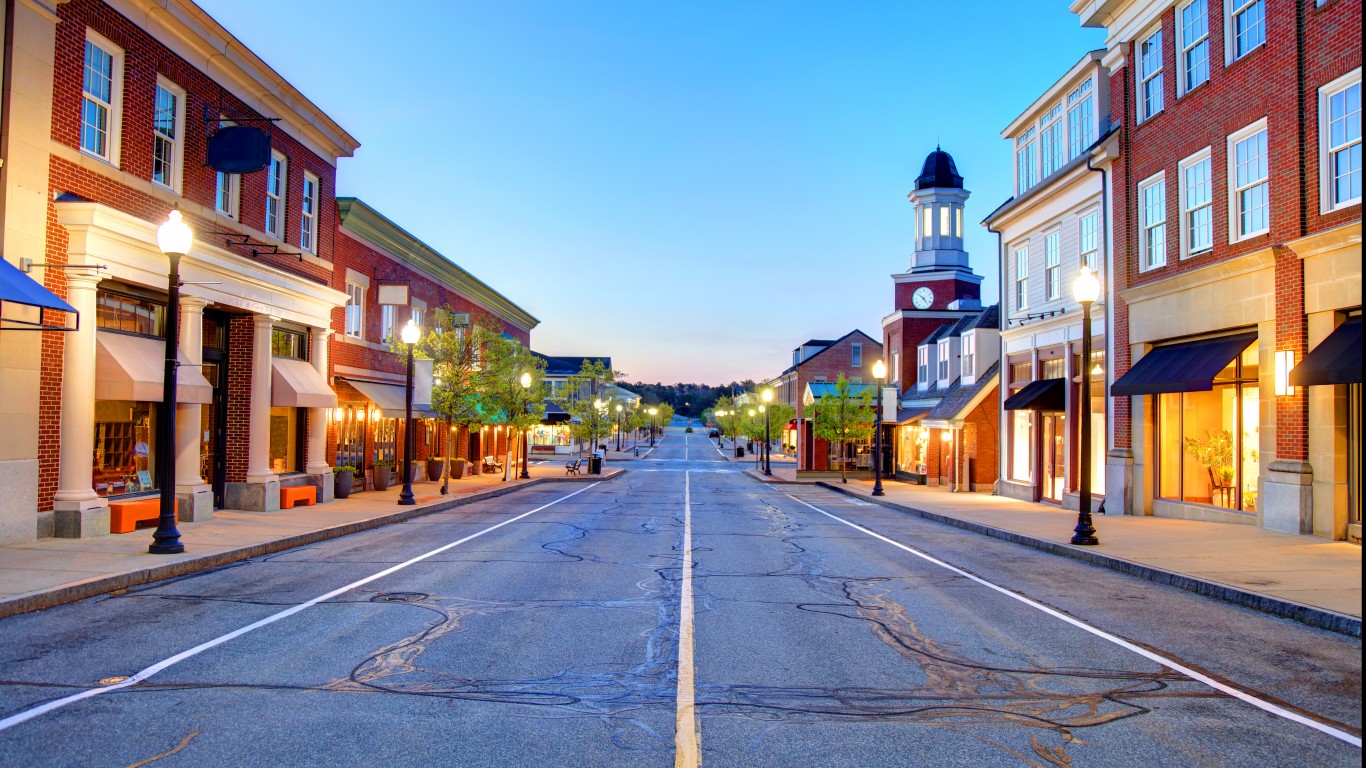
4. Barnstable, MA
> Avg. down payment: 26.0%
> Median home purchase price: $624,000
> Homeownership rate: 82.3%
> Median monthly housing costs: $2,048 (incl. mortgage payments)
> Typical home size: 6.2 rooms
> Overall cost of living: 7.0% more expensive than avg.

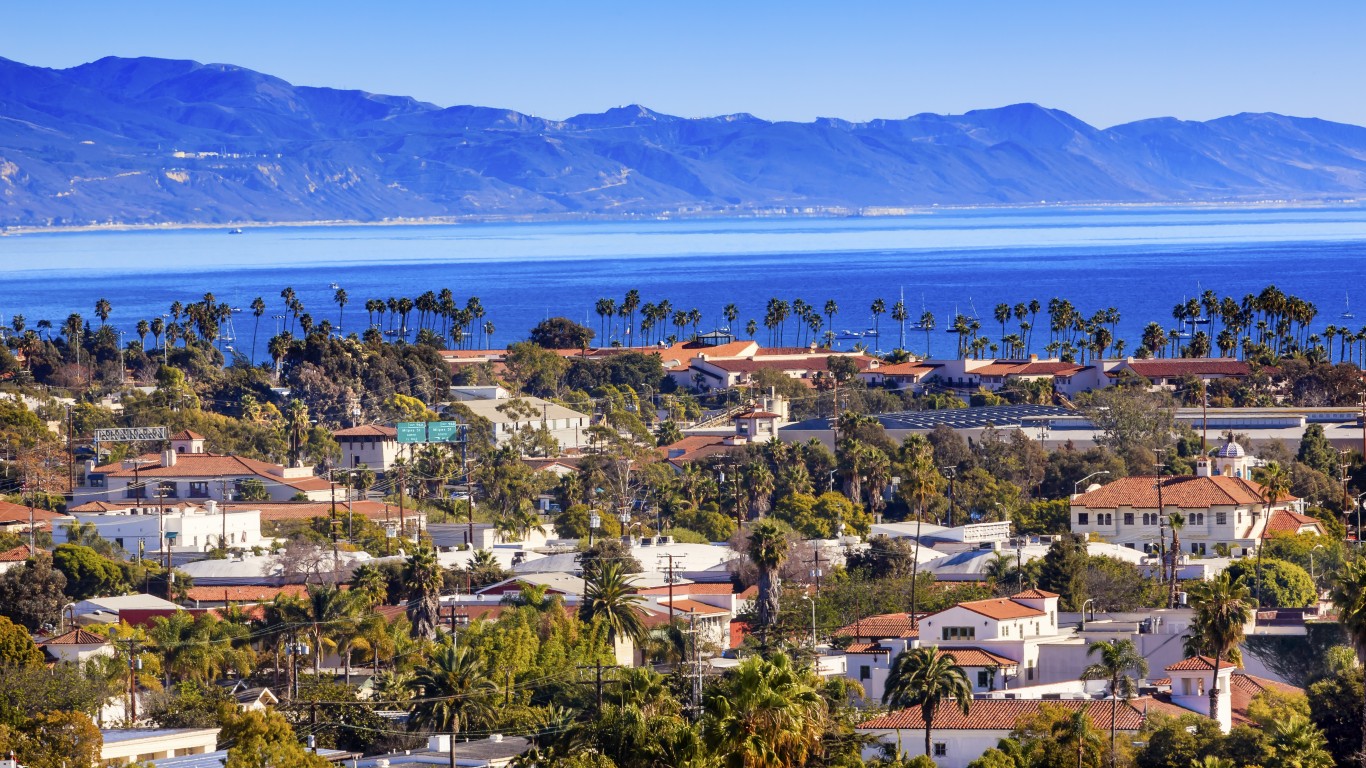
3. Santa Barbara, CA
> Avg. down payment: 26.4%
> Median home purchase price: $800,000
> Homeownership rate: 51.9%
> Median monthly housing costs: $2,509 (incl. mortgage payments)
> Typical home size: 6.0 rooms
> Overall cost of living: 10.0% more expensive than avg.

2. Coeur d’Alene, ID
> Avg. down payment: 27.9%
> Median home purchase price: $530,000
> Homeownership rate: 73.7%
> Median monthly housing costs: $1,476 (incl. mortgage payments)
> Typical home size: 6.5 rooms
> Overall cost of living: 8.4% less expensive than avg.
[in-text-ad-2]
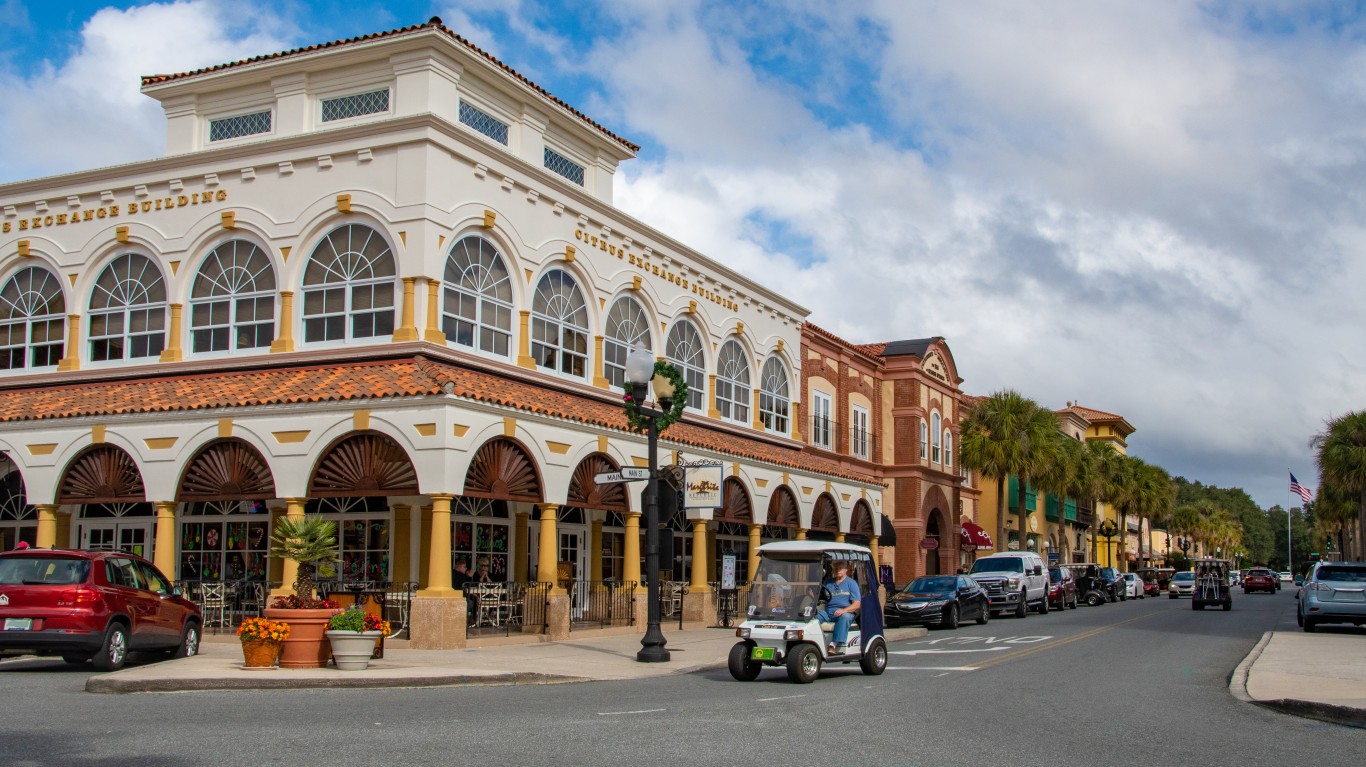
1. The Villages, FL
> Avg. down payment: 30.2%
> Median home purchase price: $375,000
> Homeownership rate: 89.1%
> Median monthly housing costs: $1,422 (incl. mortgage payments)
> Typical home size: 5.5 rooms
> Overall cost of living: 4.4% less expensive than avg.
Methodology
Using September 2022 home sale data, realtor.com compiled a list of cities where buyers need a large down payment. 24/7 Wall St. identified the 10 U.S. metro areas with the highest average down payments. Realtor.com considered the average down payment in America’s 300 largest metro areas, limiting the rankings to one per state to ensure geographic diversity. Metro areas are ranked by the average down payment percentage in Sept. 2022. Median home sale prices are also from realtor.com for the same period.
For each metro area on this list, we also considered the homeownership rate, median monthly housing costs for homeowners with a mortgage, and median home size by room count with data from the U.S. Census Bureau’s 2021 American Community Survey.
Data on overall cost of living is from the Bureau of Economic Analysis and is for the year 2020.
The Average American Is Losing Their Savings Every Day (Sponsor)
If you’re like many Americans and keep your money ‘safe’ in a checking or savings account, think again. The average yield on a savings account is a paltry .4% today, and inflation is much higher. Checking accounts are even worse.
Every day you don’t move to a high-yield savings account that beats inflation, you lose more and more value.
But there is good news. To win qualified customers, some accounts are paying 9-10x this national average. That’s an incredible way to keep your money safe, and get paid at the same time. Our top pick for high yield savings accounts includes other one time cash bonuses, and is FDIC insured.
Click here to see how much more you could be earning on your savings today. It takes just a few minutes and your money could be working for you.
Thank you for reading! Have some feedback for us?
Contact the 24/7 Wall St. editorial team.
 24/7 Wall St.
 24/7 Wall St.