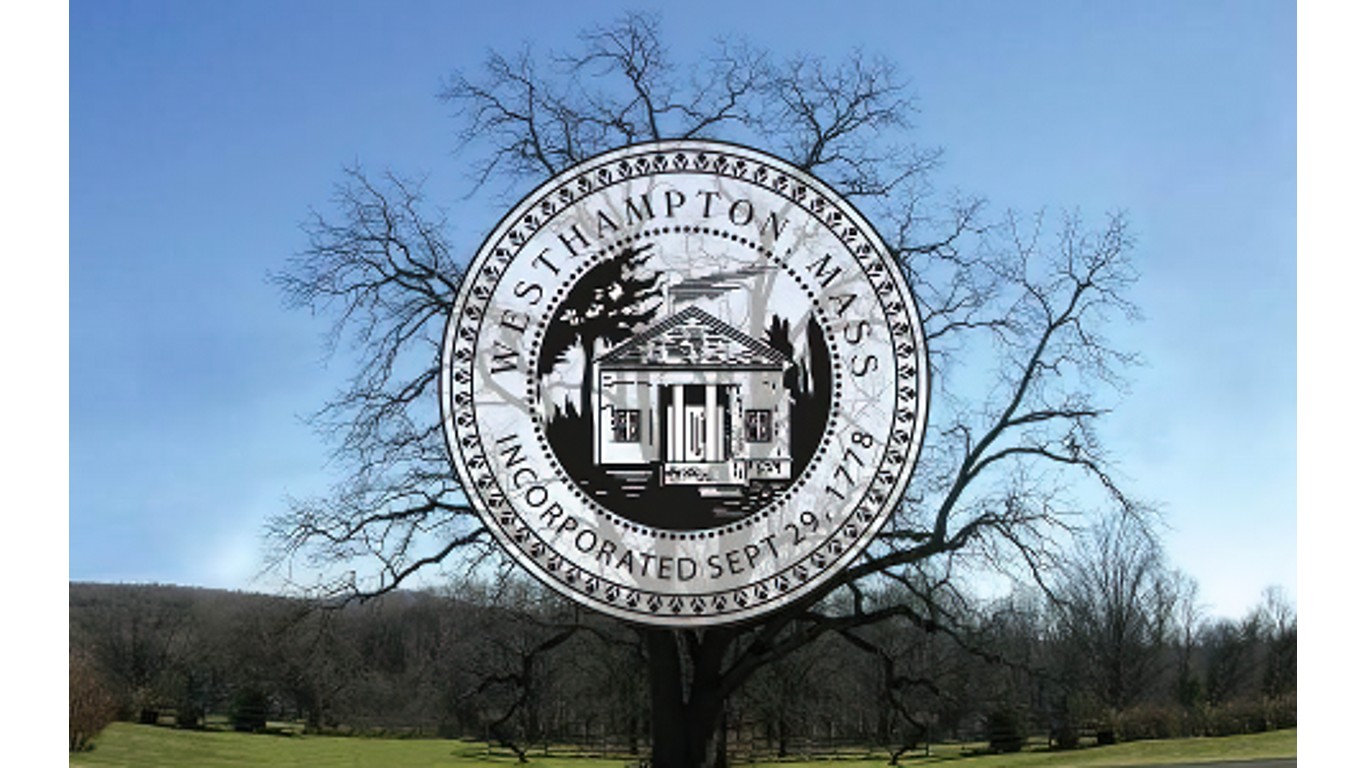
A city’s flag is a visual representation that aims to capture the municipality’s distinct characteristics and give its residents a sense of unity. Poorly designed flags fail to highlight any of a place’s unique attributes.
Vexillology is the study of flags, and the individuals who create flags are known as vexillographers. They strive to create flags with simple but memorable images while avoiding overcomplicated or generic designs.
Ted Kaye, secretary of North American Vexillological Association and author of a book on vexillology, says the five basic principles of flag design are simplicity, meaningful symbolism, few colors, no lettering or seals, and distinctiveness. The best flags are striking designs that convey a sense of place and beauty. Many draw from the natural environment, depicting local animals, plants, landforms, or attractions. (These are the most visited national parks in the US)
Bad flags have lettering, bland designs, and minimal meaningful symbolism. Several echo generic product labeling and do nothing to capture local personality. Others are over-designed and have extensive intricate patterns and images that would be nearly impossible to make sense of from more than a short distance.
Every year, among other activities, the NAVA rates city flags from around the U.S. To compile a list of the worst-designed examples, 24/7 Tempo reviewed the organization’s recently published 2022 ranking of city flags. NAVA asked its members and the public to rate the designs of 312 flags, all of which have been redesigned since NAVA did its last survey in 2004. Some 308 NAVA members and 2,544 public participants took part in the online survey between Sept. 1 and Nov. 30.
Click here to see the worst city flags in America
Flag designs were rated using a low-to-high scale of 0-10. The numerical ratings for each flag were averaged and the average rating was converted to a letter grade, ranging from F to A+. Only 46 flags were graded A, while 143 received an F. Our list includes the very worst city flags – those with a score of 1.50 or lower. (The states have generally done a better job. Here’s a guide to every state’s flag and what it represents.)
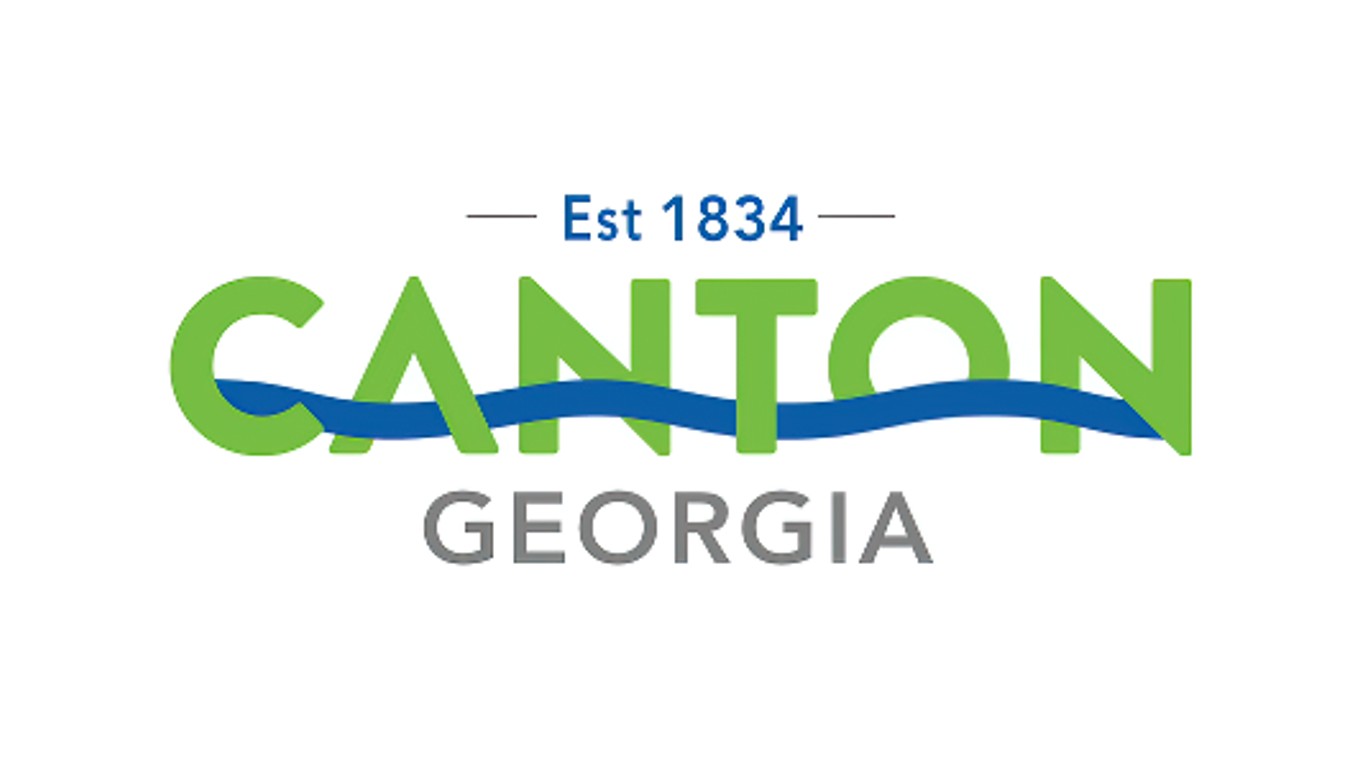
43. Canton, Georgia
> Avg score: 1.50/10
[in-text-ad]
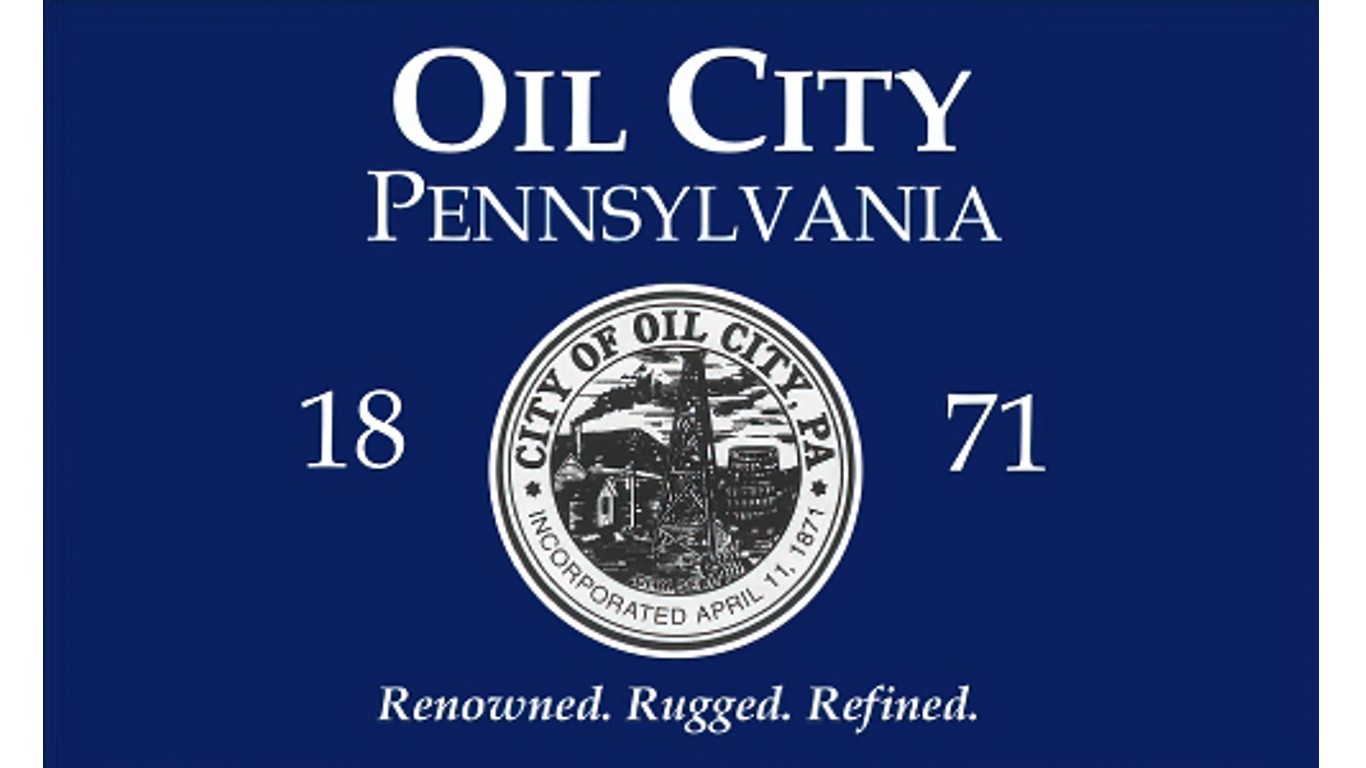
42. Oil City, Pennsylvania
> Avg score: 1.50/10
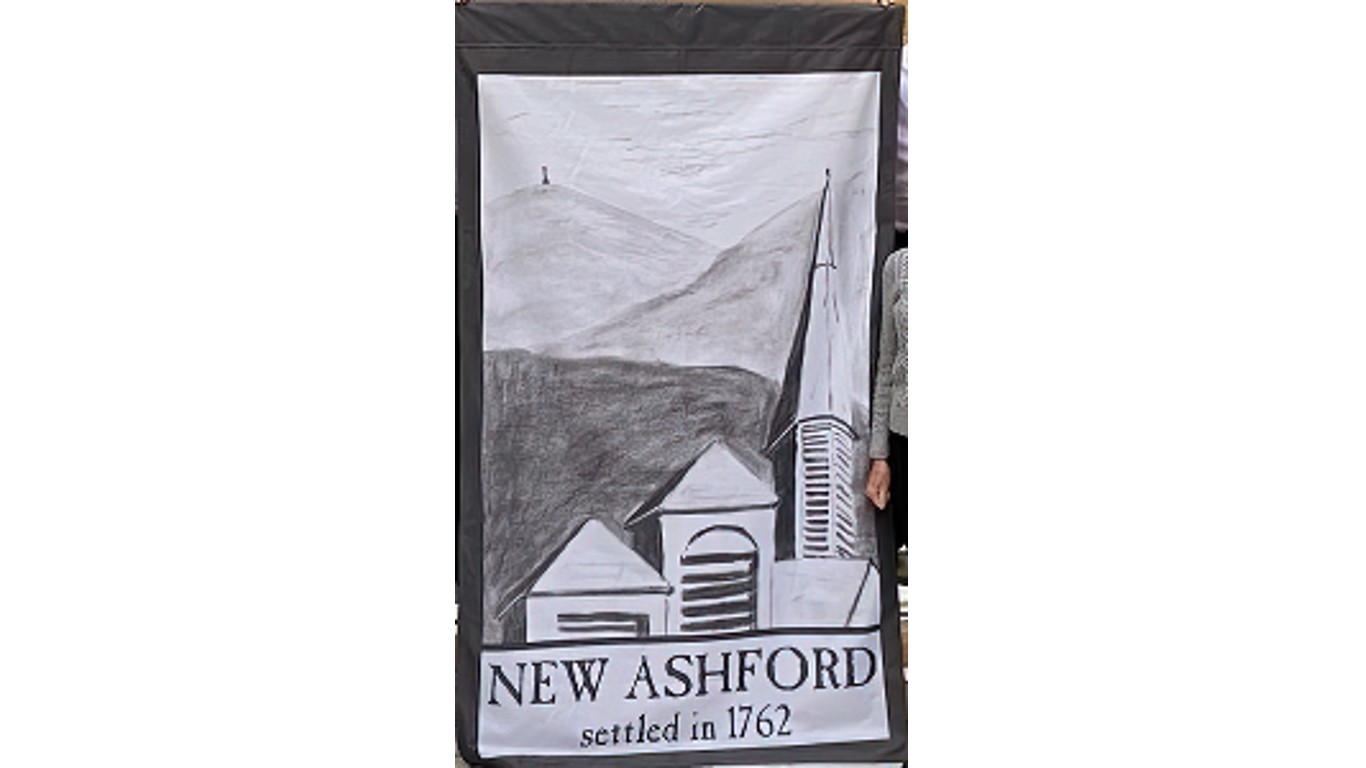
41. New Ashford, Massachusetts
> Avg score: 1.48/10
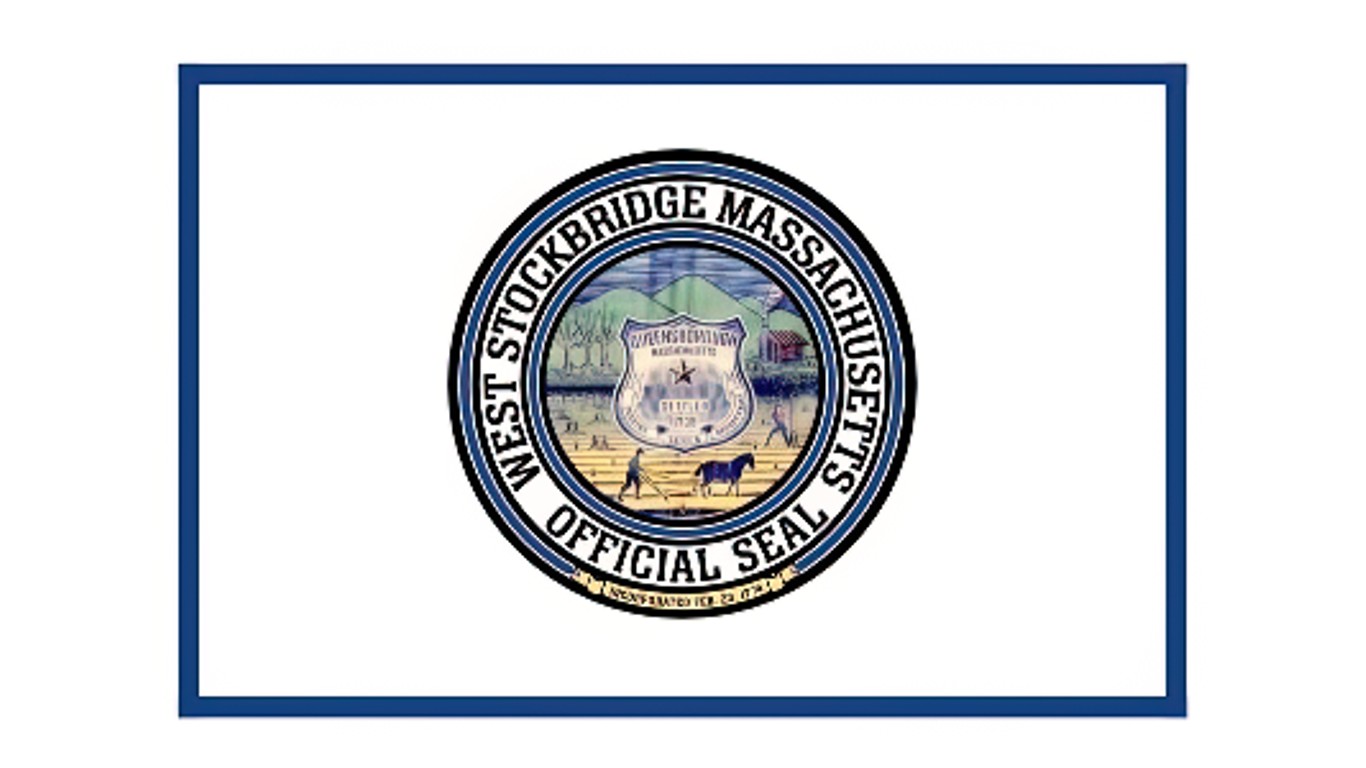
40. West Stockbridge, Massachusetts
> Avg score: 1.48/10
[in-text-ad-2]

39. Superior, Colorado
> Avg score: 1.48/10

38. West Hartford, Connecticut
> Avg score: 1.47/10
[in-text-ad]
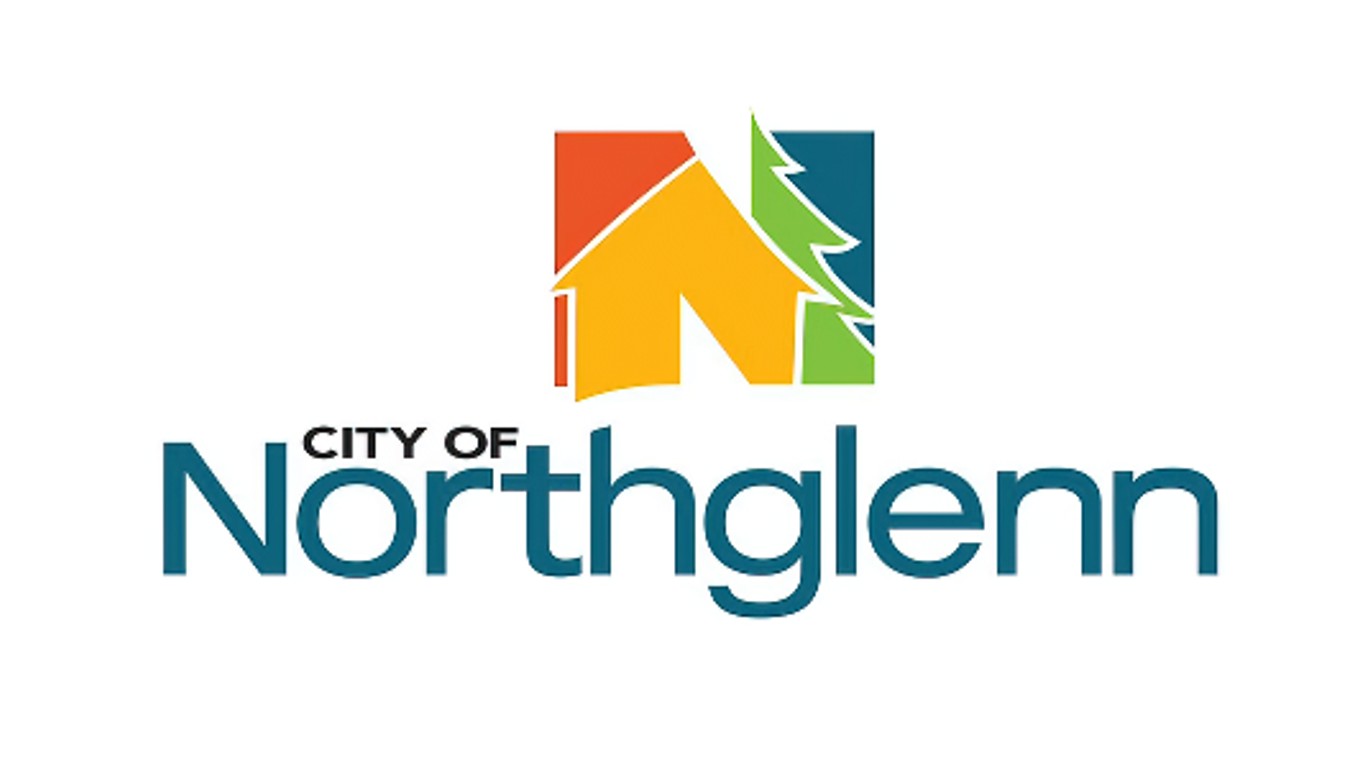
37. Northglenn, Colorado
> Avg score: 1.47/10
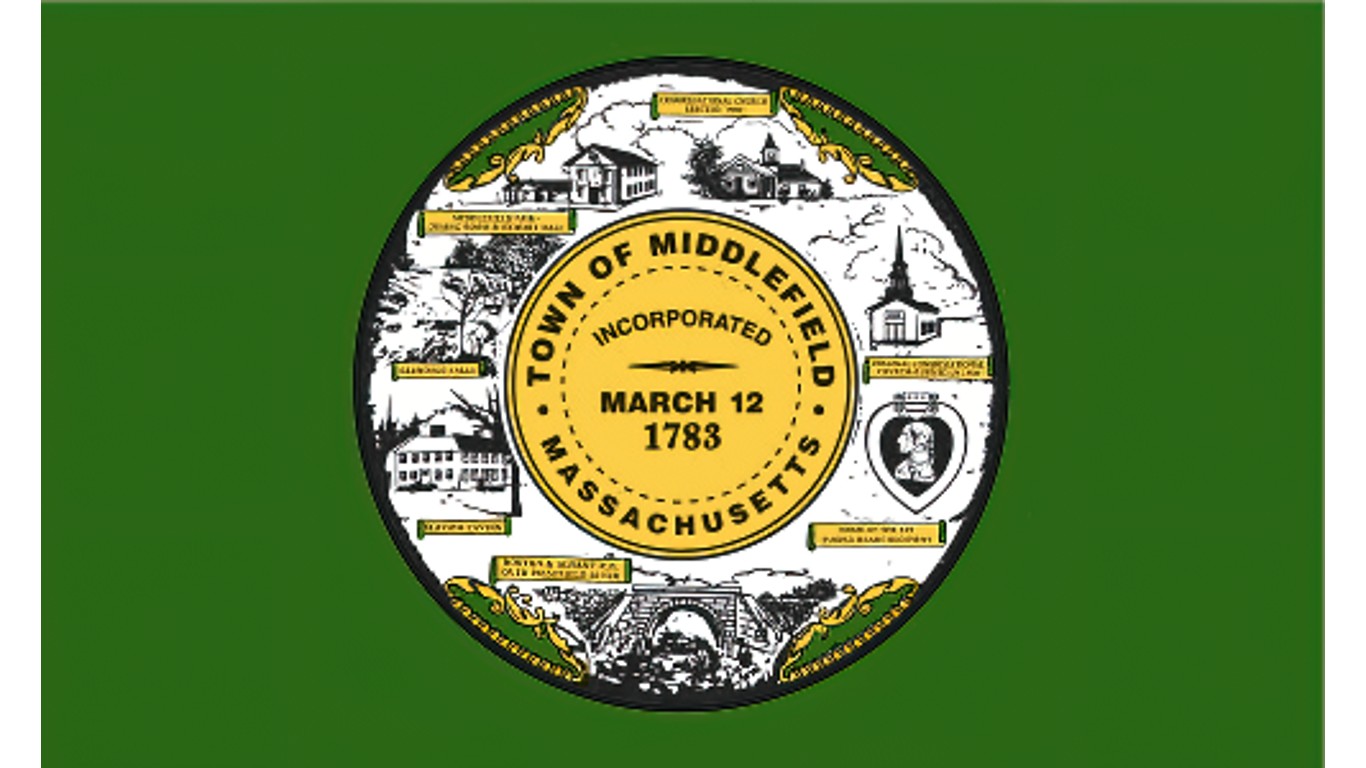
36. Middlefield, Massachusetts
> Avg score: 1.45/10
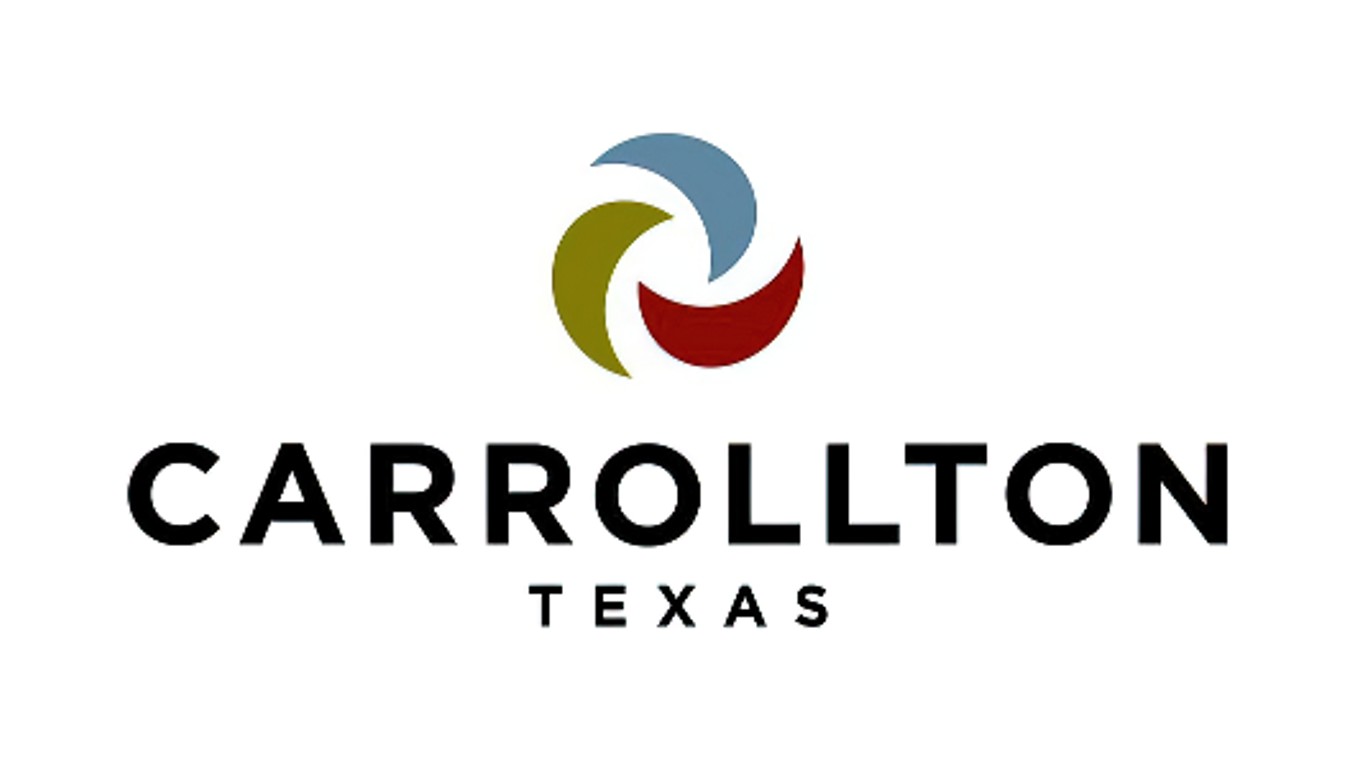
35. Carrollton, Texas
> Avg score: 1.45/10
[in-text-ad-2]
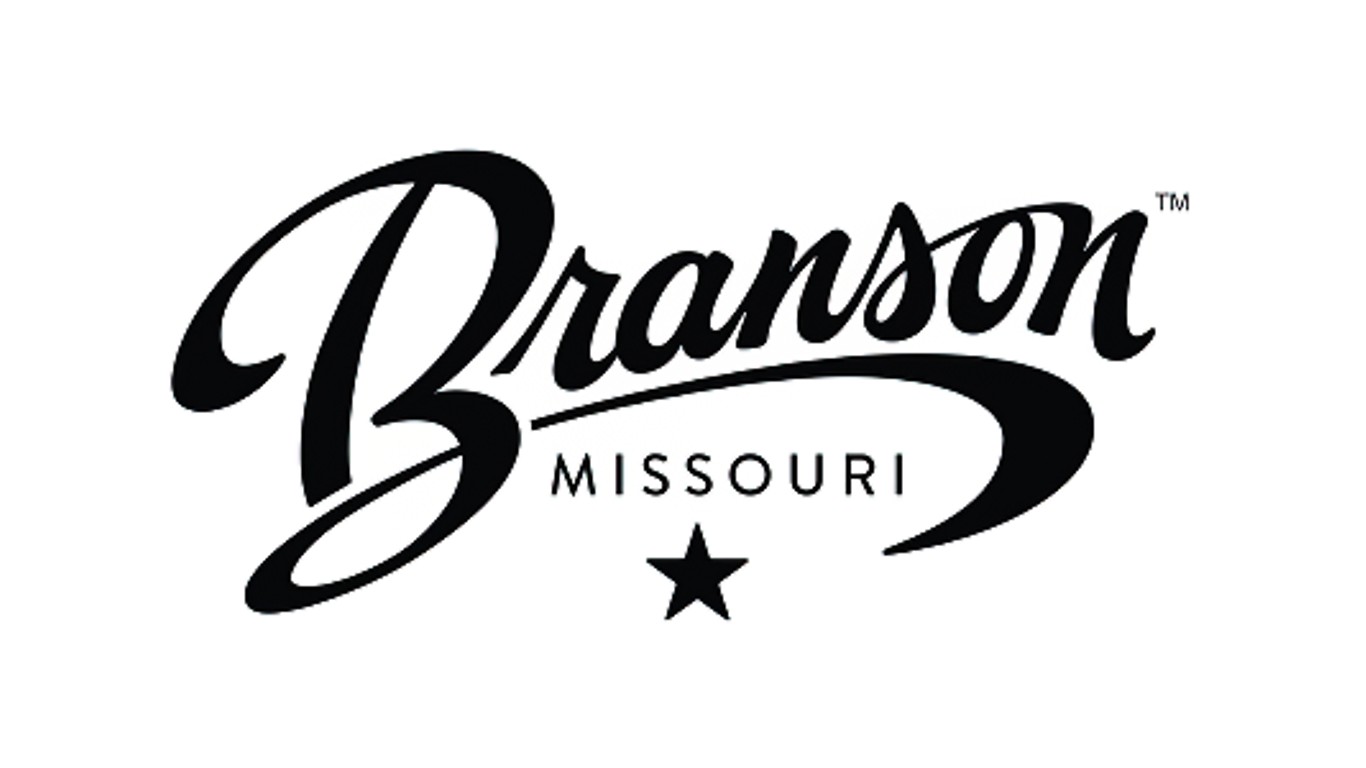
34. Branson, Missouri
> Avg score: 1.41/10
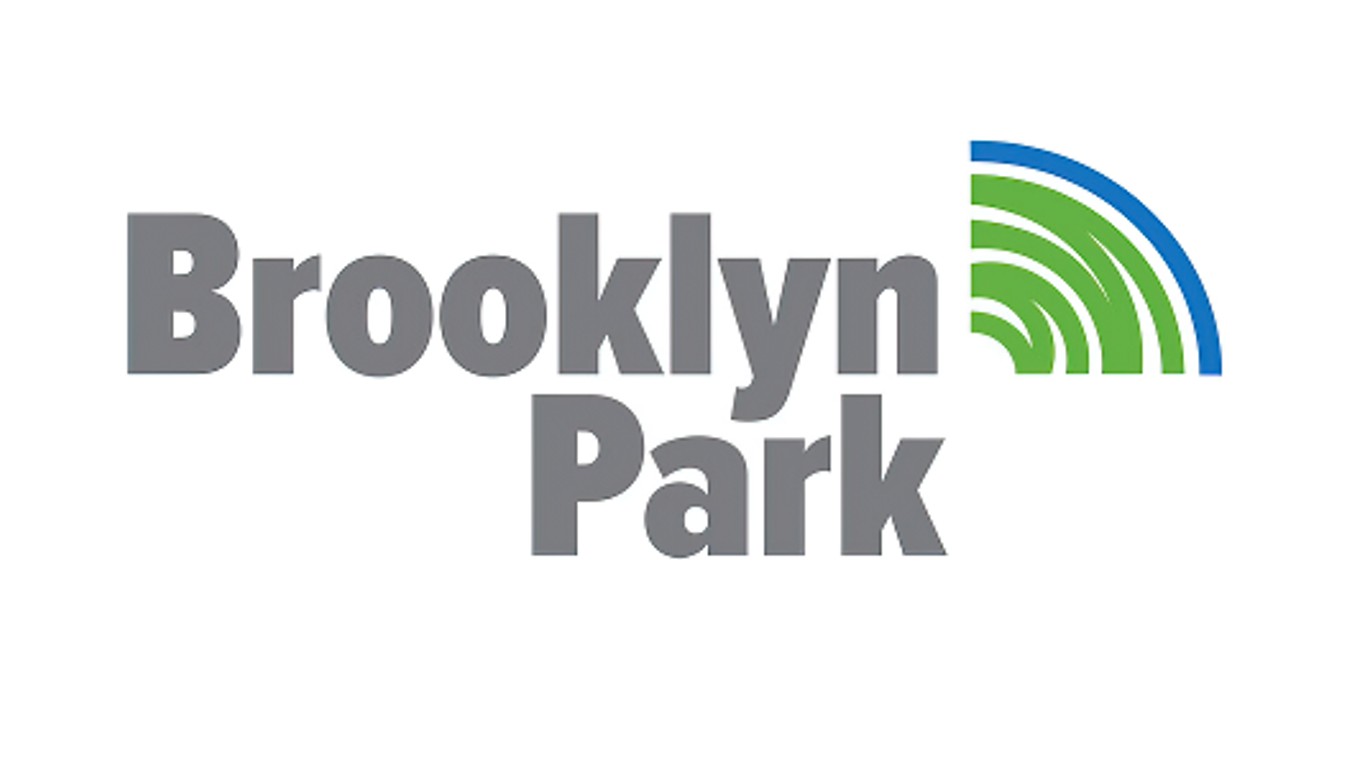
33. Brooklyn Park, Minnesota
> Avg score: 1.40/10
[in-text-ad]
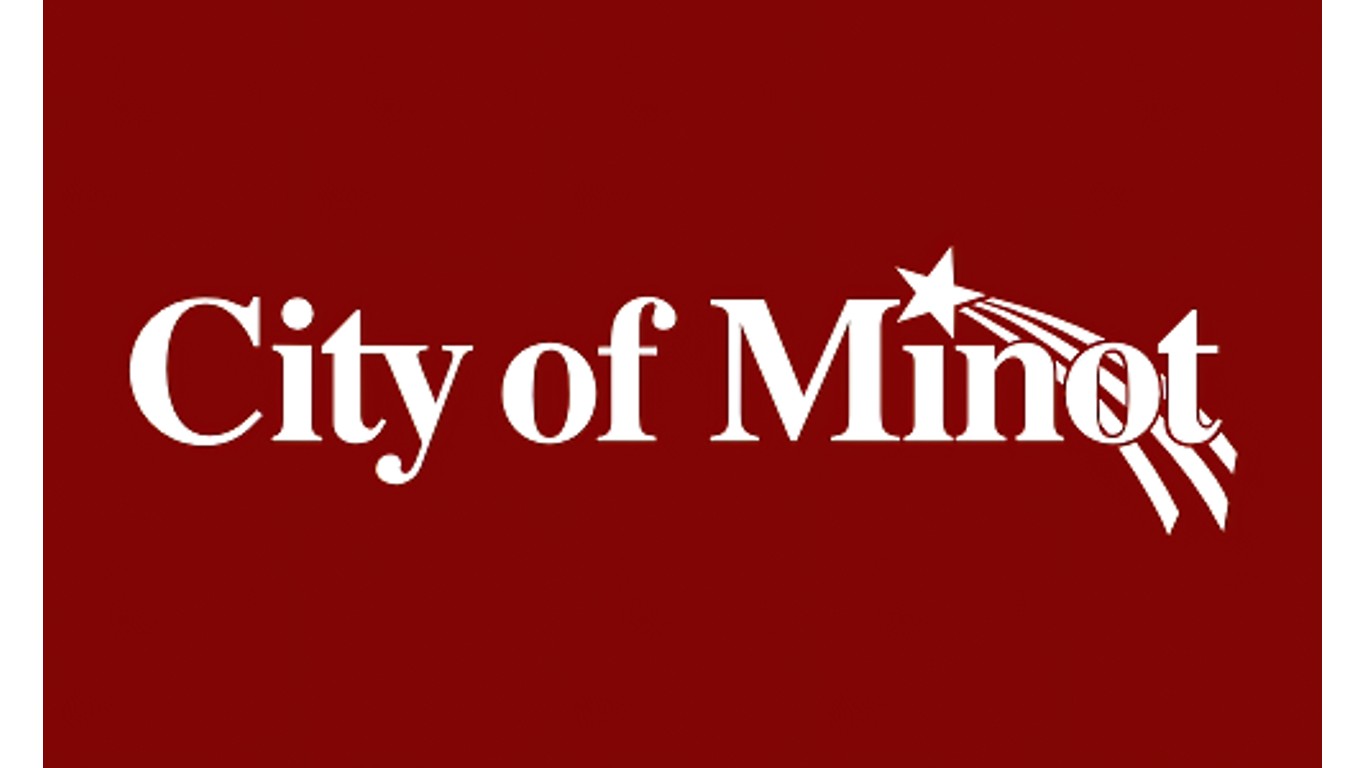
32. Minot, North Dakota
> Avg score: 1.39/10
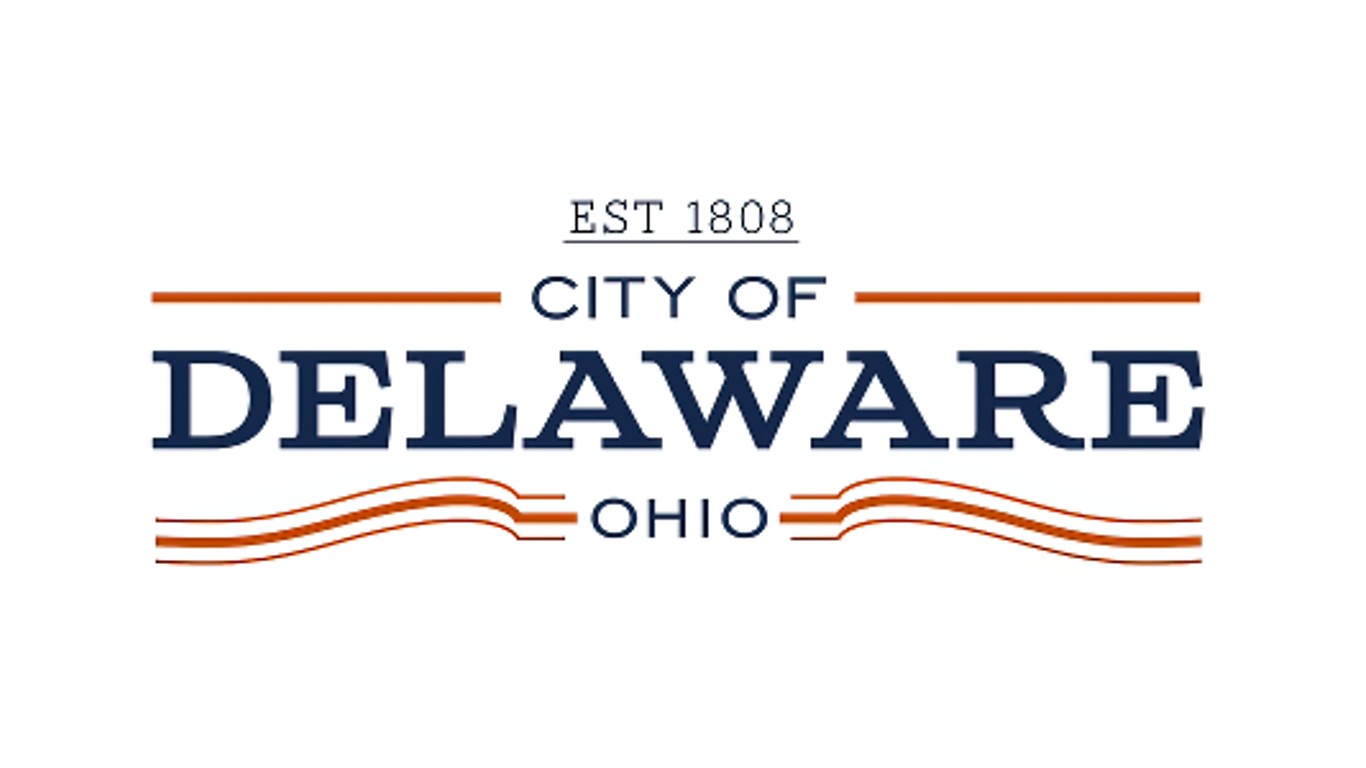
31. Delaware, Idaho
> Avg score: 1.38/10
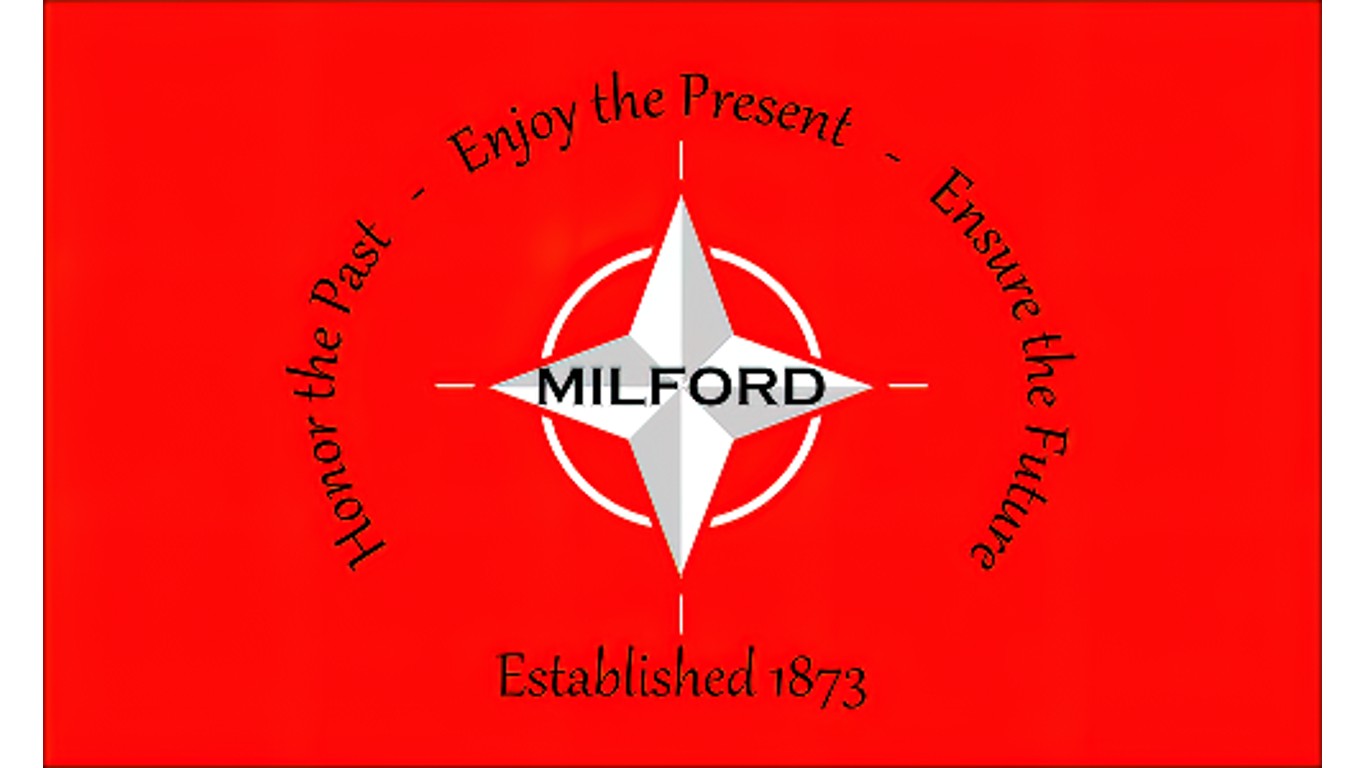
30. Milford, Utah
> Avg score: 1.38/10
[in-text-ad-2]

29. Weatherford, Oklahoma
> Avg score: 1.36/10
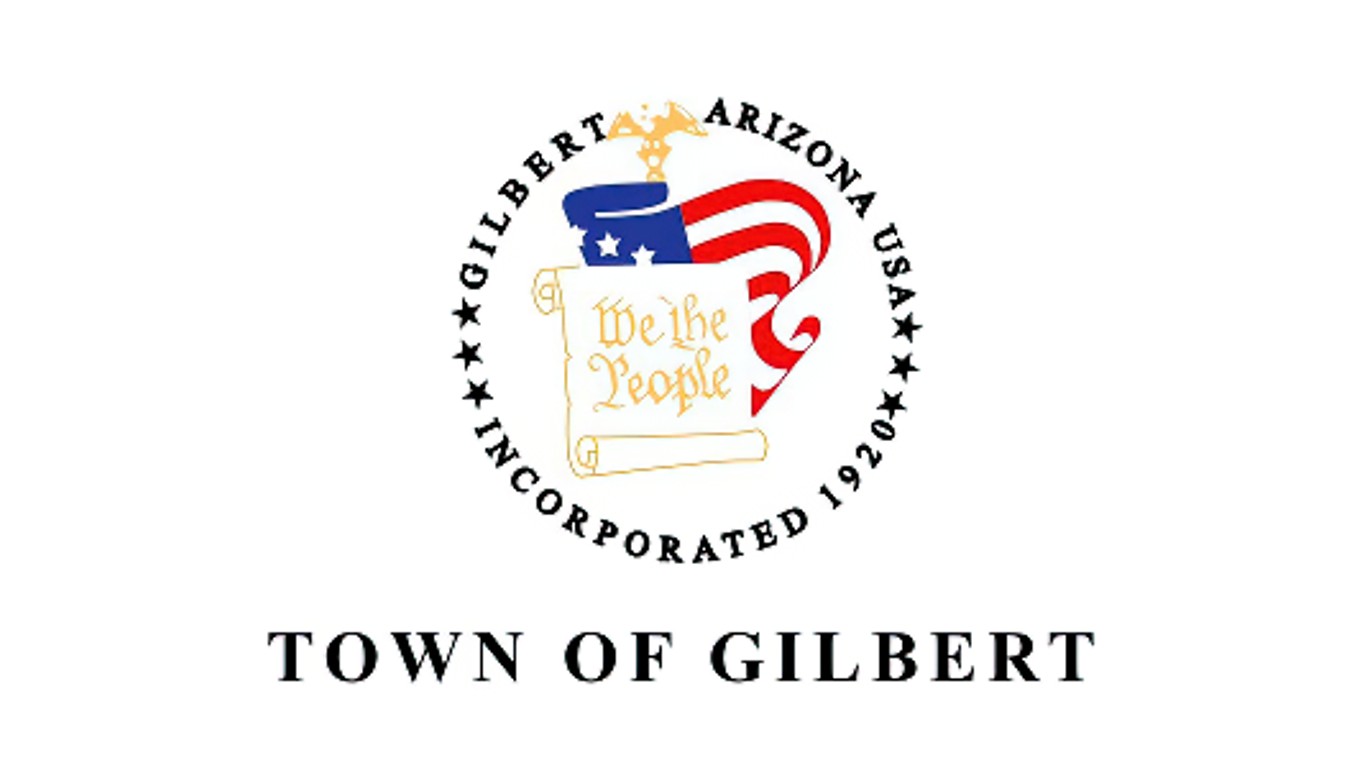
28. Gilbert, Arizona
> Avg score: 1.35/10
[in-text-ad]

27. Watson Township, Michigan
> Avg score: 1.34/10
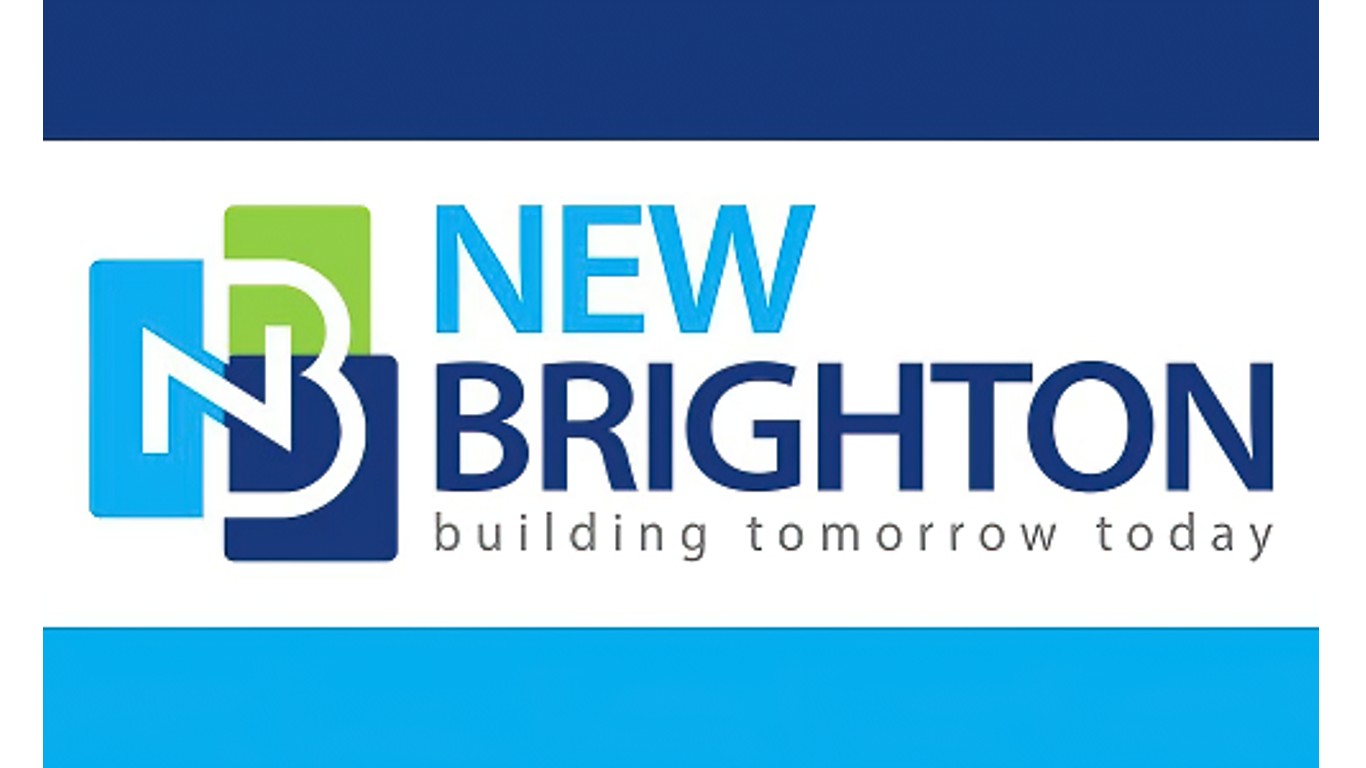
26. New Brighton, Minnesota
> Avg score: 1.34/10
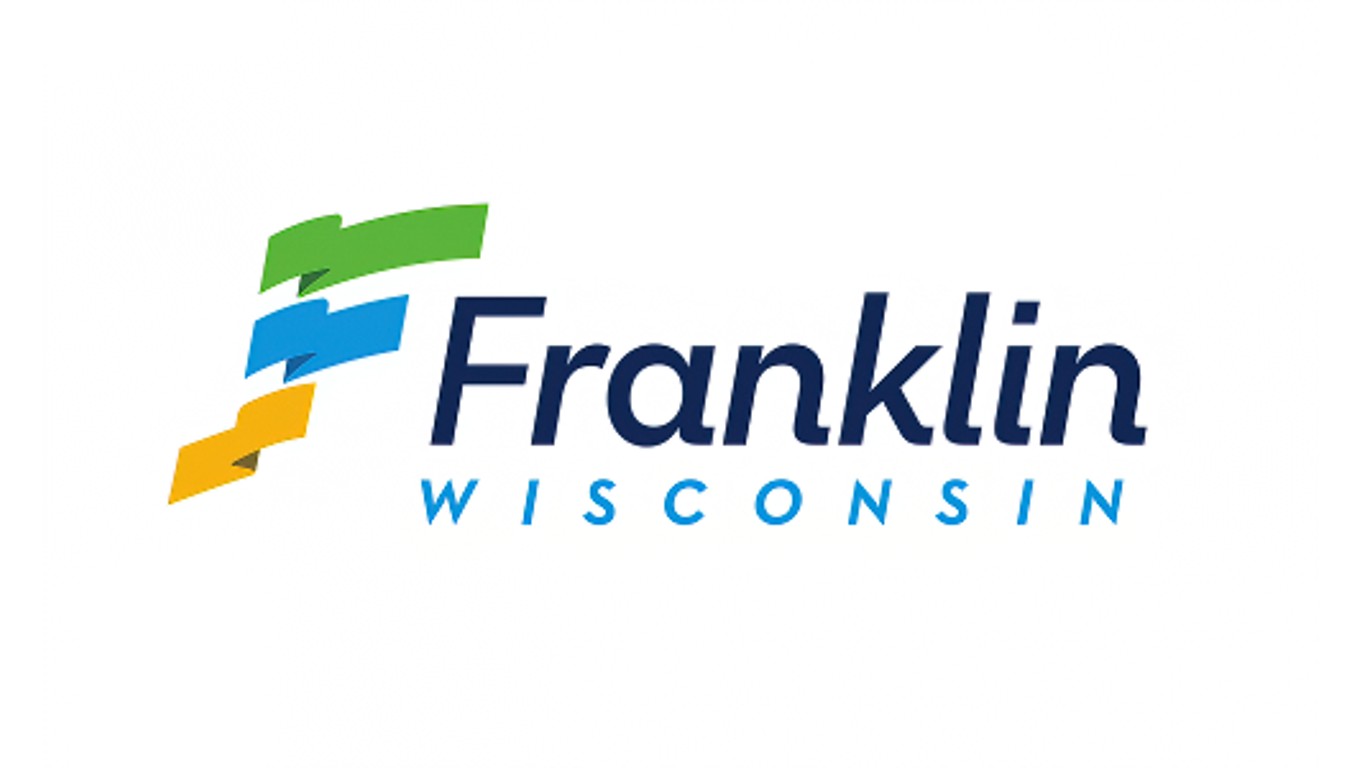
25. Franklin, Wisconsin
> Avg score: 1.34/10
[in-text-ad-2]
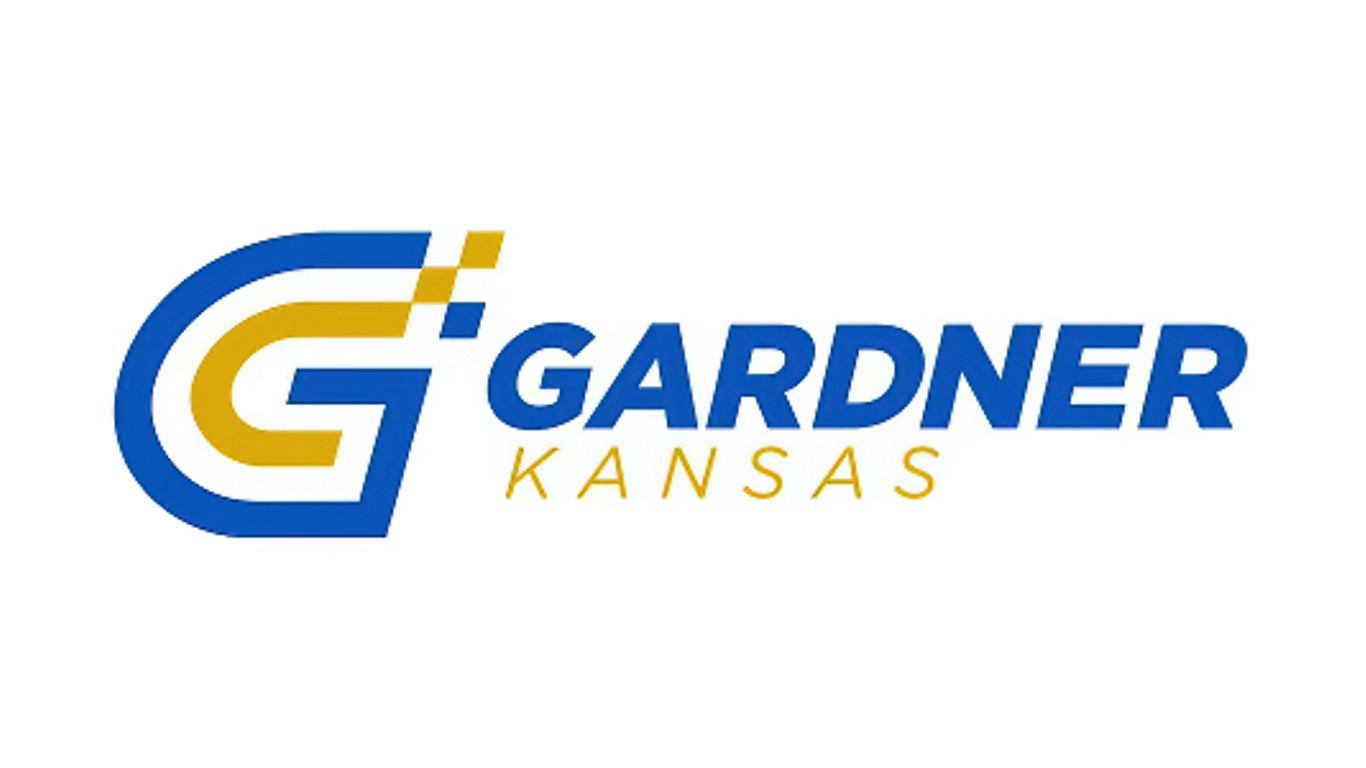
24. Gardner, Kansas
> Avg score: 1.33/10
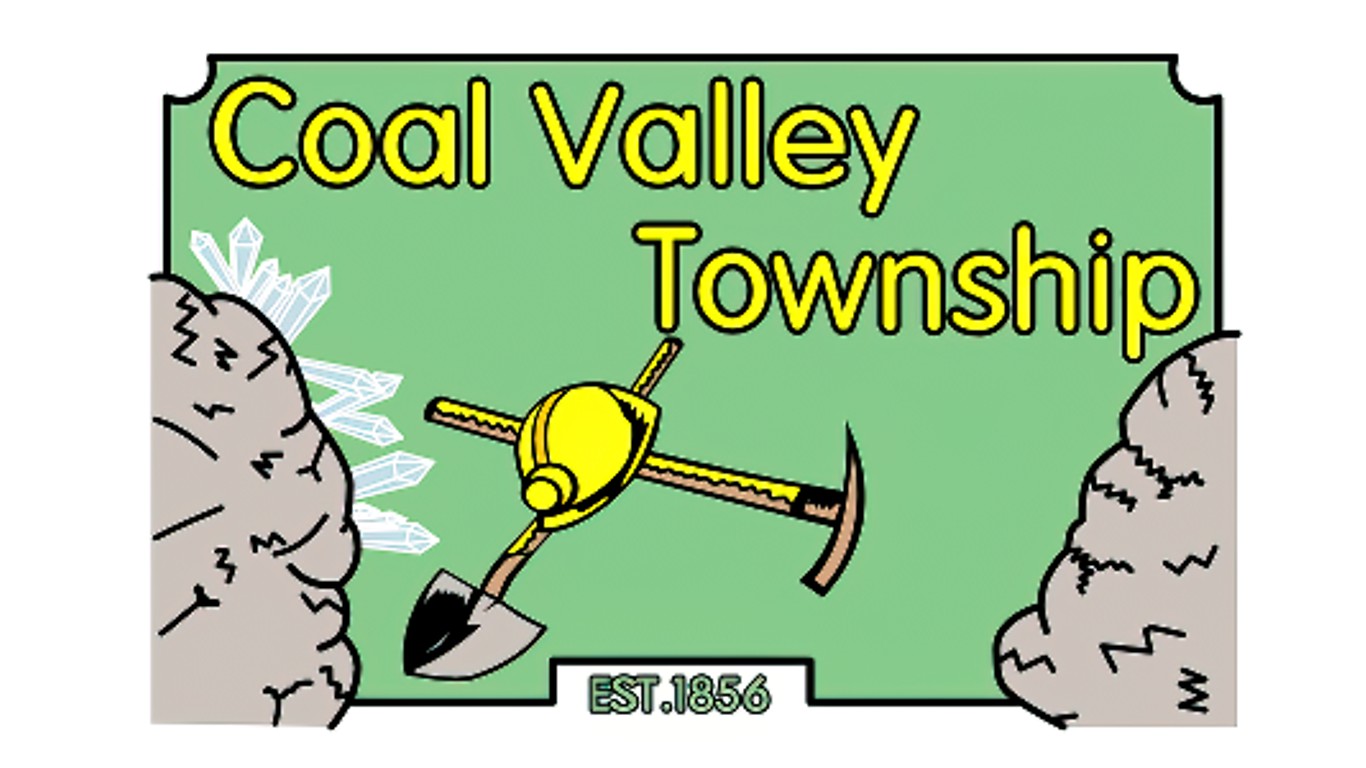
23. Coal Valley, Illinois
> Avg score: 1.30/10
[in-text-ad]

22. Westfield, Massachusetts
> Avg score: 1.28/10
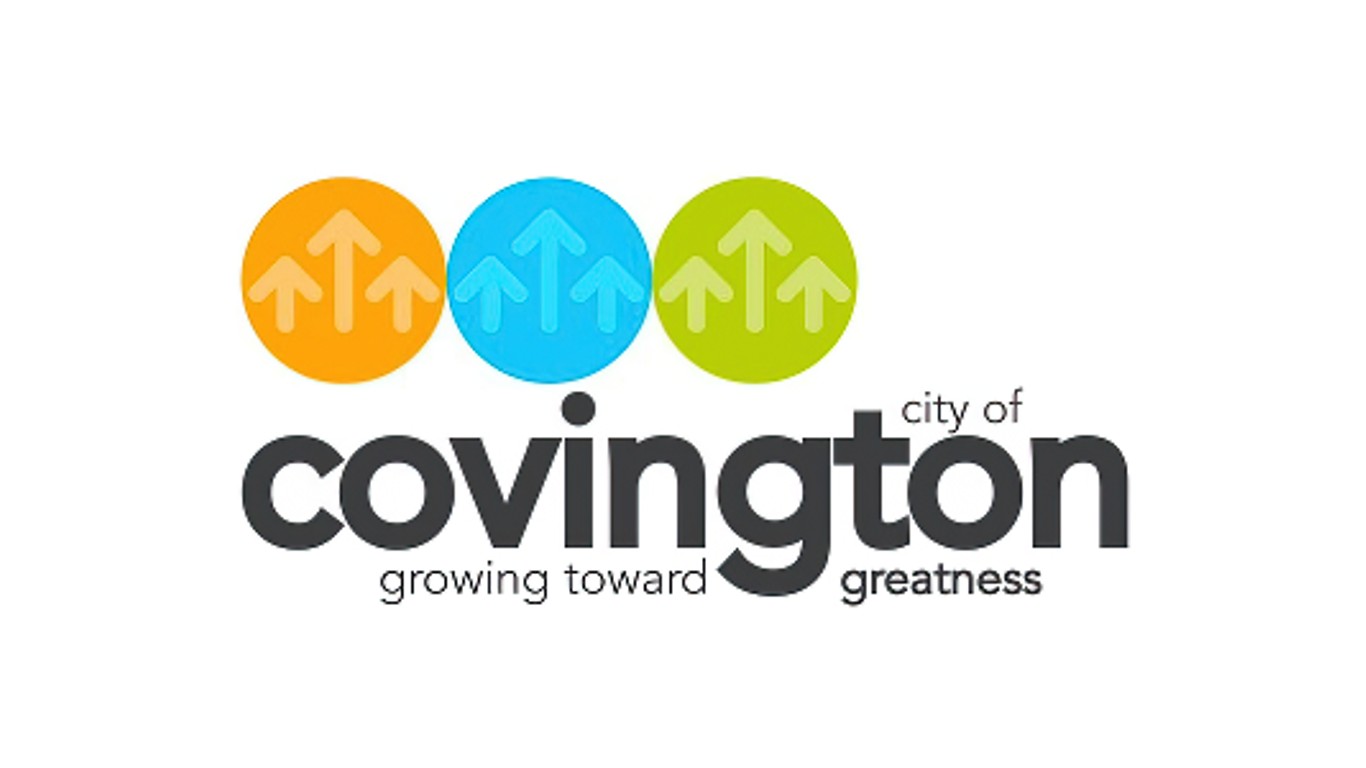
21. Covington, Washington
> Avg score: 1.27/10
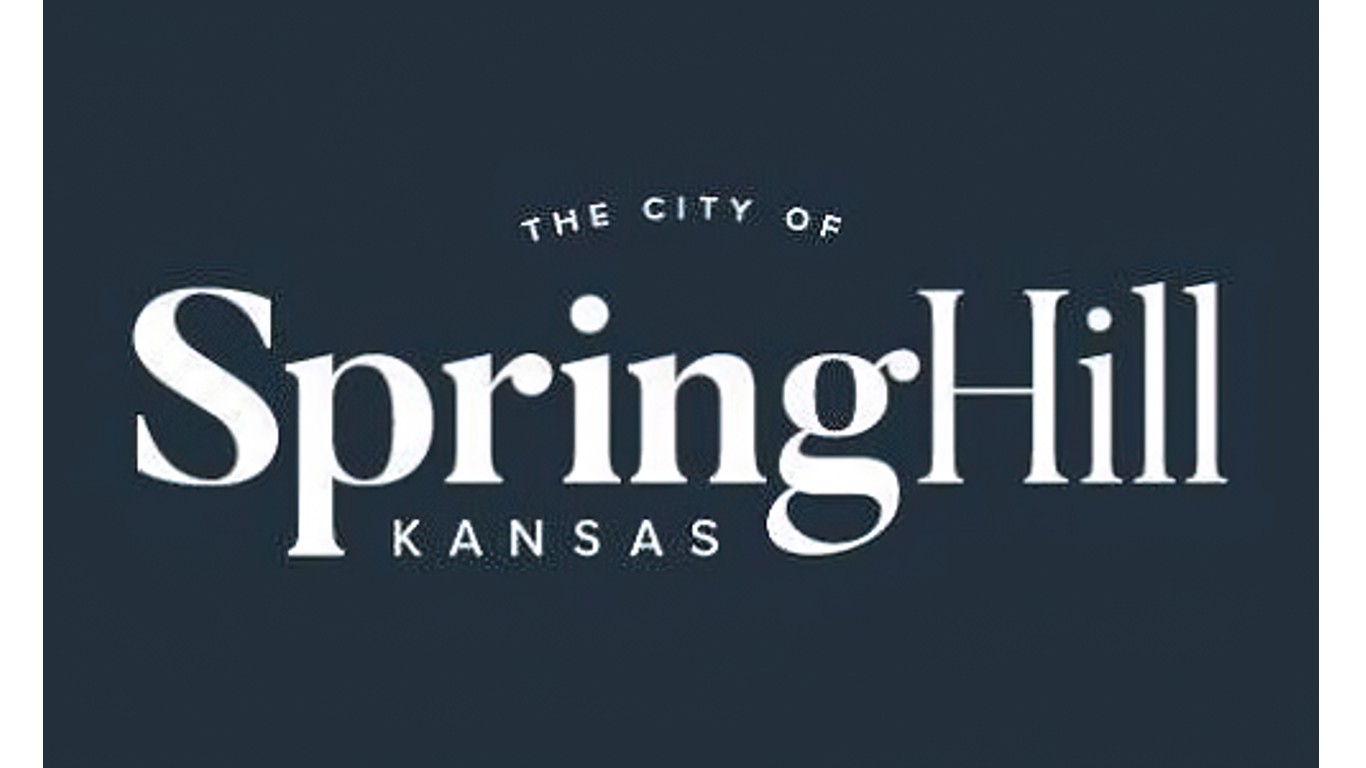
20. Spring Hill, Kansas
> Avg score: 1.27/10
[in-text-ad-2]

19. Republic, Missouri
> Avg score: 1.26/10
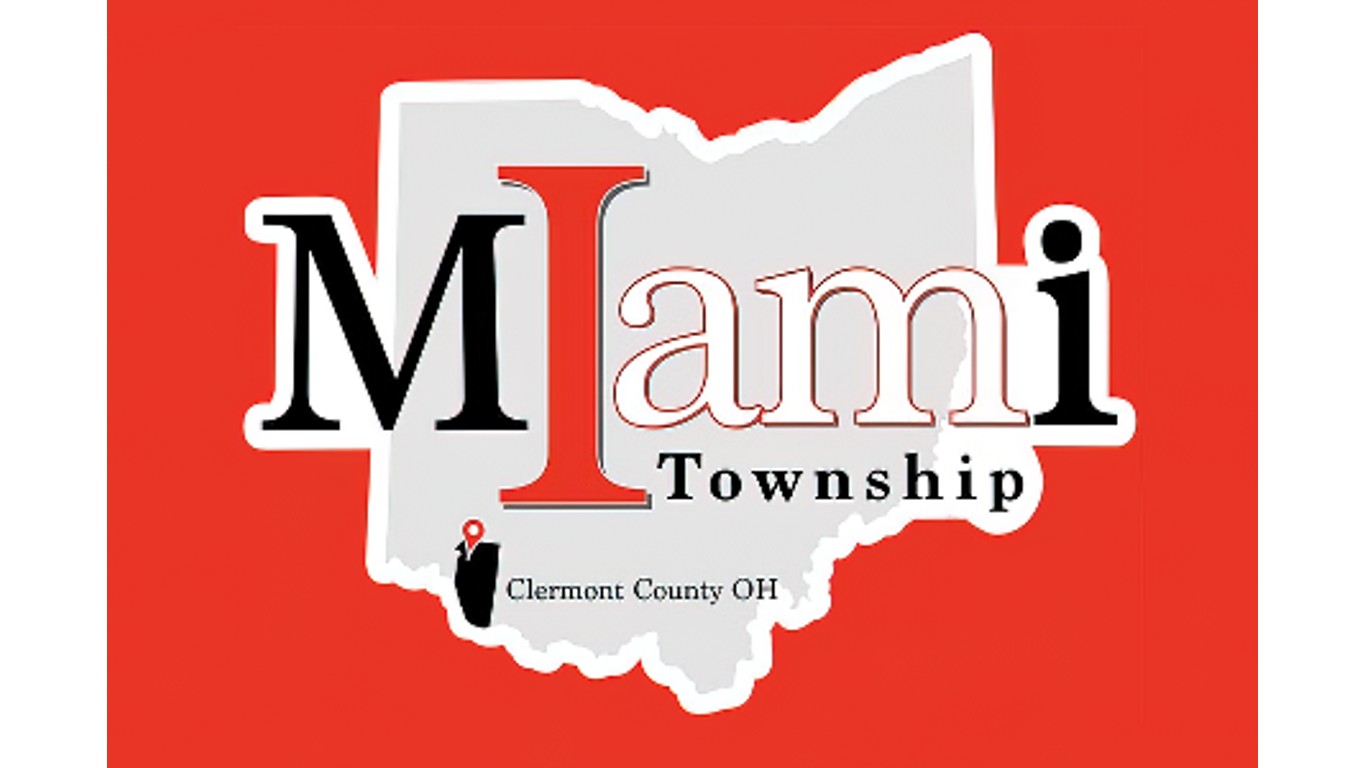
18. Miami Township, Clermont County, Ohio
> Avg score: 1.22/10
[in-text-ad]
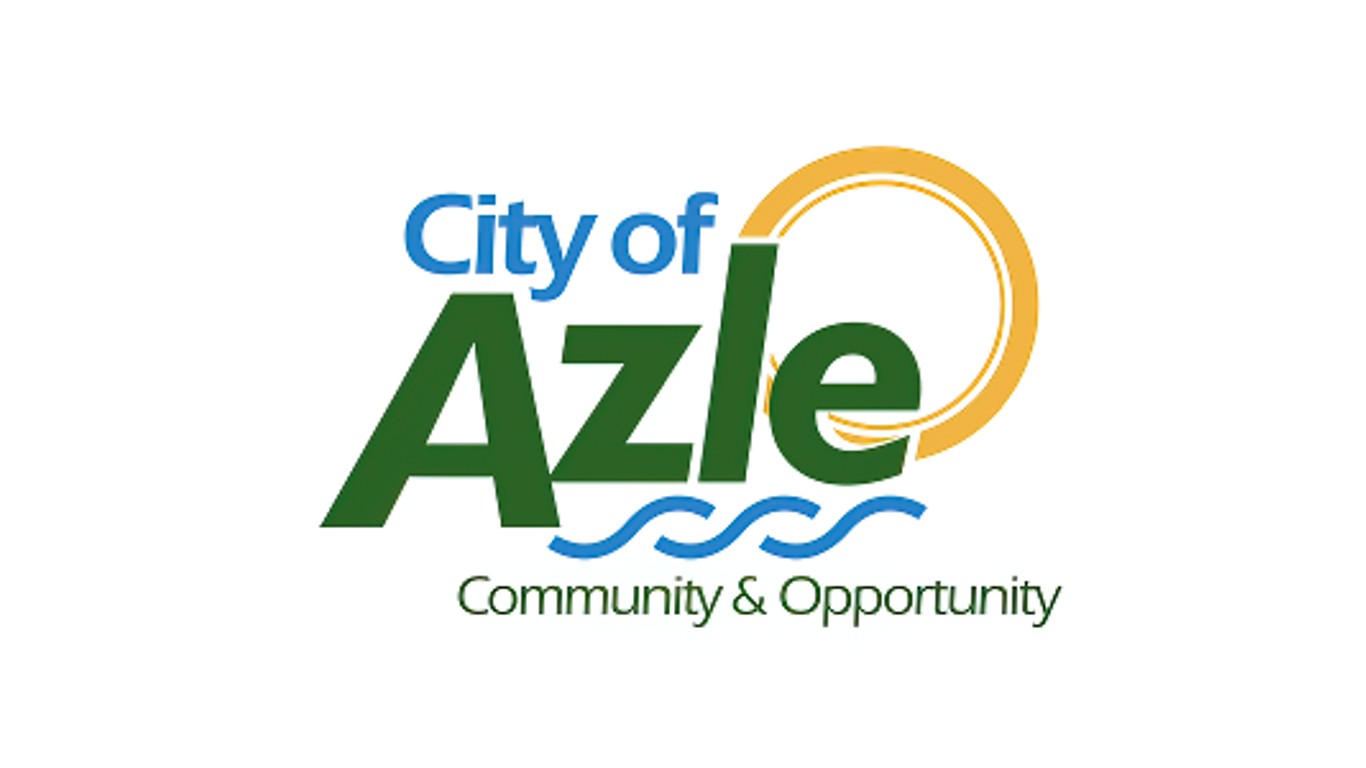
17. Azle, Texas
> Avg score: 1.22/10
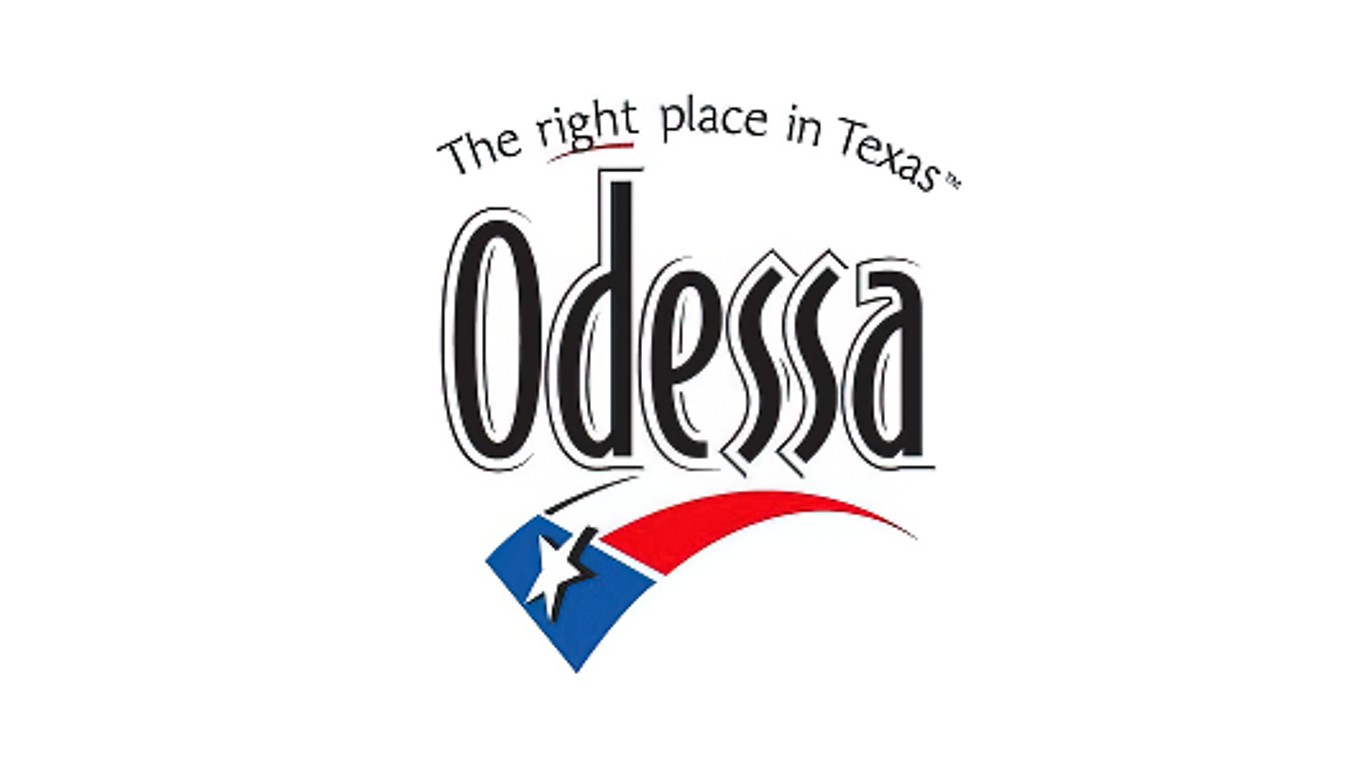
16. Odessa, Texas
> Avg score: 1.21/10
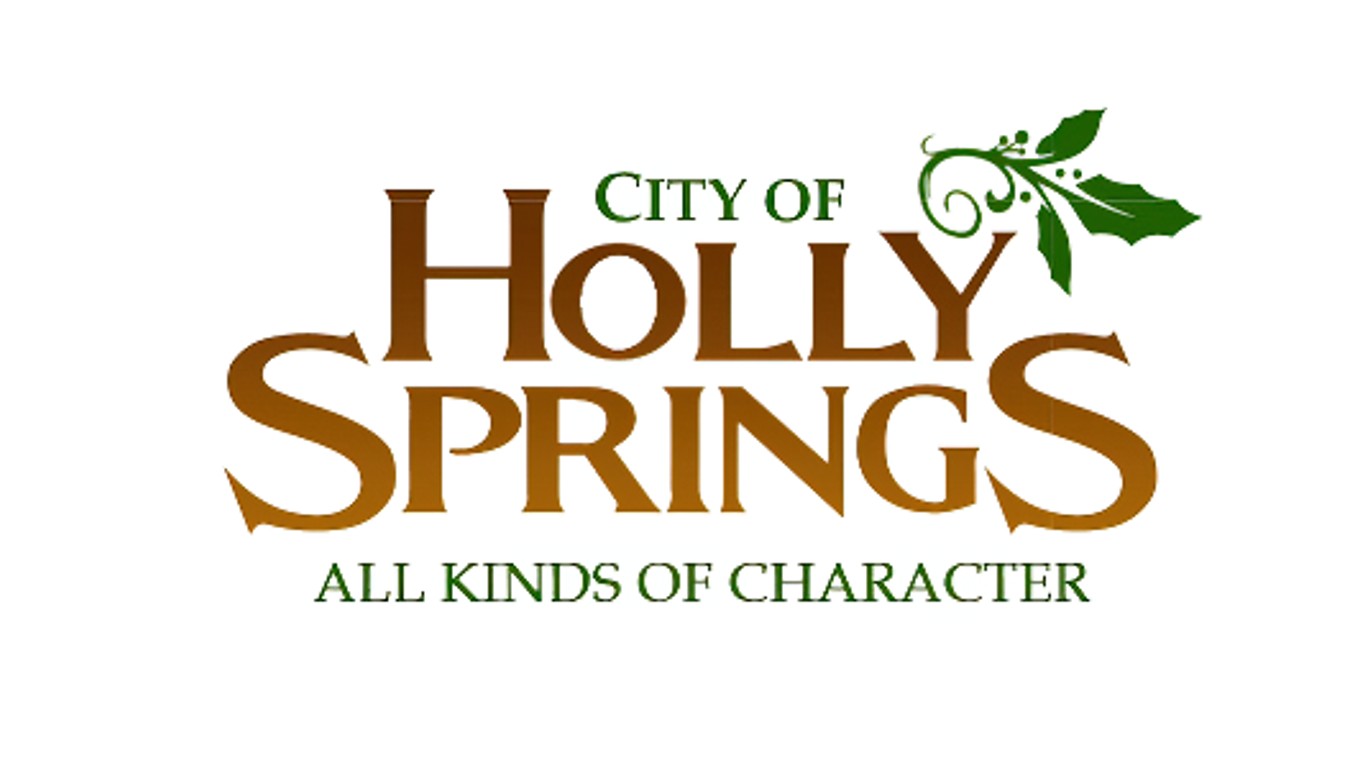
15. Holly Springs, Mississippi
> Avg score: 1.20/10
[in-text-ad-2]
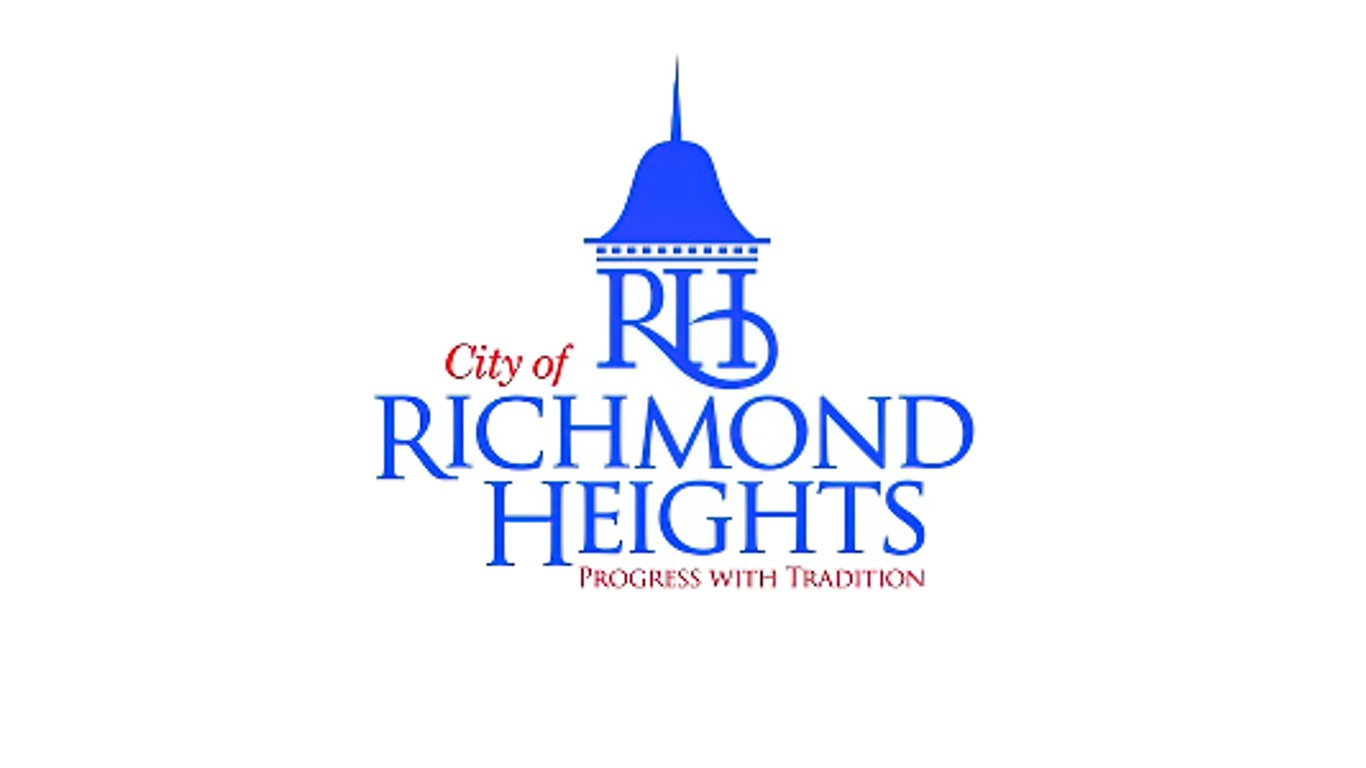
14. Richmond Heights, Missouri
> Avg score: 1.20/10
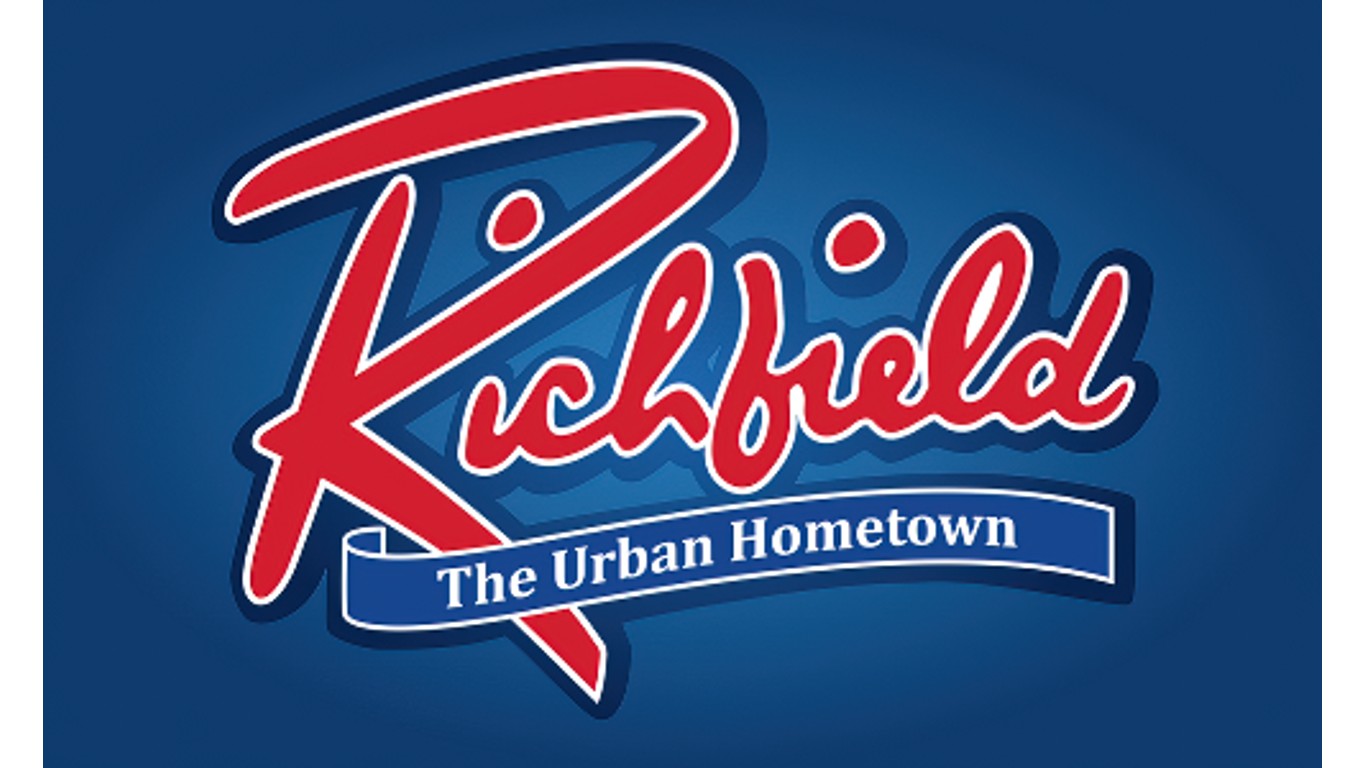
13. Richfield, Minnesota
> Avg score: 1.18/10
[in-text-ad]
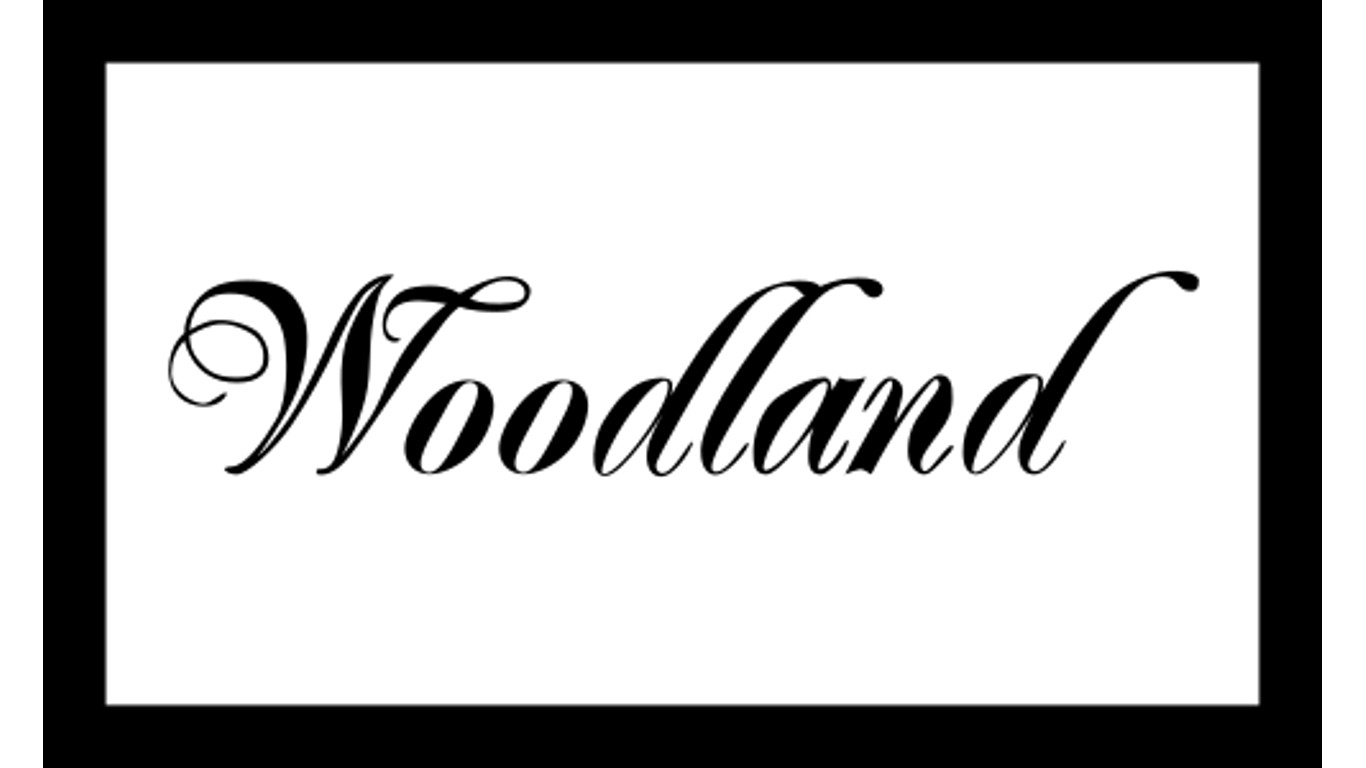
12. Woodland, Mississippi
> Avg score: 1.17/10
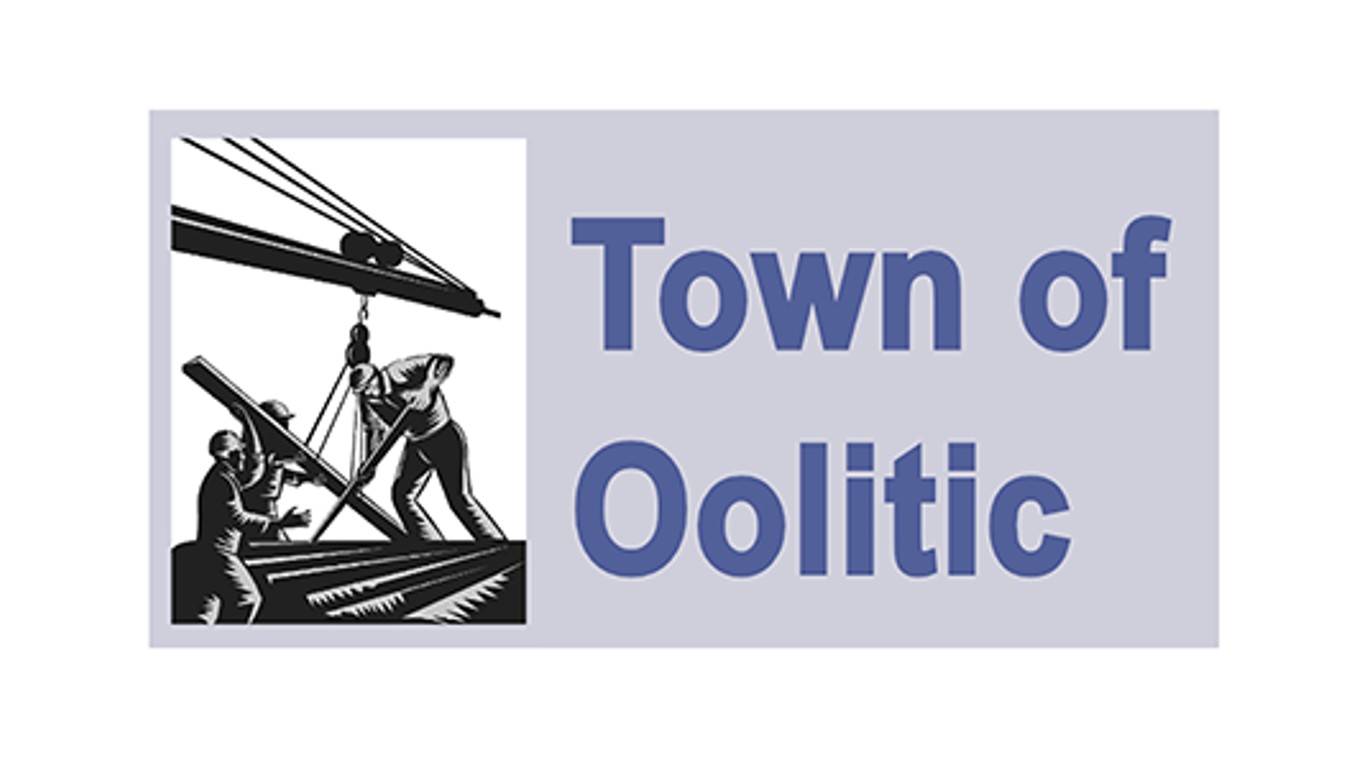
11. Oolitic, Indiana
> Avg score: 1.16/10
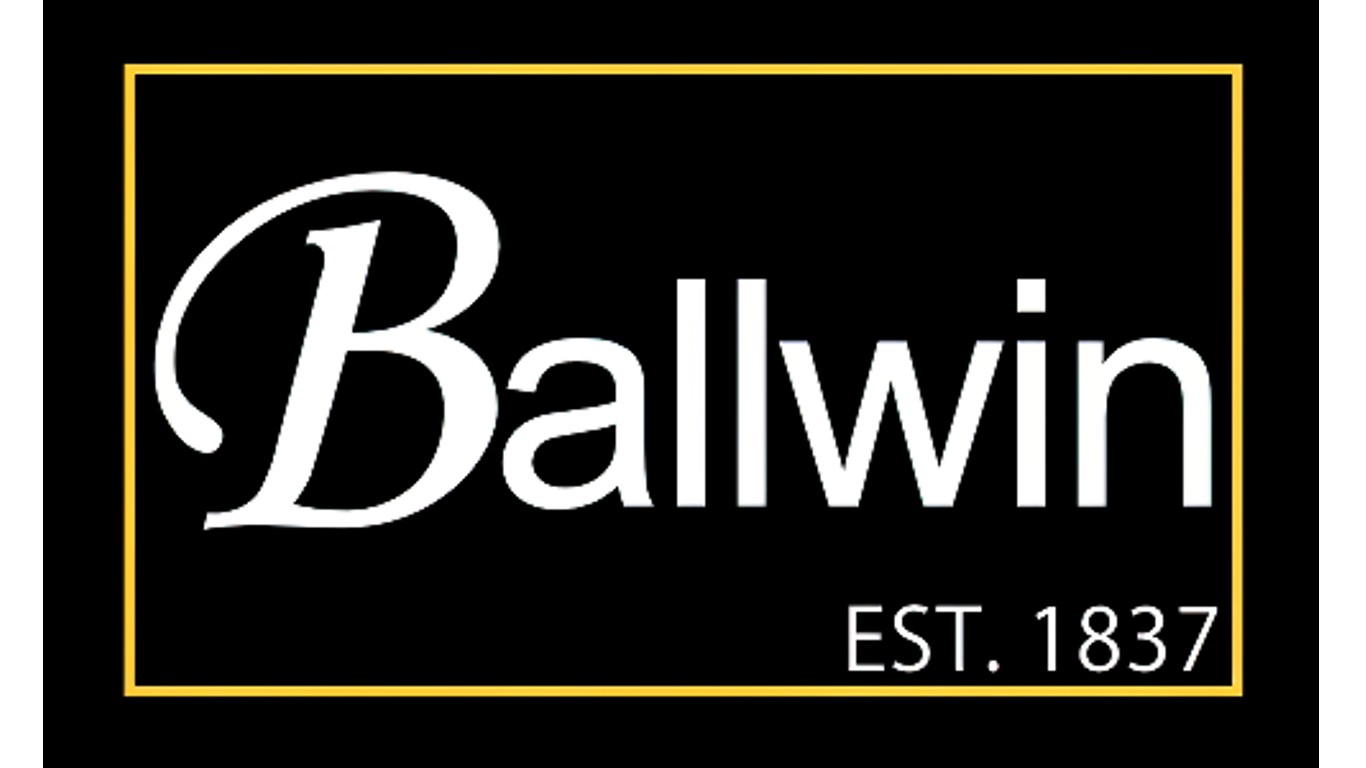
10. Ballwin, Missouri
> Avg score: 1.14/10
[in-text-ad-2]
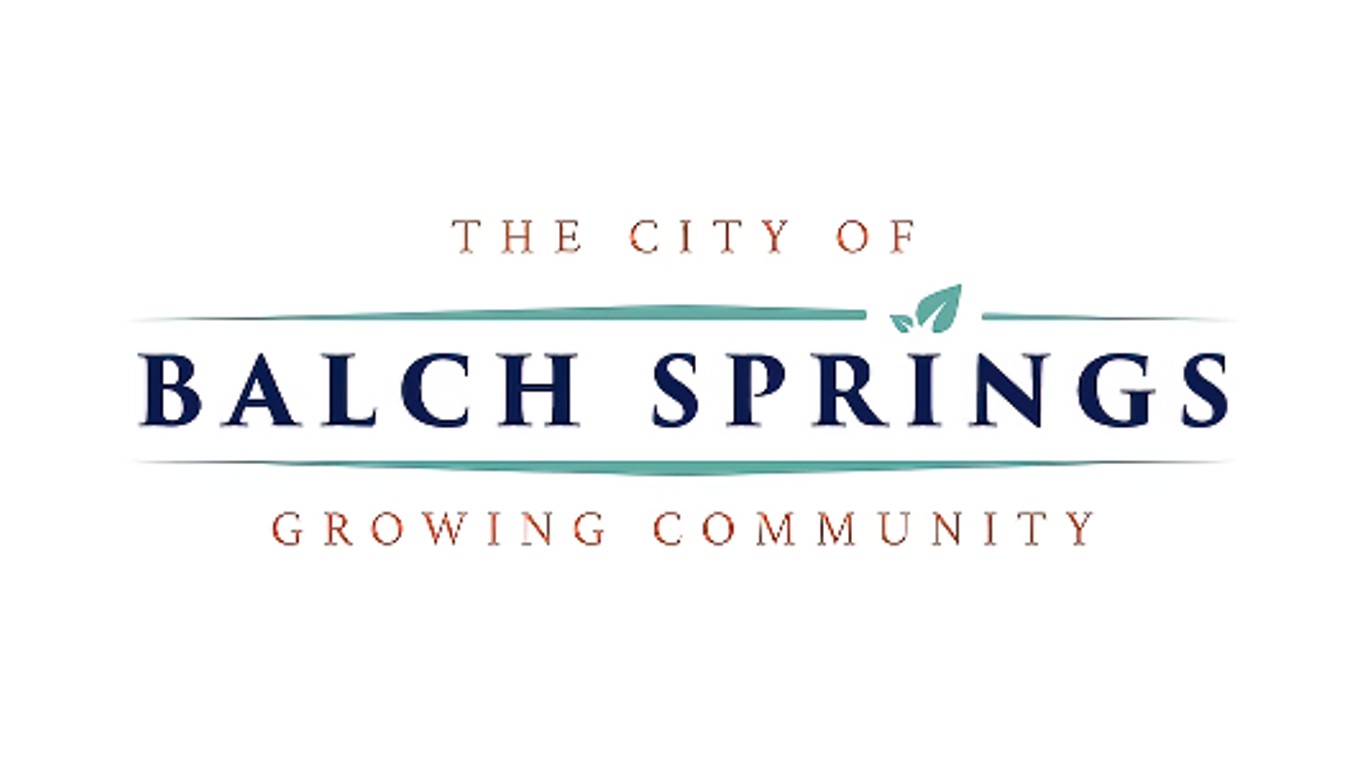
9. Balch Springs, Texas
> Avg score: 1.13/10
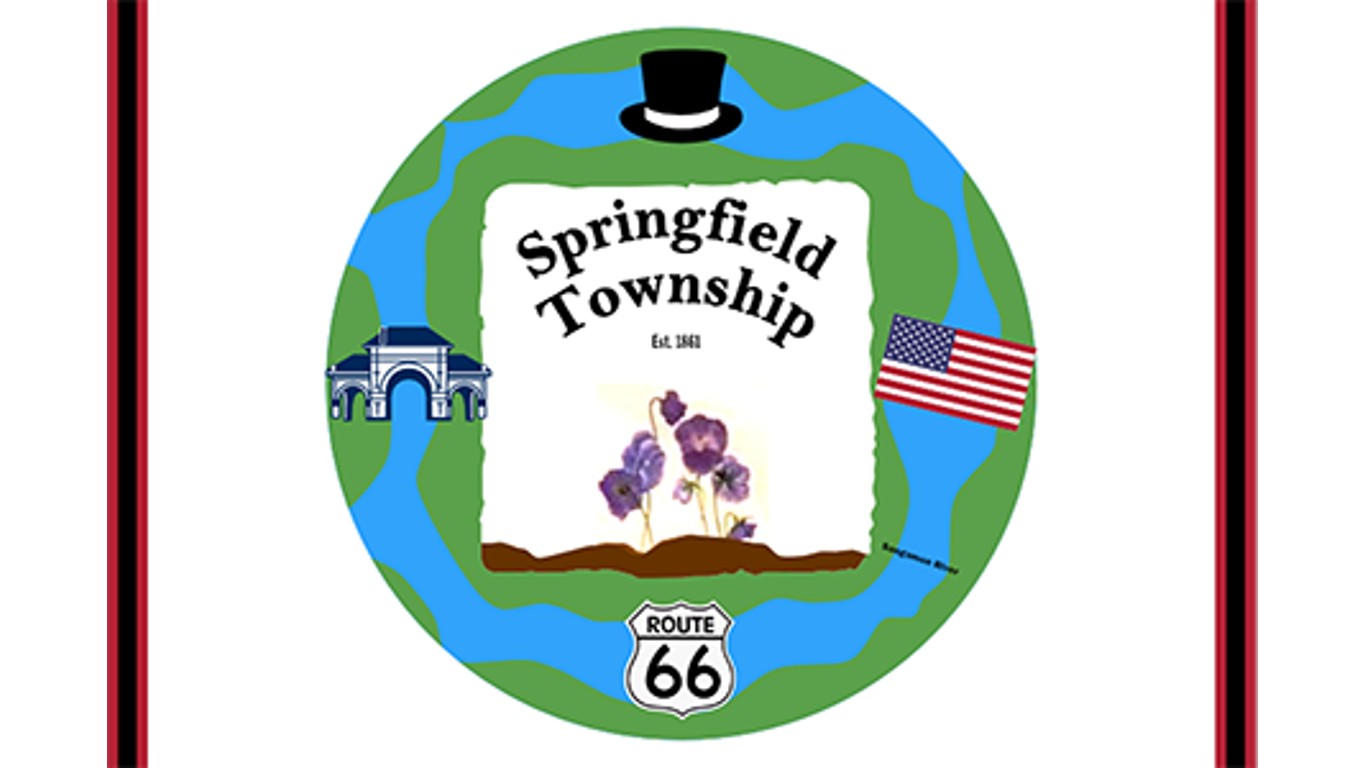
8. Springfield Township, Sangamon County, Illinois
> Avg score: 1.09/10
[in-text-ad]

7. Caldwell, Idaho
> Avg score: 1.06/10
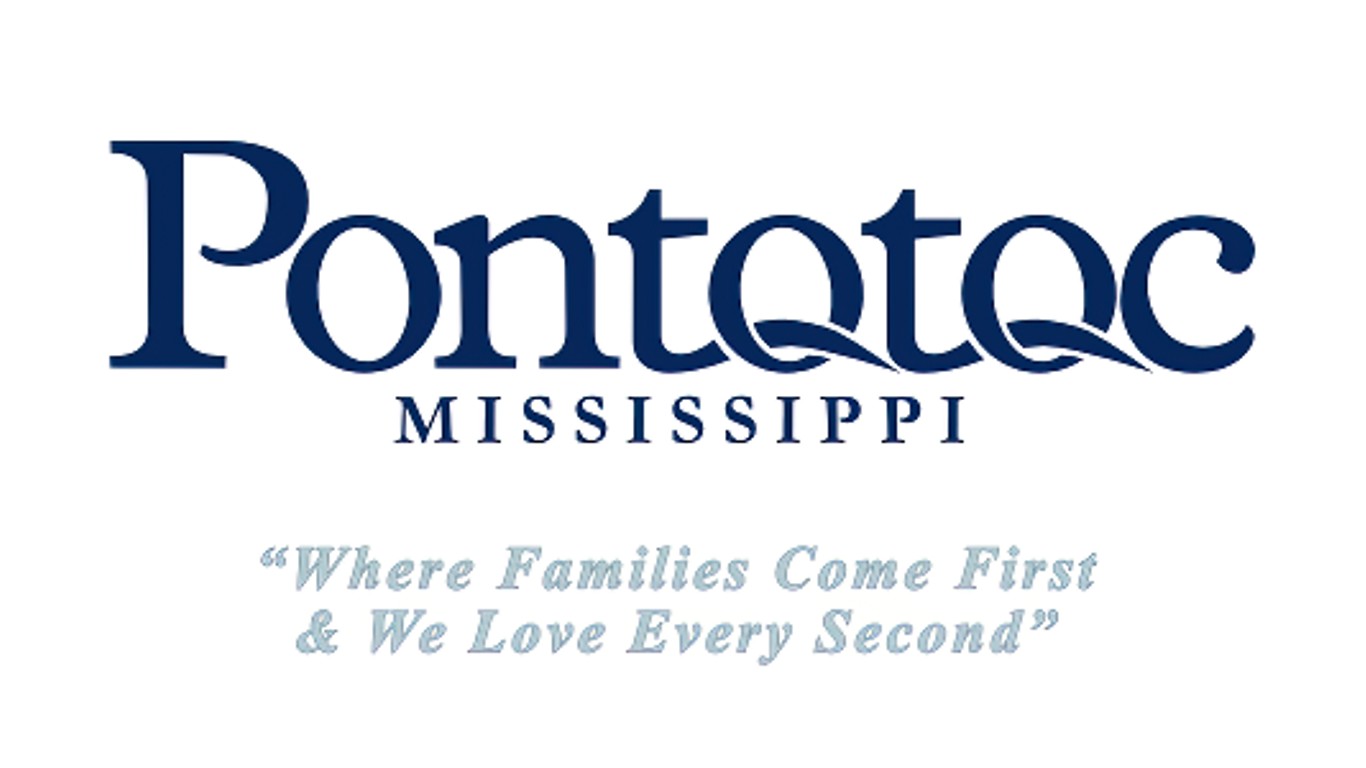
6. Pontotoc, Mississippi
> Avg score: 1.05/10
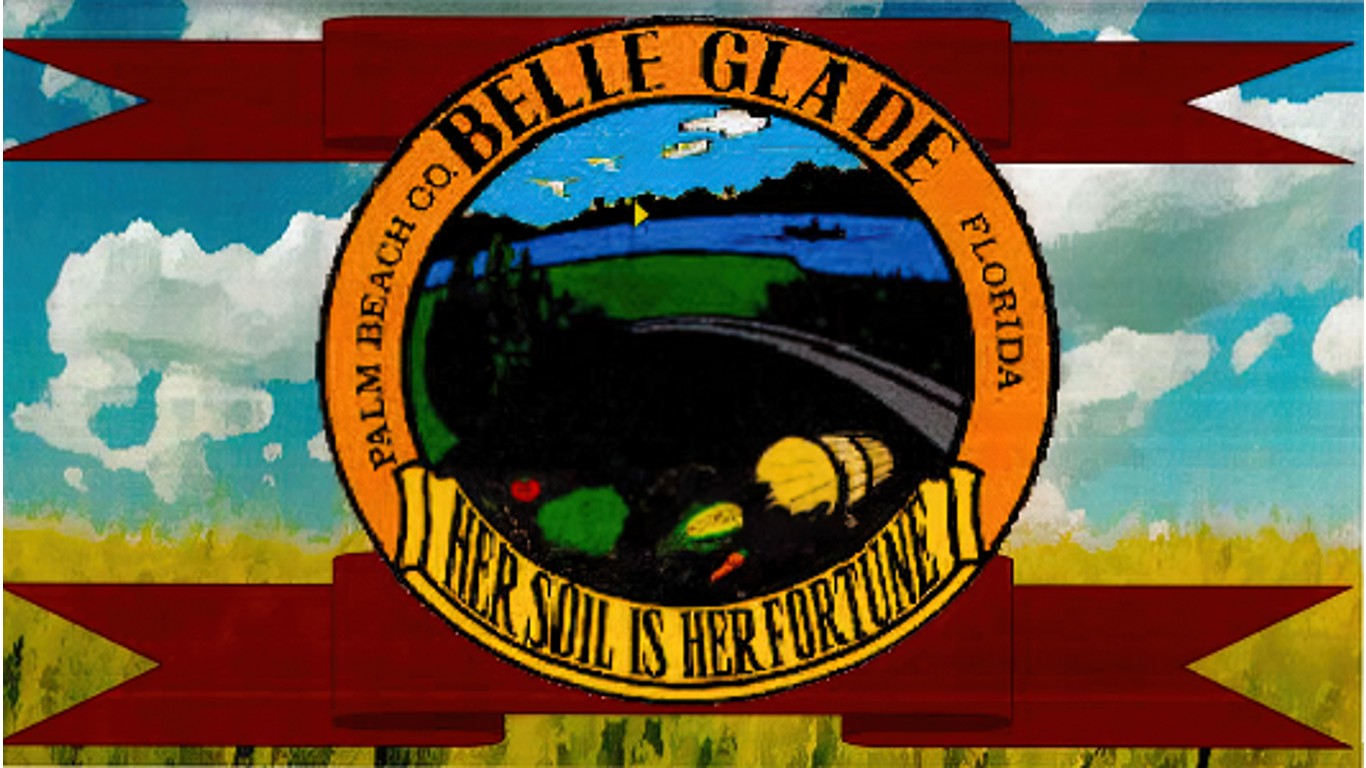
5. Belle Glade, Florida
> Avg score: 1.05/10
[in-text-ad-2]
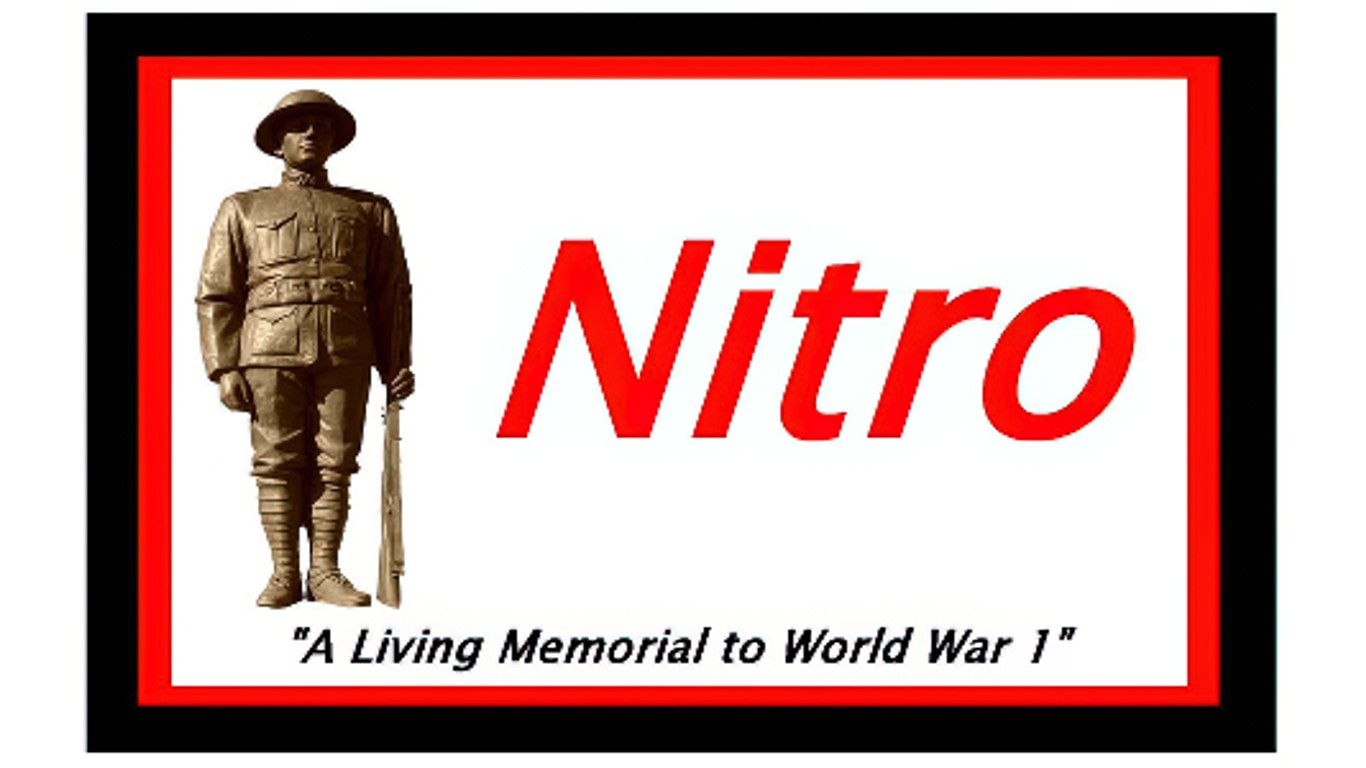
4. Nitro, West Virginia
> Avg score: 1.04/10
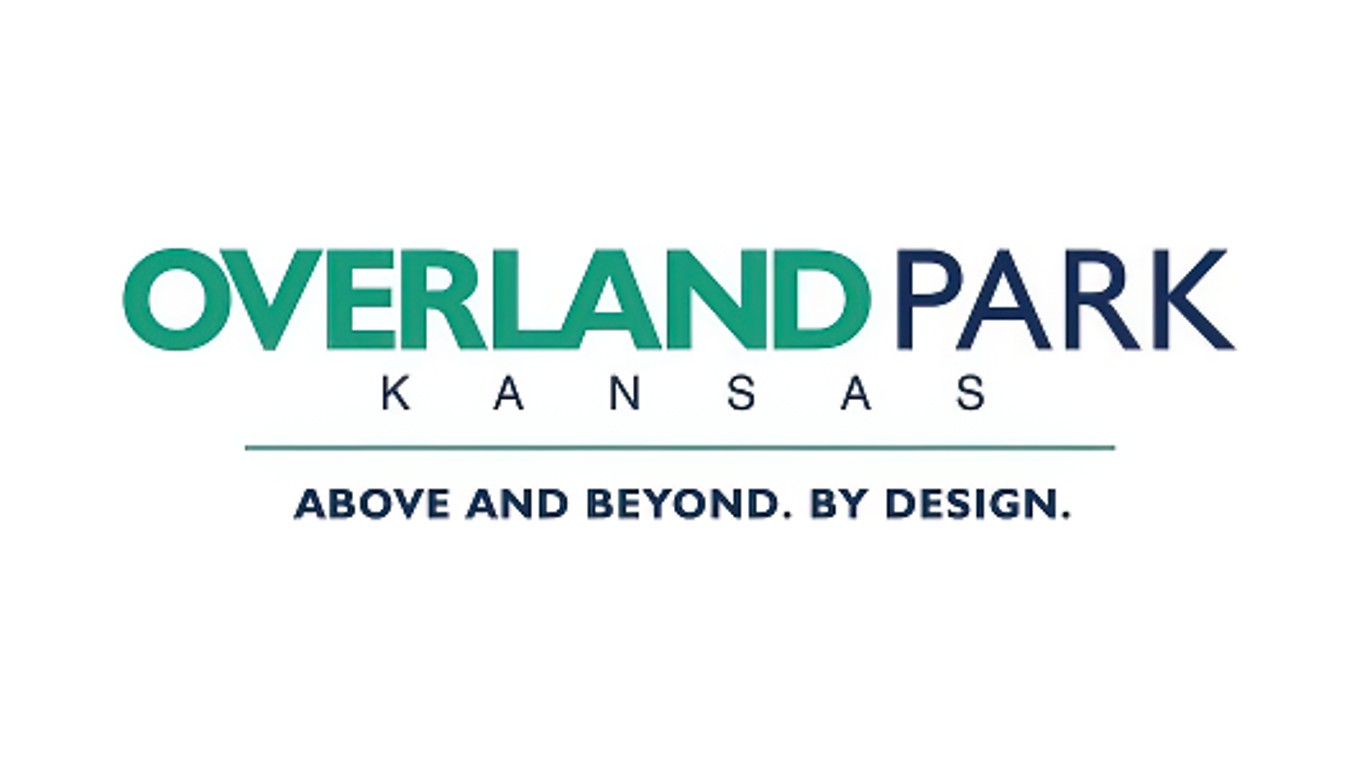
3. Overland Park, Kansas
> Avg score: 0.99/10
[in-text-ad]

2. Westhampton, Massachusetts
> Avg score: 0.97/10
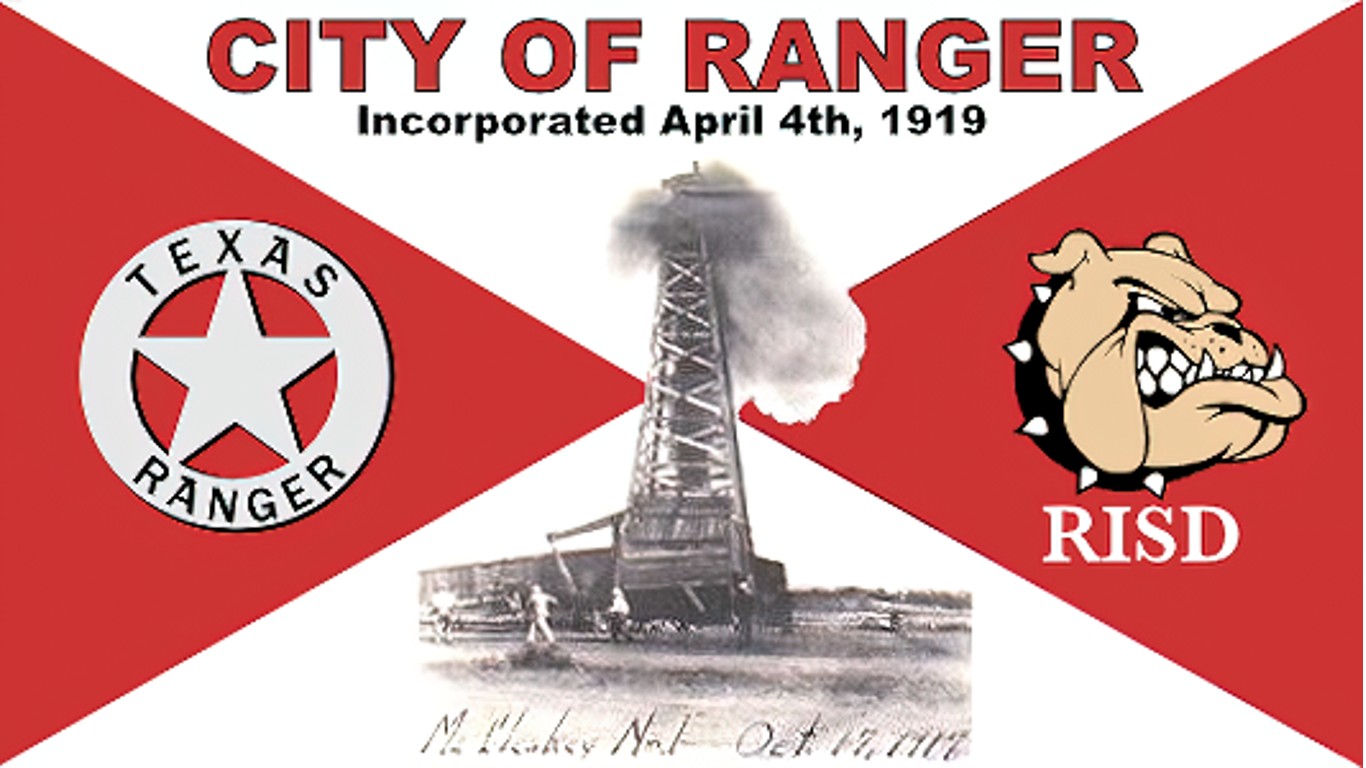
1. Ranger, Texas
> Avg score: 0.94/10
Are You Ahead, or Behind on Retirement? (sponsor)
If you’re one of the over 4 Million Americans set to retire this year, you may want to pay attention.
Finding a financial advisor who puts your interest first can be the difference between a rich retirement and barely getting by, and today it’s easier than ever. SmartAsset’s free tool matches you with up to three fiduciary financial advisors that serve your area in minutes. Each advisor has been carefully vetted, and must act in your best interests. Start your search now.
Don’t waste another minute; get started right here and help your retirement dreams become a retirement reality.
Thank you for reading! Have some feedback for us?
Contact the 24/7 Wall St. editorial team.
 24/7 Wall St.
 24/7 Wall St.
 24/7 Wall St.
 24/7 Wall St.
