Special Report
The Most Common Cancers in America, and Their Survival Rates

Published:

Despite significant strides in cancer detection and treatment, cancer remains a scary word. It’s certainly scarier than hearing you have a chronic condition. But the truth is that this potentially deadly disease, in many cases, can often be put in the same category as other manageable illnesses such as hypertension and diabetes.
An increasing number of people are surviving for more than five years after being diagnosed with almost all major types of cancer, according to the latest data provided by the American Cancer Society. But the improvement has been uneven across the different types of the disease. Some forms of the illness have survival rates that have more than quadrupled since the late 1970s, while others have seen little progress.
To identify the cancers with the highest survival rates, 24/7 Tempo reviewed data on 5-year relative survival rates for various types of cancer for the years 2012-2018 from the American Cancer Society’s “Cancer Facts and Figures 2023,” which was released in January 2023. Rates are adjusted for normal life expectancy and are based on cases diagnosed in the 1975 to 1977, 1995 to 1997, and 2012- 2018 time frames. All cases were followed through 2019.
The higher survival rates are largely due to several factors, including early detection and better treatment. Early detection, especially for some cancers such as of the prostate, is crucial to increase the chance of survival. Prostate cancer is one of the most aggressive types but it can be detected with a blood test. (Here are 20 early and common symptoms that can be a sign of cancer.)
Click here to see the most common cancers in America and their survival rates
Treatment options have been revolutionized. While a few decades ago surgery and chemotherapy were the main kinds of medical care cancer patients got, now they have many more options, including immunotherapy, targeted drugs, hormone therapy, and radiation therapies.
In most cases, the prognosis of cancers with historically high rates of survival past the fifth year since a confirmed diagnosis continues to improve. Other cancers, such as of the liver or pancreas, also have significantly increased rates of survival, even though overall they are still low. For example, about 12% of patients with pancreatic cancer are expected to be alive after five years of treatment, but three decades ago, that number was closer to 4%.
A few cancers have a lower rate of survival, though the difference is no more than five percentage points. (Here are the states where deaths from cancer are going up.)

23. Pancreas
> Patients alive 5 years after diagnosed between 2012-2018: 12%
> Patients alive 5 years after diagnosed between 1995-1997: 4%
> Patients alive 5 years after diagnosed between 1975-1977: 3%
[in-text-ad]

22. Liver & intrahepatic bile duct
> Patients alive 5 years after diagnosed between 2012-2018: 21%
> Patients alive 5 years after diagnosed between 1995-1997: 7%
> Patients alive 5 years after diagnosed between 1975-1977: 3%

21. Esophagus
> Patients alive 5 years after diagnosed between 2012-2018: 21%
> Patients alive 5 years after diagnosed between 1995-1997: 13%
> Patients alive 5 years after diagnosed between 1975-1977: 5%
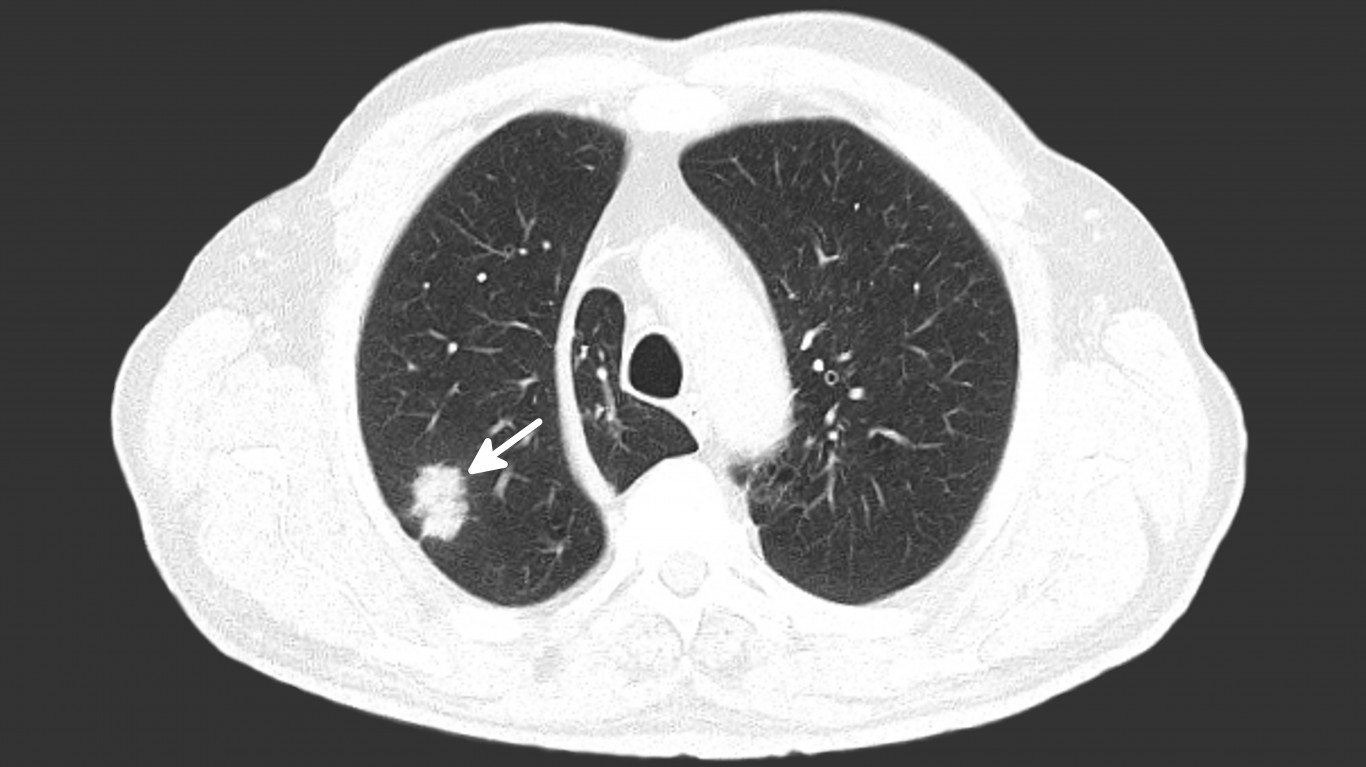
20. Lung & bronchus
> Patients alive 5 years after diagnosed between 2012-2018: 23%
> Patients alive 5 years after diagnosed between 1995-1997: 15%
> Patients alive 5 years after diagnosed between 1975-1977: 12%
[in-text-ad-2]
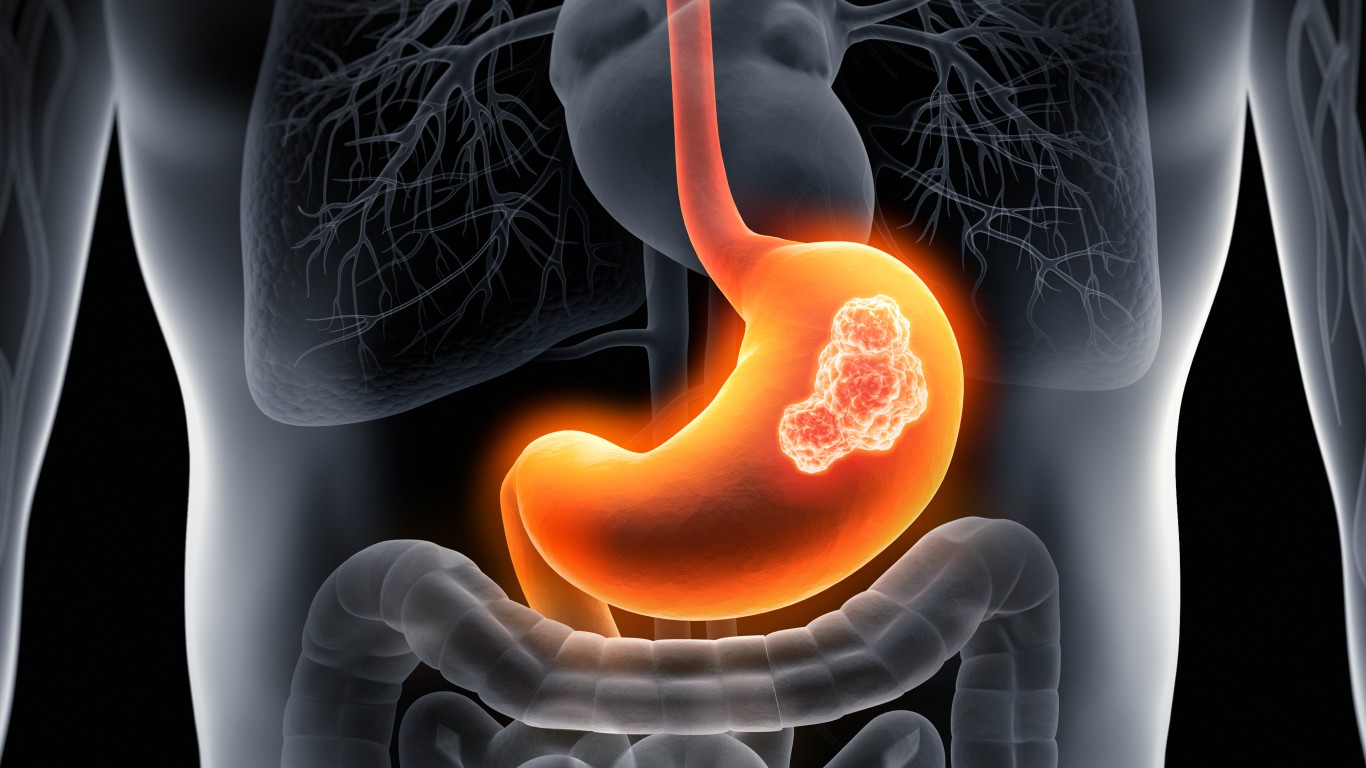
19. Stomach
> Patients alive 5 years after diagnosed between 2012-2018: 33%
> Patients alive 5 years after diagnosed between 1995-1997: 22%
> Patients alive 5 years after diagnosed between 1975-1977: 15%

18. Brain & other nervous system
> Patients alive 5 years after diagnosed between 2012-2018: 33%
> Patients alive 5 years after diagnosed between 1995-1997: 32%
> Patients alive 5 years after diagnosed between 1975-1977: 23%
[in-text-ad]

17. Ovary
> Patients alive 5 years after diagnosed between 2012-2018: 50%
> Patients alive 5 years after diagnosed between 1995-1997: 43%
> Patients alive 5 years after diagnosed between 1975-1977: 36%

16. Myeloma
> Patients alive 5 years after diagnosed between 2012-2018: 58%
> Patients alive 5 years after diagnosed between 1995-1997: 32%
> Patients alive 5 years after diagnosed between 1975-1977: 25%

15. Larynx
> Patients alive 5 years after diagnosed between 2012-2018: 61%
> Patients alive 5 years after diagnosed between 1995-1997: 66%
> Patients alive 5 years after diagnosed between 1975-1977: 66%
[in-text-ad-2]

14. Colon & rectum
> Patients alive 5 years after diagnosed between 2012-2018: 65%
> Patients alive 5 years after diagnosed between 1995-1997: 61%
> Patients alive 5 years after diagnosed between 1975-1977: 50%

13. Leukemia
> Patients alive 5 years after diagnosed between 2012-2018: 66%
> Patients alive 5 years after diagnosed between 1995-1997: 48%
> Patients alive 5 years after diagnosed between 1975-1977: 34%
[in-text-ad]

12. Uterine cervix
> Patients alive 5 years after diagnosed between 2012-2018: 67%
> Patients alive 5 years after diagnosed between 1995-1997: 73%
> Patients alive 5 years after diagnosed between 1975-1977: 69%

11. Oral cavity & pharynx
> Patients alive 5 years after diagnosed between 2012-2018: 68%
> Patients alive 5 years after diagnosed between 1995-1997: 58%
> Patients alive 5 years after diagnosed between 1975-1977: 53%

10. Non-Hodgkin lymphoma
> Patients alive 5 years after diagnosed between 2012-2018: 74%
> Patients alive 5 years after diagnosed between 1995-1997: 56%
> Patients alive 5 years after diagnosed between 1975-1977: 47%
[in-text-ad-2]

9. Kidney & renal pelvis
> Patients alive 5 years after diagnosed between 2012-2018: 77%
> Patients alive 5 years after diagnosed between 1995-1997: 62%
> Patients alive 5 years after diagnosed between 1975-1977: 50%

8. Urinary bladder
> Patients alive 5 years after diagnosed between 2012-2018: 77%
> Patients alive 5 years after diagnosed between 1995-1997: 82%
> Patients alive 5 years after diagnosed between 1975-1977: 72%
[in-text-ad]
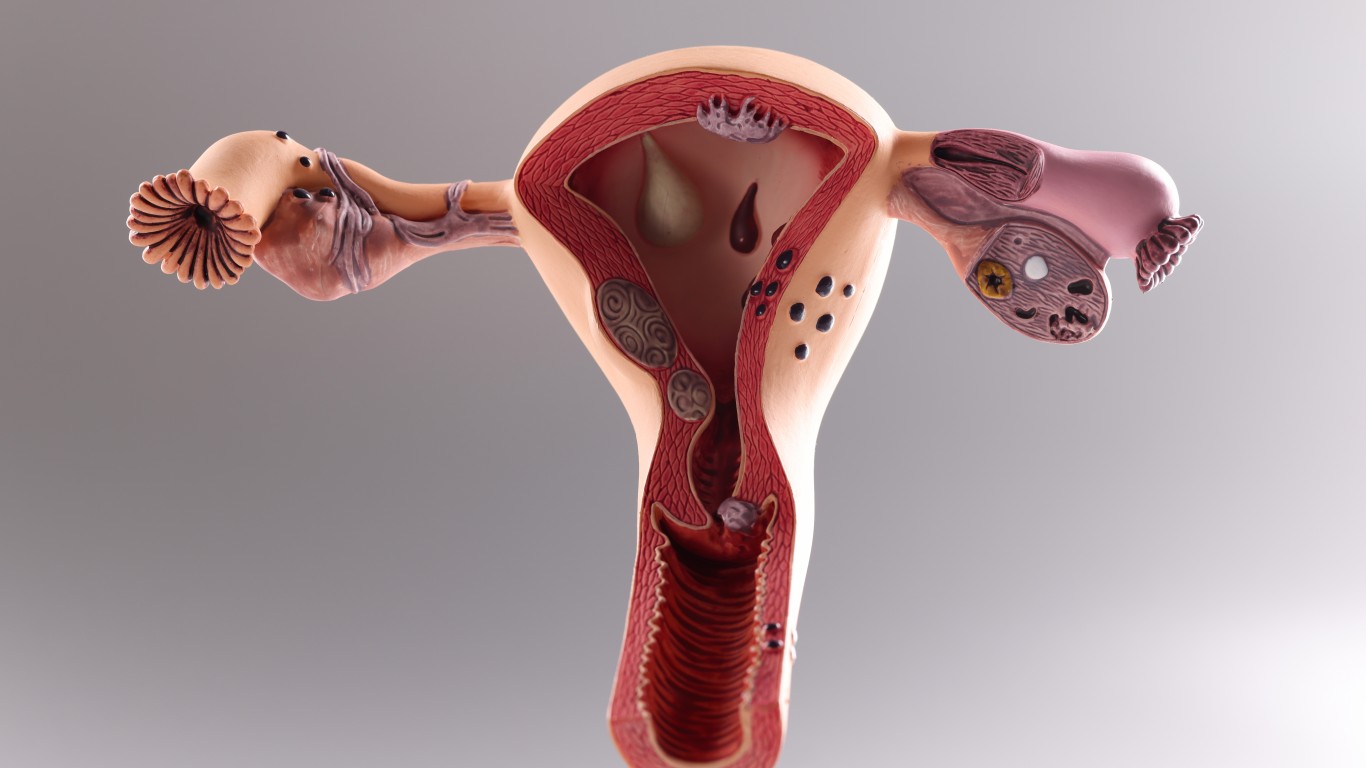
7. Uterine corpus
> Patients alive 5 years after diagnosed between 2012-2018: 81%
> Patients alive 5 years after diagnosed between 1995-1997: 84%
> Patients alive 5 years after diagnosed between 1975-1977: 87%

6. Hodgkin lymphoma
> Patients alive 5 years after diagnosed between 2012-2018: 89%
> Patients alive 5 years after diagnosed between 1995-1997: 84%
> Patients alive 5 years after diagnosed between 1975-1977: 72%

5. Breast (female)
> Patients alive 5 years after diagnosed between 2012-2018: 91%
> Patients alive 5 years after diagnosed between 1995-1997: 87%
> Patients alive 5 years after diagnosed between 1975-1977: 75%
[in-text-ad-2]
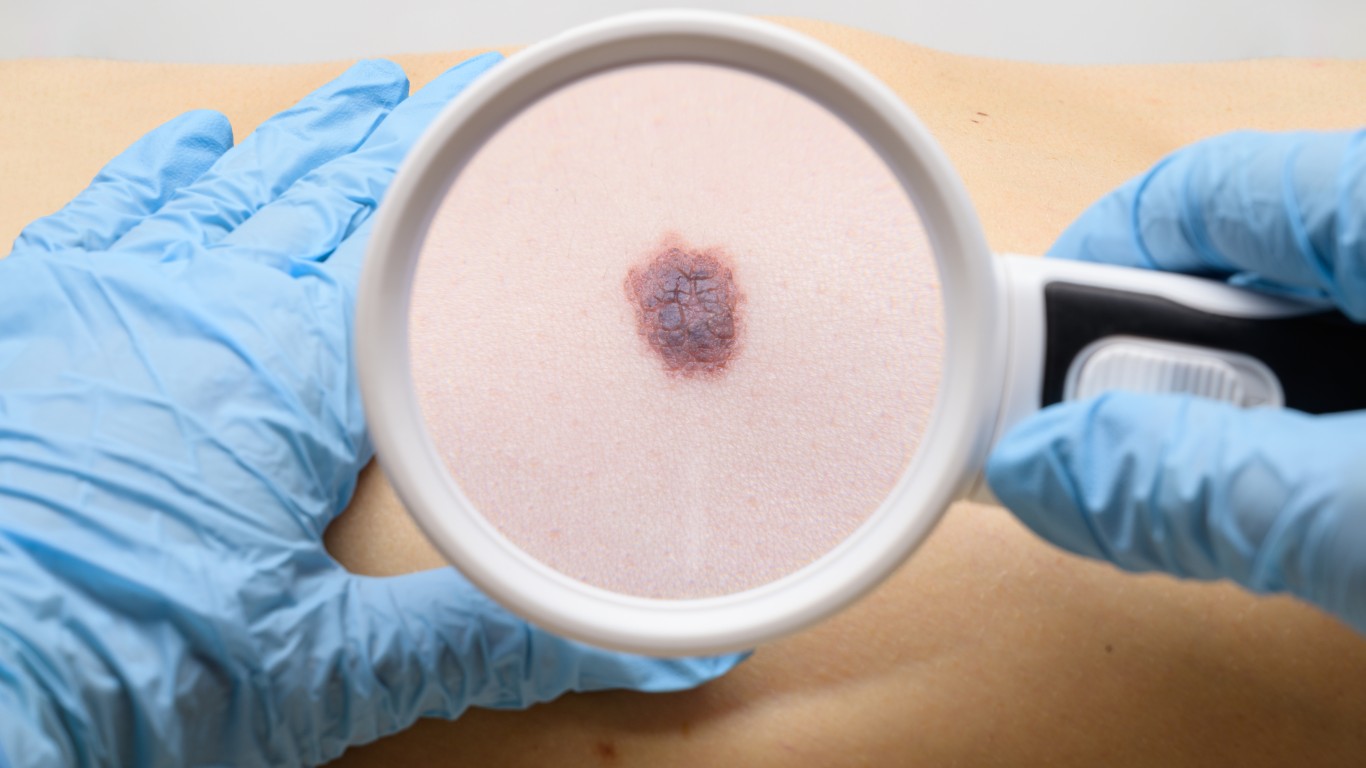
4. Melanoma of the skin
> Patients alive 5 years after diagnosed between 2012-2018: 94%
> Patients alive 5 years after diagnosed between 1995-1997: 91%
> Patients alive 5 years after diagnosed between 1975-1977: 82%

3. Testis
> Patients alive 5 years after diagnosed between 2012-2018: 95%
> Patients alive 5 years after diagnosed between 1995-1997: 96%
> Patients alive 5 years after diagnosed between 1975-1977: 83%
[in-text-ad]

2. Prostate
> Patients alive 5 years after diagnosed between 2012-2018: 97%
> Patients alive 5 years after diagnosed between 1995-1997: 97%
> Patients alive 5 years after diagnosed between 1975-1977: 68%
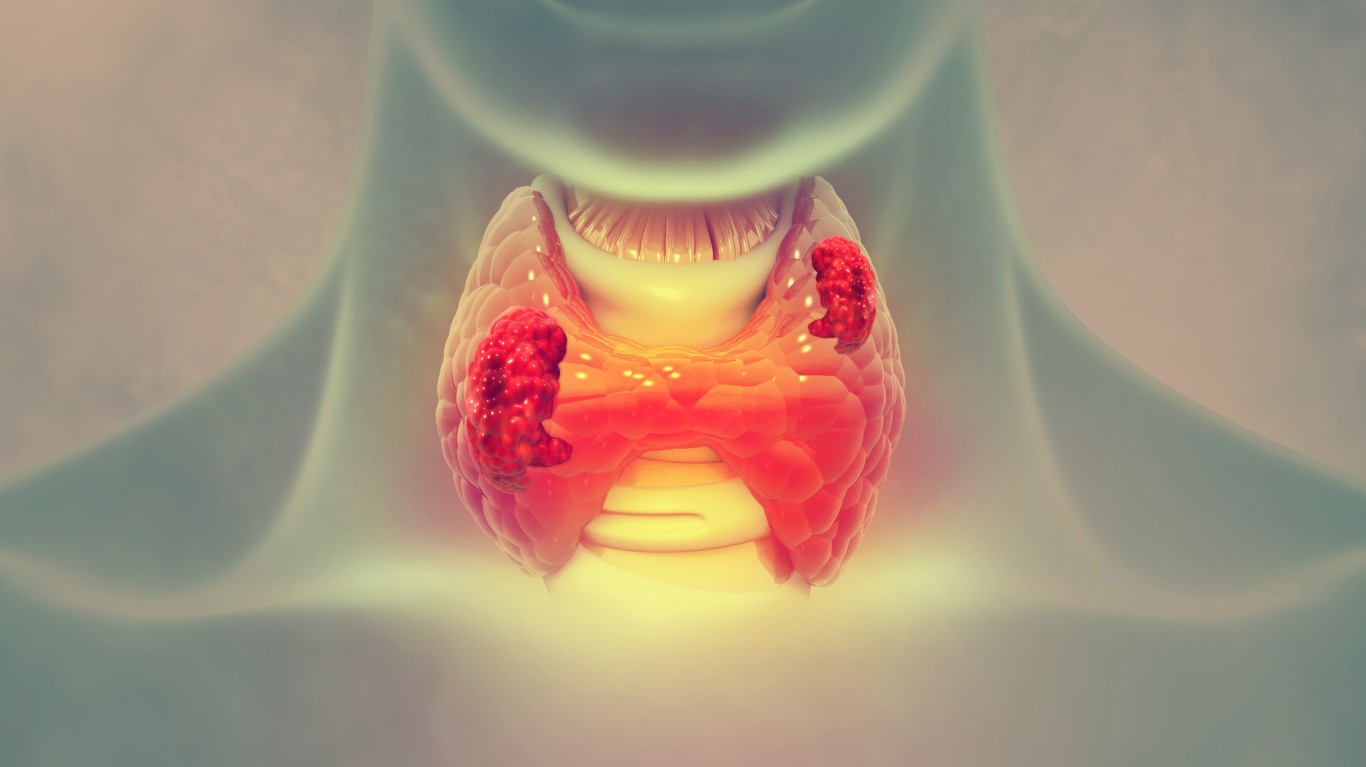
1. Thyroid
> Patients alive 5 years after diagnosed between 2012-2018: 98%
> Patients alive 5 years after diagnosed between 1995-1997: 95%
> Patients alive 5 years after diagnosed between 1975-1977: 92%
Are you ready for retirement? Planning for retirement can be overwhelming, that’s why it could be a good idea to speak to a fiduciary financial advisor about your goals today.
Start by taking this retirement quiz right here from SmartAsset that will match you with up to 3 financial advisors that serve your area and beyond in 5 minutes. Smart Asset is now matching over 50,000 people a month.
Click here now to get started.
Thank you for reading! Have some feedback for us?
Contact the 24/7 Wall St. editorial team.