Special Report
The 25 Companies Making Billions Building The World's Weapons
Published:
Last Updated:

This month, Department of Defense submitted its fiscal year 2024 budget request, for a grand total of $824 billion. If approved as-is, that would be an increase over the $816 billion DoD budget in FY2023. Even after its major wars in the Middle East — Iraq and Afghanistan — have ended, American military spending remains a gargantuan expense to U.S. taxpayers.
Some of the main beneficiaries from the billions that go into this latest budget will be American military contractors. The world’s 100 largest defense contractors recorded over $592 billion arms and military services sales in 2021, up 1.9% in real terms from the previous year. And the vast majority of those sales – over 70% – went to the coffers of 25 industry giants.
Using data on 2021 arms and military services sales from the Stockholm International Peace Research Institute, 24/7 Wall St. identified the countries profiting most from war. Each of the 25 companies on this list is estimated to have topped $5 billion in arms and military services sales in 2021.
The world’s five largest defense contractors in 2021 – as measured by arms sales – are all headquartered in the United States. The U.S. military budget is by far the largest of any country in the world, topping $800 billion in 2021, more than the next nine countries combined.
Much of that money goes directly to many of the companies on this list, including Lockheed Martin, maker of the fifth generation F-35 fighter jet, and Northrop Grumman, the company behind the newly unveiled B-21 Raider stealth bomber. Each of these weapons systems has a nine-figure price tag. (Here is a look at the 22 new weapons in the U.S. military budget next year.)
All told, 12 of the 25 largest defense contractors are headquartered in the United States, seven are in China, and the rest are in Europe and the United Kingdom.
None of the companies on this list trade exclusively in arms and military services. In fact, 10 of the largest defense contractors derived most of their 2021 revenue from non-military contracts. Boeing, for example, manufactures a range of weapons systems, including the V-22 Osprey, a plane capable of vertical takeoff and landing. But nearly half of its 2021 revenue came from other divisions, such as commercial aircraft.
Click here to see the companies profiting most from war.
Click here to read our detailed methodology.

25. Amentum
> Arms sales; 2021: $5.0 billion* (approx. 78% of annual company revenue)
> 1-yr. change in arms sales (inflation adj.): +3.3%
> Company headquartered in: United States
> *Note: The arms sales figure for this company is an estimate with a high degree of uncertainty. Amentum is a spinoff of AECOM’s Management Services segment. It also bought Dyncorp International in November 2020. Amentum’s arms sales figure for 2020 is pro forma, i.e. it is the combined 2020 arms sales of AECOM and Dyncorp International.
[in-text-ad]
24. Safran
> Arms sales; 2021: $5.0 billion (approx. 28% of annual company revenue)
> 1-yr. change in arms sales (inflation adj.): +5.9%
> Company headquartered in: France

23. Honeywell International
> Arms sales; 2021: $5.2 billion (approx. 15% of annual company revenue)
> 1-yr. change in arms sales (inflation adj.): -14.7%
> Company headquartered in: United States
22. Booz Allen Hamilton
> Arms sales; 2021: $5.6 billion (approx. 67% of annual company revenue)
> 1-yr. change in arms sales (inflation adj.): -2.4%
> Company headquartered in: United States
[in-text-ad-2]

21. Peraton
> Arms sales; 2021: $5.8 billion* (approx. 83% of annual company revenue)
> 1-yr. change in arms sales (inflation adj.): +0.02%
> Company headquartered in: United States
> *Note: The arms sales figure for this company is an estimate with a high degree of uncertainty. Peraton acquired Perspecta and Northrop Grumman’s integrated mission support and IT solutions business in 2021. Its arms sales figure for 2020 is pro forma, i.e. it is the combined 2020 arms sales of Peraton, Perspecta and Northrup Grumman’s integrated mission support and IT solutions business.

20. CSGC
> Arms sales; 2021: $5.9 billion (approx. 13% of annual company revenue)
> 1-yr. change in arms sales (inflation adj.): +1.5%
> Company headquartered in: China
[in-text-ad]
19. Dassault Aviation Group
> Arms sales; 2021: $6.3 billion (approx. 73% of annual company revenue)
> 1-yr. change in arms sales (inflation adj.): +58.9%
> Company headquartered in: France
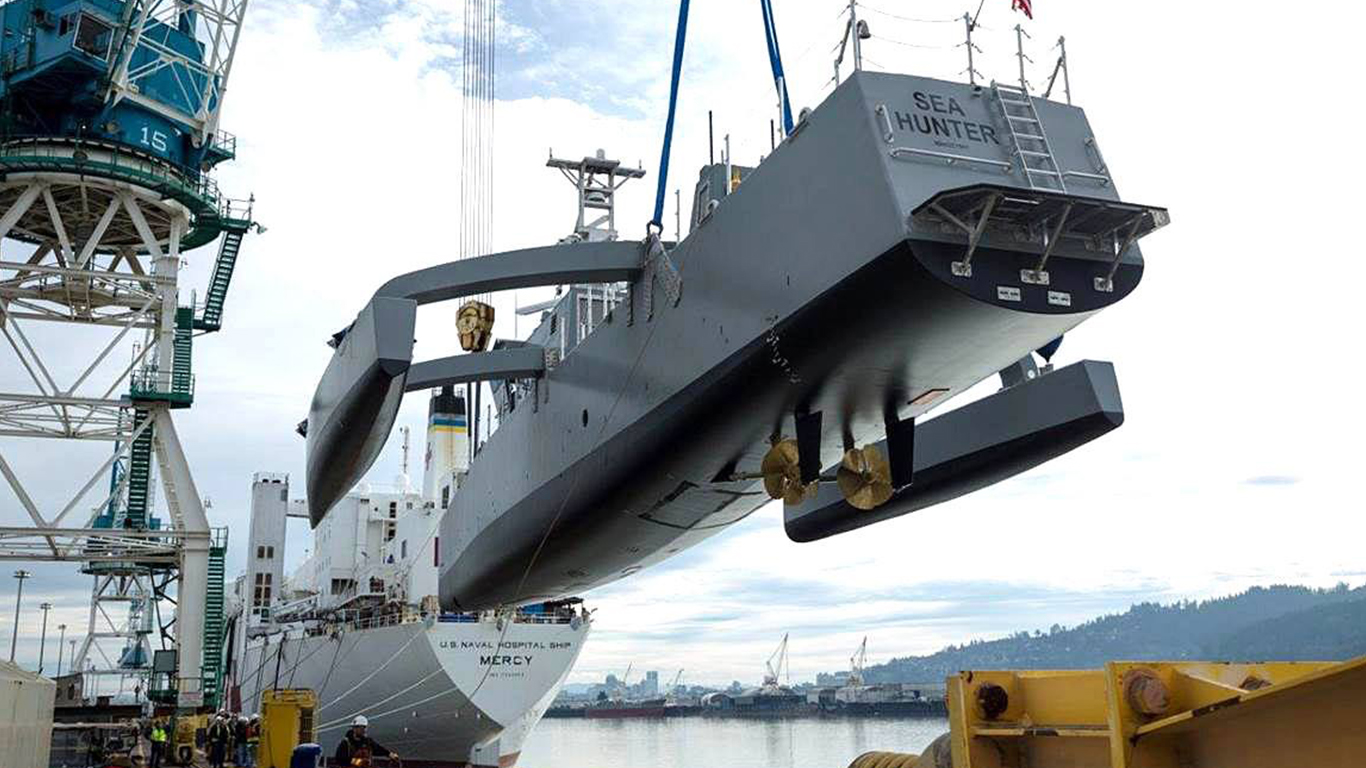
18. Leidos
> Arms sales; 2021: $8.0 billion (approx. 58% of annual company revenue)
> 1-yr. change in arms sales (inflation adj.): +4.9%
> Company headquartered in: United States

17. Huntington Ingalls Industries
> Arms sales; 2021: $8.6 billion* (approx. 90% of annual company revenue)
> 1-yr. change in arms sales (inflation adj.): -0.3%
> Company headquartered in: United States
> *Note: Huntington Ingalls Industries was renamed HII in 2022.
[in-text-ad-2]

16. Thales
> Arms sales; 2021: $9.8 billion (approx. 51% of annual company revenue)
> 1-yr. change in arms sales (inflation adj.): +2.1%
> Company headquartered in: France
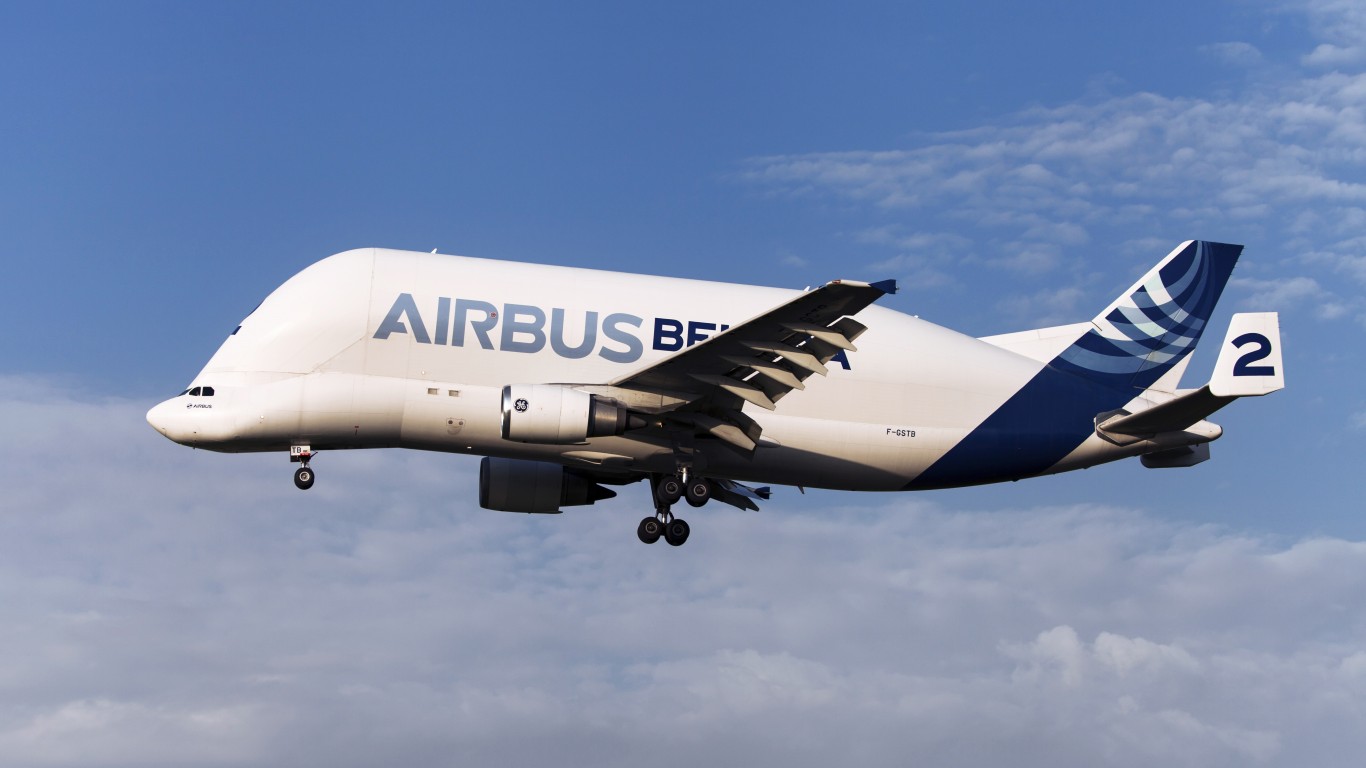
15. Airbus
> Arms sales; 2021: $10.9 billion (approx. 18% of annual company revenue)
> 1-yr. change in arms sales (inflation adj.): -14.8%
> Company headquartered in: Trans-European
[in-text-ad]

14. CSSC
> Arms sales; 2021: $11.1 billion* (approx. 21% of annual company revenue)
> 1-yr. change in arms sales (inflation adj.): +9.3%
> Company headquartered in: China
> *Note: The arms sales figure for this company is an estimate with a high degree of uncertainty.

13. L3Harris Technologies
> Arms sales; 2021: $13.4 billion (approx. 75% of annual company revenue)
> 1-yr. change in arms sales (inflation adj.): -9.7%
> Company headquartered in: United States
12. Leonardo
> Arms sales; 2021: $13.9 billion (approx. 83% of annual company revenue)
> 1-yr. change in arms sales (inflation adj.): +17.5%
> Company headquartered in: Italy
[in-text-ad-2]
11. CASIC
> Arms sales; 2021: $14.5 billion* (approx. 31% of annual company revenue)
> 1-yr. change in arms sales (inflation adj.): +12.6%
> Company headquartered in: China
> *Note: The arms sales figure for this company is an estimate with a high degree of uncertainty.
10. CETC
> Arms sales; 2021: $15.0 billion* (approx. 27% of annual company revenue)
> 1-yr. change in arms sales (inflation adj.): -5.6%
> Company headquartered in: China
> *Note: The arms sales figure for this company is an estimate with a high degree of uncertainty.
[in-text-ad]
9. CASC
> Arms sales; 2021: $19.1 billion* (approx. 44% of annual company revenue)
> 1-yr. change in arms sales (inflation adj.): +4.2%
> Company headquartered in: China
> *Note: The arms sales figure for this company is an estimate with a high degree of uncertainty.
8. AVIC
> Arms sales; 2021: $20.1 billion (approx. 25% of annual company revenue)
> 1-yr. change in arms sales (inflation adj.): +9.0%
> Company headquartered in: China

7. NORINCO
> Arms sales; 2021: $21.6 billion (approx. 26% of annual company revenue)
> 1-yr. change in arms sales (inflation adj.): +10.7%
> Company headquartered in: China
[in-text-ad-2]
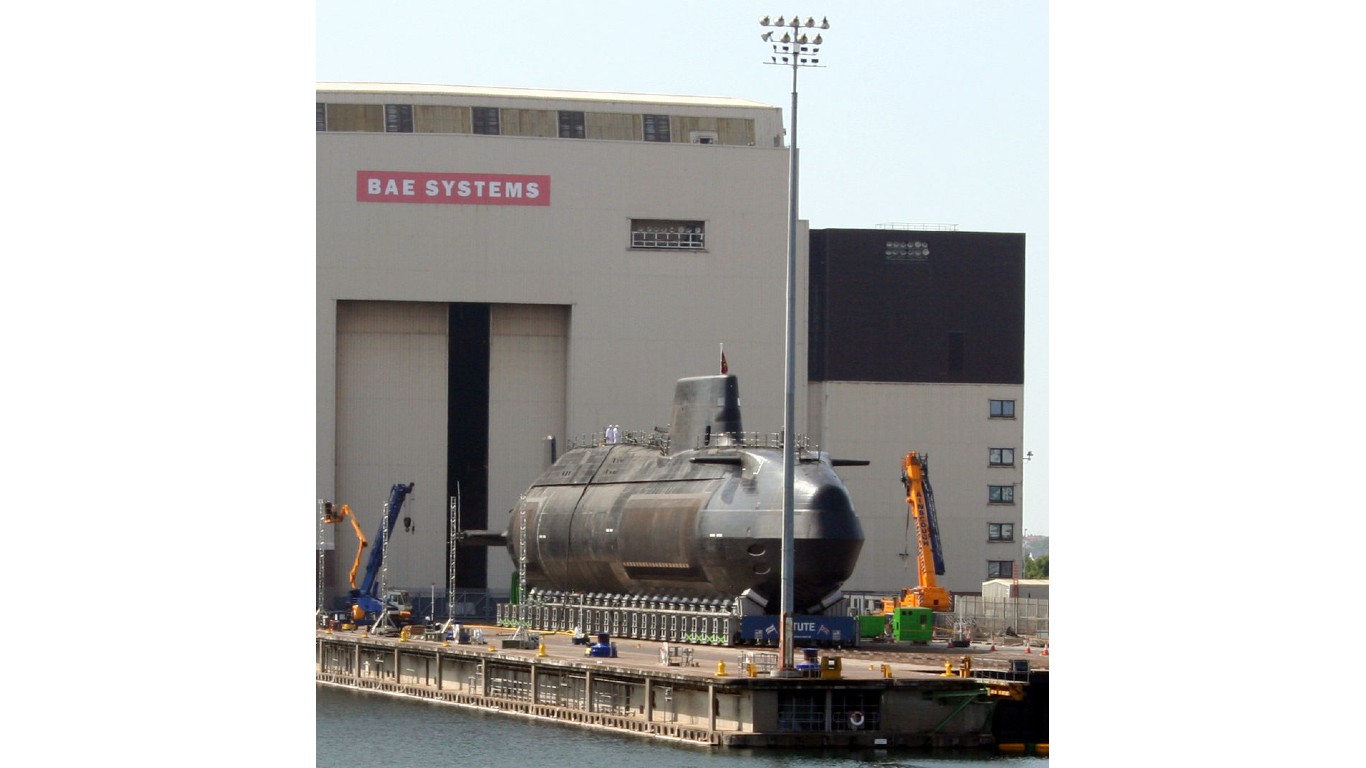
6. BAE Systems
> Arms sales; 2021: $26.0 billion (approx. 97% of annual company revenue)
> 1-yr. change in arms sales (inflation adj.): -1.0%
> Company headquartered in: United Kingdom
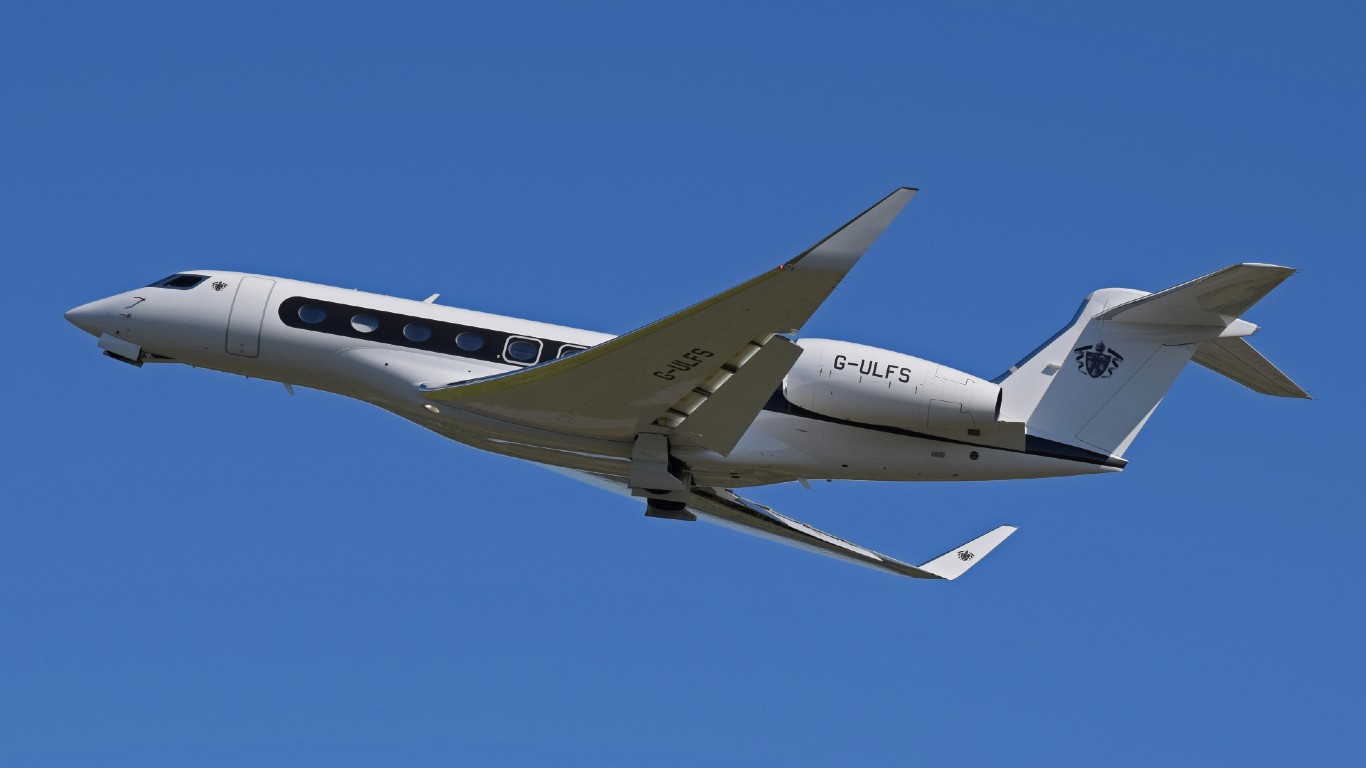
5. General Dynamics Corp.
> Arms sales; 2021: $26.4 billion (approx. 69% of annual company revenue)
> 1-yr. change in arms sales (inflation adj.): -2.1%
> Company headquartered in: United States
[in-text-ad]

4. Northrop Grumman Corp.
> Arms sales; 2021: $29.9 billion (approx. 84% of annual company revenue)
> 1-yr. change in arms sales (inflation adj.): -5.8%
> Company headquartered in: United States
3. Boeing
> Arms sales; 2021: $33.4 billion (approx. 54% of annual company revenue)
> 1-yr. change in arms sales (inflation adj.): -2.1%
> Company headquartered in: United States
2. Raytheon Technologies
> Arms sales; 2021: $41.9 billion (approx. 65% of annual company revenue)
> 1-yr. change in arms sales (inflation adj.): +9.1%
> Company headquartered in: United States
[in-text-ad-2]
1. Lockheed Martin Corp.
> Arms sales; 2021: $60.3 billion (approx. 90% of annual company revenue)
> 1-yr. change in arms sales (inflation adj.): -0.6%
> Company headquartered in: United States
Methodology
To identify the companies profiting most from war, 24/7 Wall St. reviewed data from the Stockholm International Peace Research Institute. Companies are ranked based on SIPRI’s estimates of arms and military services sales in 2021.
Year-over-year change in revenue from arms sales are also from SIPRI and use 2020 sales figures adjusted for inflation to be comparable to the current year. Notes, including those identifying companies for which arms sales data is uncertain, are from SIPRI.
Are you ready for retirement? Planning for retirement can be overwhelming, that’s why it could be a good idea to speak to a fiduciary financial advisor about your goals today.
Start by taking this retirement quiz right here from SmartAsset that will match you with up to 3 financial advisors that serve your area and beyond in 5 minutes. Smart Asset is now matching over 50,000 people a month.
Click here now to get started.
Thank you for reading! Have some feedback for us?
Contact the 24/7 Wall St. editorial team.