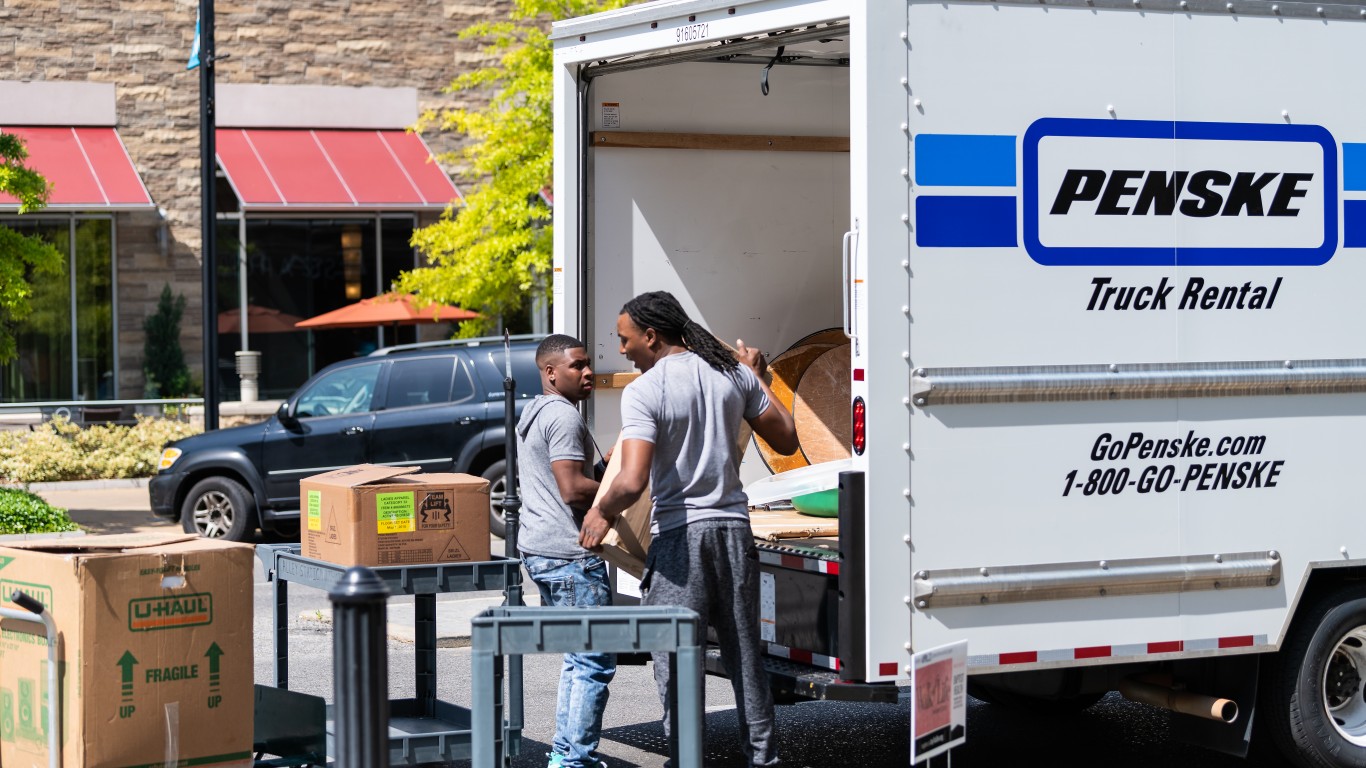
Across the country, hundreds of thousands of companies have established remote work policies in the wake of the COVID-19 pandemic. No longer bound to an office, millions of Americans are now free to relocate without having to consider proximity to their employer – and some clear trends are emerging.
A recent study from United Van Lines, a moving services company, showed that in some parts of the country, far more people are leaving than are moving in.
Using data from the Annual 2021 United Van Lines National Movers Study, 24/7 Wall St. identified the states people are leaving in droves. In each of the 11 states on this list, 56% or more of all moves – either in or out of the state – were outbound, as reported by United Van Lines. Notably, Alaska and Hawaii were not considered in this analysis.
Most states on this list are in the Midwest and the Northeast. The Western and Southern U.S. regions have only one state on this list each.
Though Americans may choose to move for any number of reasons, the highest ranking states on this list are expensive places to live. Among the top six states people are leaving, the cost of living that ranges from 0.5% to 11.2% higher than the national average. (Here is a look at the most expensive city to live in every state.)
Climate may also be a factor in these migration patterns. Most of these same states, including many in the Midwest and Northeast, have harsh winters that many would be happy to leave behind in favor of warmer, southern climates. United Van Lines moving data shows that states like Alabama, Florida, and South Carolina are among the states Americans are moving to at a far faster rate than they are leaving. (Here is a look at the state most people are moving to.)
Click here to see 11 states people are leaving in droves.
Click here to see our detailed methodology.

11. Ohio
> Outbound moves in 2021: 56% of all moves (3,598 total)
> Inbound moves in 2021: 44% of all moves (2,793 total)
> Outbound moves per 100,000 households: 74
> Total population: 11,780,017
> Cost of living: 8.3% lower than US avg.
[in-text-ad]

10. Nebraska
> Outbound moves in 2021: 56% of all moves (953 total)
> Inbound moves in 2021: 44% of all moves (759 total)
> Outbound moves per 100,000 households: 121
> Total population: 1,963,692
> Cost of living: 7.1% lower than US avg.

9. Kansas
> Outbound moves in 2021: 56% of all moves (1,521 total)
> Inbound moves in 2021: 45% of all moves (1,220 total)
> Outbound moves per 100,000 households: 131
> Total population: 2,934,582
> Cost of living: 7.6% lower than US avg.

8. Louisiana
> Outbound moves in 2021: 57% of all moves (1,436 total)
> Inbound moves in 2021: 44% of all moves (1,106 total)
> Outbound moves per 100,000 households: 80
> Total population: 4,624,047
> Cost of living: 7.3% lower than US avg.
[in-text-ad-2]

7. Michigan
> Outbound moves in 2021: 58% of all moves (2,727 total)
> Inbound moves in 2021: 42% of all moves (2,003 total)
> Outbound moves per 100,000 households: 67
> Total population: 10,050,811
> Cost of living: 6.0% lower than US avg.

6. Massachusetts
> Outbound moves in 2021: 58% of all moves (2,984 total)
> Inbound moves in 2021: 42% of all moves (2,199 total)
> Outbound moves per 100,000 households: 108
> Total population: 6,984,723
> Cost of living: 7.4% higher than US avg.
[in-text-ad]

5. California
> Outbound moves in 2021: 59% of all moves (15,836 total)
> Inbound moves in 2021: 41% of all moves (10,875 total)
> Outbound moves per 100,000 households: 118
> Total population: 39,237,836
> Cost of living: 10.4% higher than US avg.

4. Connecticut
> Outbound moves in 2021: 60% of all moves (1,734 total)
> Inbound moves in 2021: 40% of all moves (1,153 total)
> Outbound moves per 100,000 households: 121
> Total population: 3,605,597
> Cost of living: 3.4% higher than US avg.

3. New York
> Outbound moves in 2021: 63% of all moves (5,714 total)
> Inbound moves in 2021: 37% of all moves (3,336 total)
> Outbound moves per 100,000 households: 75
> Total population: 19,835,913
> Cost of living: 10.2% higher than US avg.
[in-text-ad-2]

2. Illinois
> Outbound moves in 2021: 67% of all moves (6,181 total)
> Inbound moves in 2021: 33% of all moves (3,018 total)
> Outbound moves per 100,000 households: 124
> Total population: 12,671,469
> Cost of living: 0.5% higher than US avg.

1. New Jersey
> Outbound moves in 2021: 71% of all moves (3,770 total)
> Inbound moves in 2021: 30% of all moves (1,578 total)
> Outbound moves per 100,000 households: 108
> Total population: 9,267,130
> Cost of living: 11.2% higher than US avg.
Methodology
To identify the states people are leaving in droves, 24/7 Wall St. reviewed data from the Annual 2021 United Van Lines National Movers Study. States are ranked by the number of outbound moves as a share of all moves – the sum of inbound and outbound moves in 2021. Moving data is limited to those conducted by United Van Lines, a relocation company.
We also considered the number of outbound moves for every 100,000 households in each state. Data on the number of households and the total population are one year estimates from the U.S. Census Bureau’s 2021 American Community Survey. Alaska and Hawaii were not included in this analysis.
The #1 Thing to Do Before You Claim Social Security (Sponsor)
Choosing the right (or wrong) time to claim Social Security can dramatically change your retirement. So, before making one of the biggest decisions of your financial life, it’s a smart idea to get an extra set of eyes on your complete financial situation.
A financial advisor can help you decide the right Social Security option for you and your family. Finding a qualified financial advisor doesn’t have to be hard. SmartAsset’s free tool matches you with up to three financial advisors who serve your area, and you can interview your advisor matches at no cost to decide which one is right for you.
Click here to match with up to 3 financial pros who would be excited to help you optimize your Social Security outcomes.
Have questions about retirement or personal finance? Email us at [email protected]!
By emailing your questions to 24/7 Wall St., you agree to have them published anonymously on a673b.bigscoots-temp.com.
By submitting your story, you understand and agree that we may use your story, or versions of it, in all media and platforms, including via third parties.
Thank you for reading! Have some feedback for us?
Contact the 24/7 Wall St. editorial team.
 24/7 Wall St.
