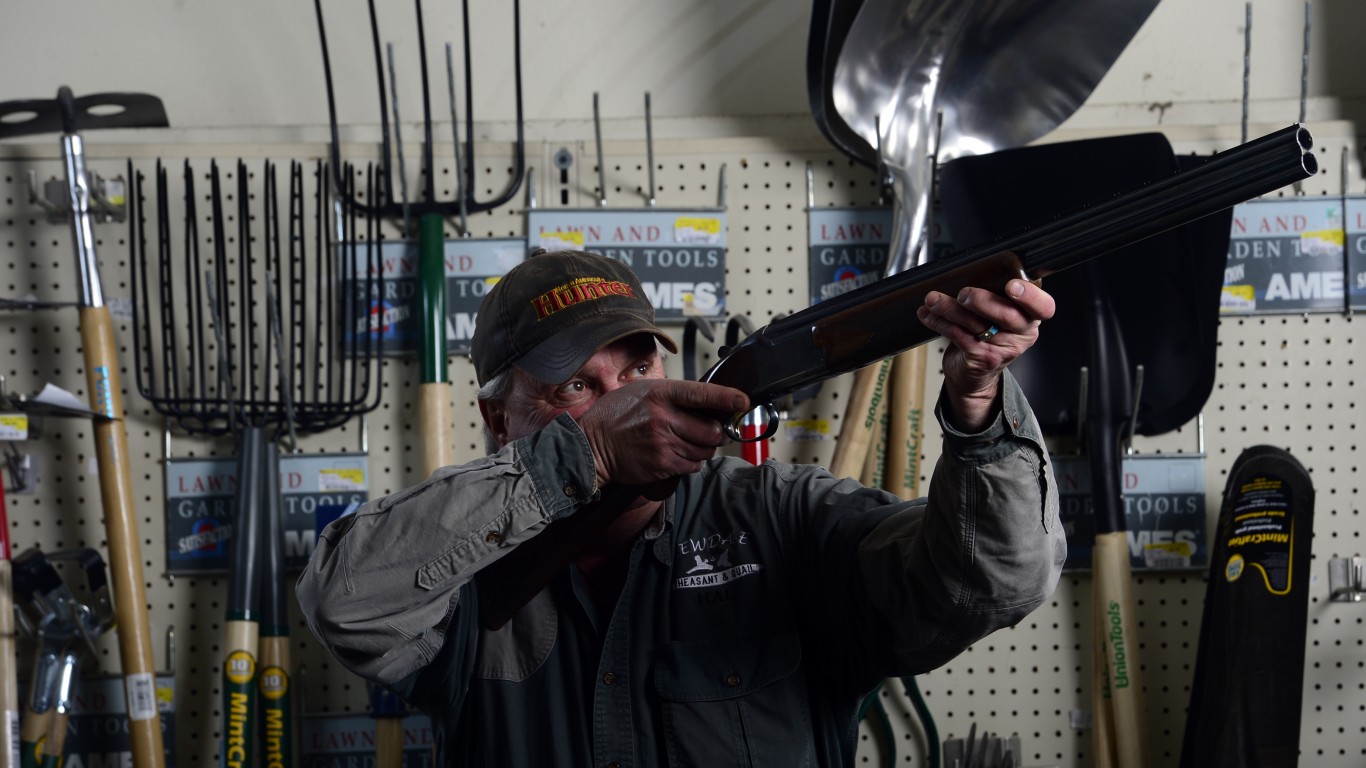
An estimated 46% of Americans have a gun in their home or elsewhere on their property, according to a recent poll. This figure, part of an annual survey conducted by polling agency Gallup, has been relatively steady for about two decades, and well below the 54% share in a 1993 poll. The survey also shows that 33% of Americans personally own a gun.
Of course, gun ownership and the presence of firearms in the household vary considerably across different demographic groups, regions, income levels, and other categories. There is one category where two-thirds of members live in a household with a gun, and another where less than one-third do.
24/7 Wall St. reviewed a recent poll conducted by polling agency Gallup, titled: Household Gun Ownership in U.S. Among Subgroups. The poll asked those surveyed if they personally owned a gun or if they were a member of a household with a gun. The respondents were grouped into several different categories, including gender, political party affiliation, age, region, household income, and type of community.
One of the categories with the biggest differences in gun ownership rates is region. In the East, 22% of people personally own a gun, whereas in the South, 44% do. The reasons for this difference are cultural and political. In many states in the South, for example, there are more registered Republicans, the leading indicator for gun ownership. Another reason likely has to do with the differences in gun ownership laws. (Here are the states with the loosest gun laws.)
Click here to see which Americans own the most guns.

Gender: Female
> Percent who personally own gun: 21% — #17 out of 18 categories
> Percent in household with gun: 41% — #12 out of 18 categories
[in-text-ad]

Gender: Male
> Percent who personally own gun: 46% — #3 out of 18 categories
> Percent in household with gun: 51% — #5 out of 18 categories
Party affiliation: Democrat
> Percent who personally own gun: 20% — #18 out of 18 categories
> Percent in household with gun: 31% — #18 out of 18 categories
Party affiliation: Independent
> Percent who personally own gun: 32% — #11 out of 18 categories
> Percent in household with gun: 42% — #11 out of 18 categories
[in-text-ad-2]

Party affiliation: Republican
> Percent who personally own gun: 48% — #1 out of 18 categories
> Percent in household with gun: 66% — #1 out of 18 categories

Age: 18-34
> Percent who personally own gun: 26% — #13 out of 18 categories
> Percent in household with gun: 39% — #13 out of 18 categories
[in-text-ad]

Age: 55 and older
> Percent who personally own gun: 35% — tied, #8 out of 18 categories
> Percent in household with gun: 49% — #7 out of 18 categories

Age: 35-54
> Percent who personally own gun: 38% — #6 out of 18 categories
> Percent in household with gun: 50% — #6 out of 18 categories

Region: East
> Percent who personally own gun: 22% — #15 out of 18 categories
> Percent in household with gun: 32% — #17 out of 18 categories
[in-text-ad-2]

Region: West
> Percent who personally own gun: 27% — #12 out of 18 categories
> Percent in household with gun: 38% — #14 out of 18 categories

Region: Midwest
> Percent who personally own gun: 35% — tied, #8 out of 18 categories
> Percent in household with gun: 48% — #8 out of 18 categories
[in-text-ad]

Region: South
> Percent who personally own gun: 44% — #4 out of 18 categories
> Percent in household with gun: 59% — #4 out of 18 categories

Annual household income: Less than $40,000
> Percent who personally own gun: 22% — #15 out of 18 categories
> Percent in household with gun: 33% — #15 out of 18 categories

Annual household income: $40,000-$99,999
> Percent who personally own gun: 35% — tied, #8 out of 18 categories
> Percent in household with gun: 47% — tied, #9 out of 18 categories
[in-text-ad-2]
Annual household income: $100,000 or more
> Percent who personally own gun: 47% — #2 out of 18 categories
> Percent in household with gun: 63% — #2 out of 18 categories

Type of community: Big/Small city
> Percent who personally own gun: 26% — #13 out of 18 categories
> Percent in household with gun: 33% — #15 out of 18 categories
[in-text-ad]

Type of community: Suburb of big/small city
> Percent who personally own gun: 36% — #7 out of 18 categories
> Percent in household with gun: 47% — tied, #9 out of 18 categories

Type of community: Town/Rural area
> Percent who personally own gun: 41% — #5 out of 18 categories
> Percent in household with gun: 62% — #3 out of 18 categories
Travel Cards Are Getting Too Good To Ignore (sponsored)
Credit card companies are pulling out all the stops, with the issuers are offering insane travel rewards and perks.
We’re talking huge sign-up bonuses, points on every purchase, and benefits like lounge access, travel credits, and free hotel nights. For travelers, these rewards can add up to thousands of dollars in flights, upgrades, and luxury experiences every year.
It’s like getting paid to travel — and it’s available to qualified borrowers who know where to look.
We’ve rounded up some of the best travel credit cards on the market. Click here to see the list. Don’t miss these offers — they won’t be this good forever.
Thank you for reading! Have some feedback for us?
Contact the 24/7 Wall St. editorial team.
 24/7 Wall St.
 24/7 Wall St.


