Special Report
Inflation Is Causing Food Prices to Skyrocket in These 13 Cities
Published:
Last Updated:

Food inflation continued to be one of the fastest-growing categories in the latest consumer price index summary from the Bureau of Labor Statistics. Food prices have increased 8.5% in the 12 months ended March, higher than most items other than energy services such as electricity and gas services and transportation services.
Food prices have risen so much that consumers have started to change their shopping habits. The New York Times reported in April that packaged food companies like PepsiCo, Unilever, and Coca Cola, have increased their prices to offset lower sales volumes, and that these price hikes have led to greater profits in the first quarter of the year. But these price increases are causing consumers to cut back on the purchase of foods manufactured by these companies.
Prices of food consumed away from home, such as at restaurants and theme parks, have risen by 8.8% in this period of time, and at home food prices have increased by 8.4%. These, however, are average prices for all urban consumers, and some cities contributed more to the increase in the food CPI than others. (See in more detail which items had prices that spiked the most compared to this time last year.)
To find the U.S. metropolitan areas with the highest food inflation, 24/7 Wall St. reviewed consumer price index data from the Bureau of Labor Statistics by geography. Notably, the BLS only has recent CPI data for 23 metro areas, and included here are the 13 metros where the increase in the food CPI was higher than the 8.5% increase nationwide. The food CPI for most metros is either for March or February 2023 and is compared to March or February 2022, respectively. All other data came from the Census Bureau 2021 American Community Survey.
In these 13 U.S. metropolitan areas, food inflation is at least 8.7%, as in the Dallas-Fort Worth area. In the St. Louis metro area of Missouri and Illinois, food prices rose 13.2% in March 2023 compared to March 2022.
In five of the 13 cities on the list, the poverty rate is higher than the national rate of 11.6%, led by the Houston area’s poverty rate of 14.1% and the Detroit area’s 13.4%. In seven others, however, the poverty rate is considerably lower than the rate nationwide, led by the Minneapolis’ area’s poverty rate of 8%. Similarly, 11 metro areas have a higher median income than the national median of $69,717, with two in the top 10 for median household income. (See if any of these cities are also among the most expensive city to live in every state.)
These 13 metropolitan areas are home to 62.6 million people, or nearly one in five people living in the United States.
Here are the U.S. metro areas with the highest food inflation.
Click here to see our detailed methodology.
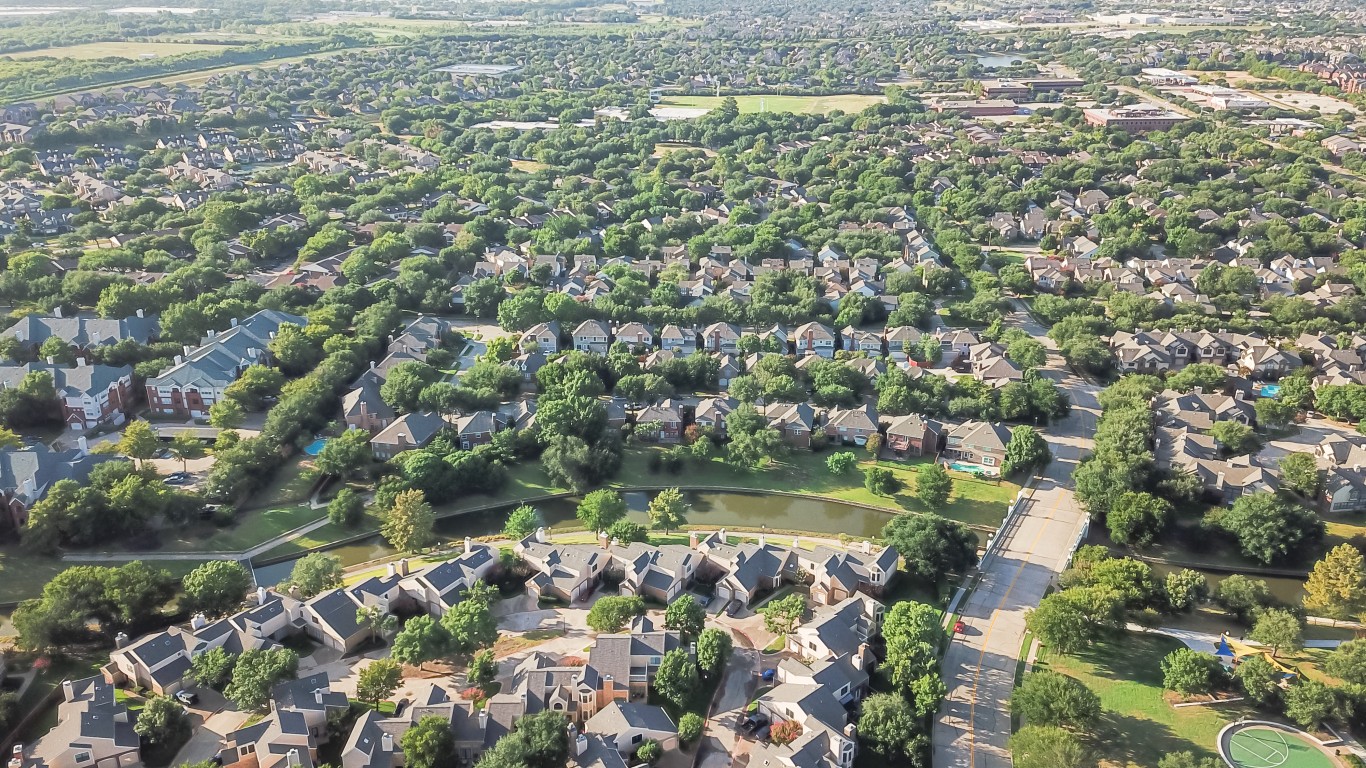
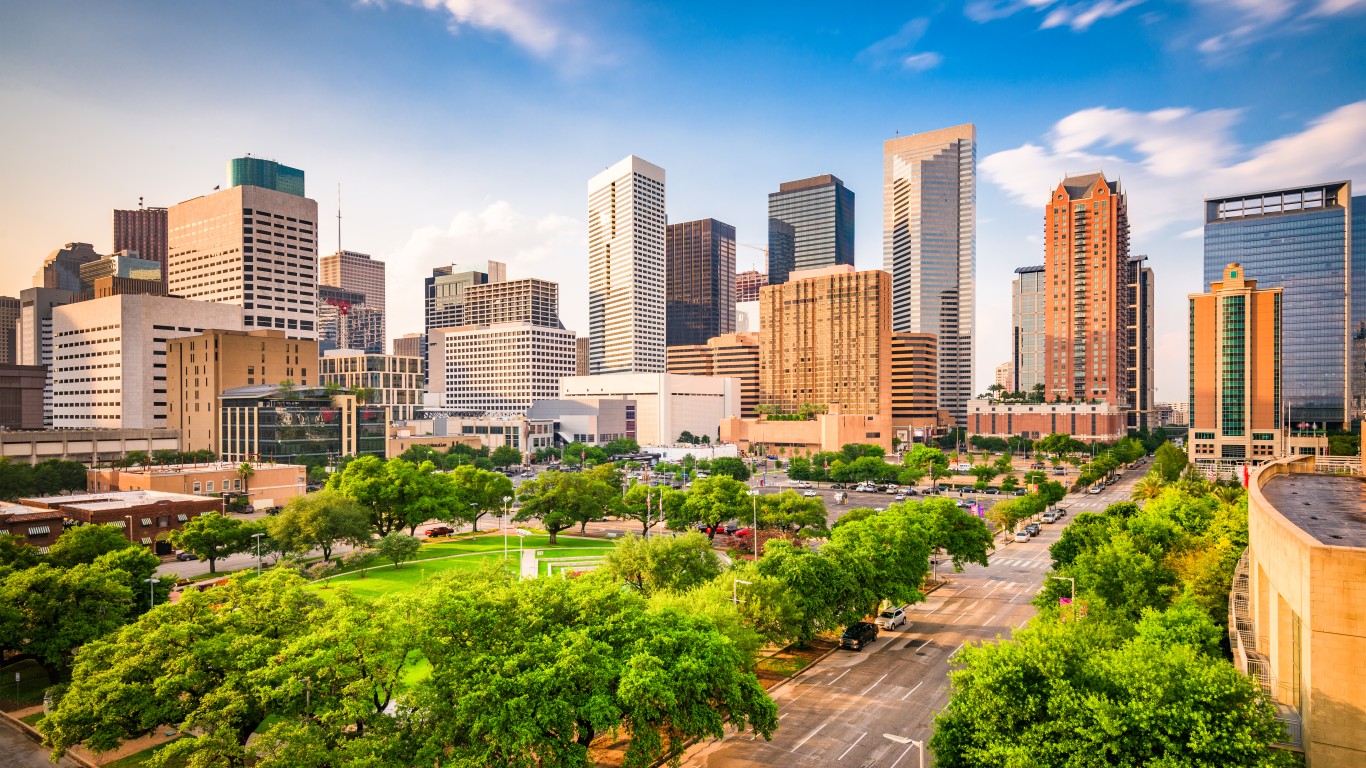
13. Dallas-Fort Worth-Arlington, TX
> Food CPI, March 23, YoY chg.: +8.7%
> Poverty rate, 2021: 11.0% – #105 lowest of 386 metros
> Median household income, 2021: $75,975 – #65 highest of 386 metros
> Population, 2021: 7,759,615 – #4 highest of 386 metros
[in-text-ad]
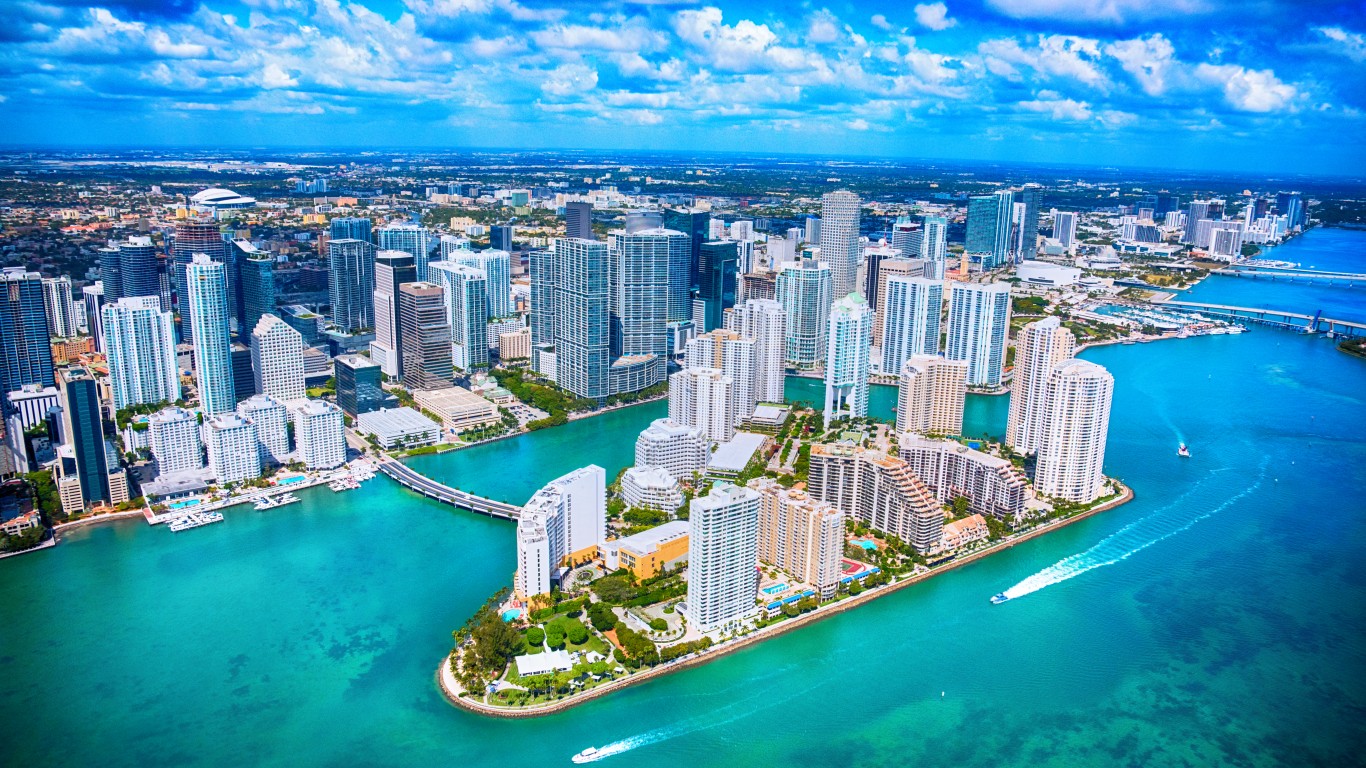
12. Miami-Fort Lauderdale-West Palm Beach, FL
> Food CPI, Dec 23, YoY chg.: +8.8%
> Poverty rate, 2021: 13.3% – #175 highest of 386 metros
> Median household income, 2021: $63,814 – #173 highest of 386 metros
> Population, 2021: 6,091,747 – #9 highest of 386 metros
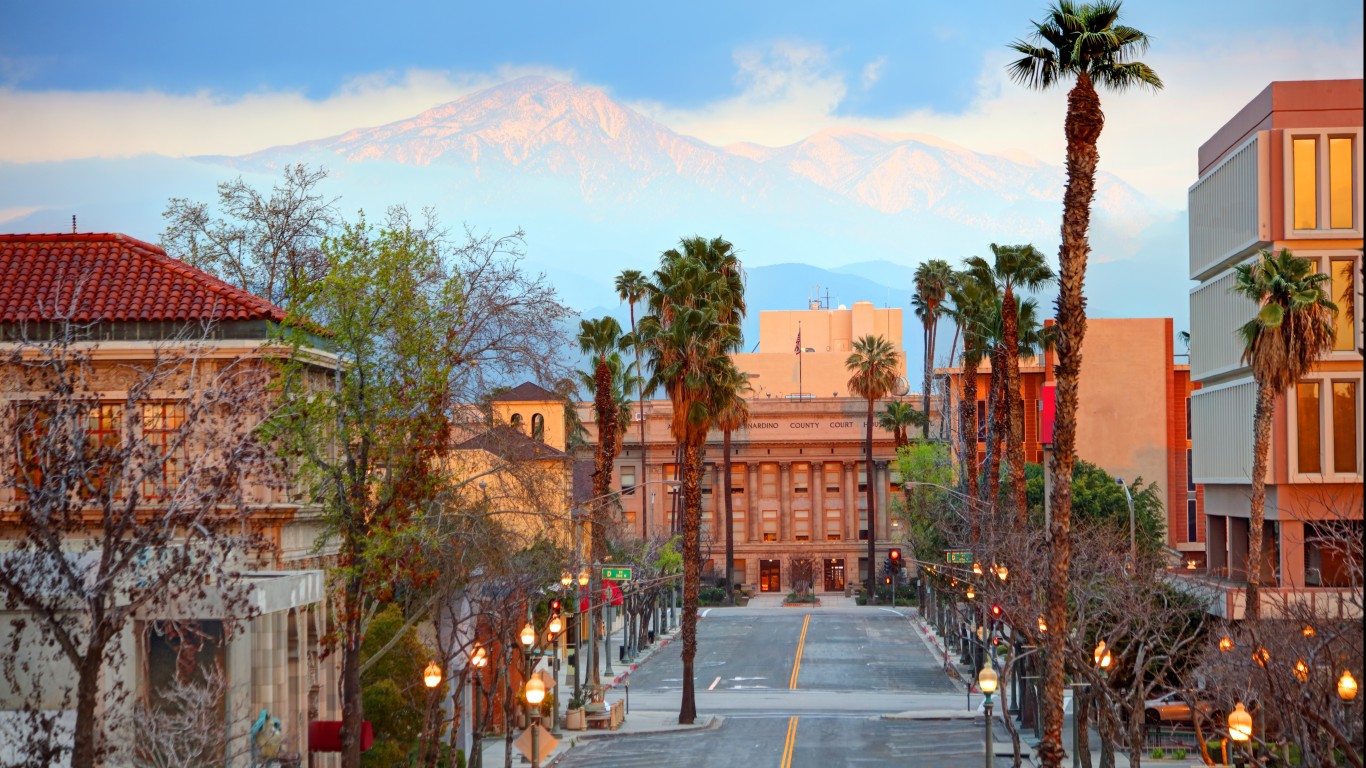
11. Riverside-San Bernardino-Ontario, CA
> Food CPI, March 23, YoY chg.: +8.9%
> Poverty rate, 2021: 12.3% – #168 lowest of 386 metros
> Median household income, 2021: $77,018 – #59 highest of 386 metros
> Population, 2021: 4,653,105 – #12 highest of 386 metros

10. Boston-Cambridge-Newton, MA-NH
> Food CPI, March 23, YoY chg.: +9.2%
> Poverty rate, 2021: 9.3% – #47 lowest of 386 metros
> Median household income, 2021: $100,750 – #7 highest of 386 metros
> Population, 2021: 4,899,932 – #11 highest of 386 metros
[in-text-ad-2]
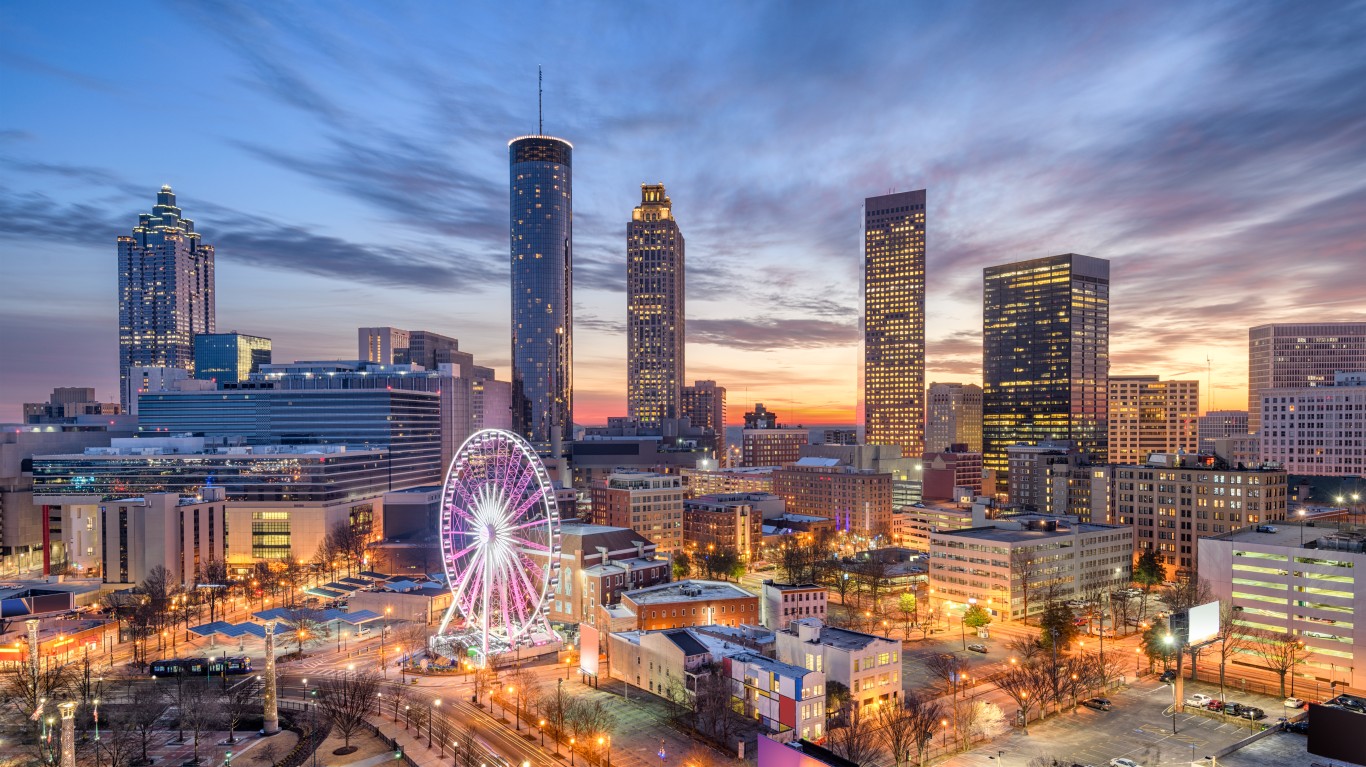
9. Atlanta-Sandy Springs-Roswell, GA
> Food CPI, Feb 23, YoY chg.: +9.4%
> Poverty rate, 2021: 11.6% – #131 lowest of 386 metros
> Median household income, 2021: $77,589 – #58 highest of 386 metros
> Population, 2021: 6,144,970 – #8 highest of 386 metros
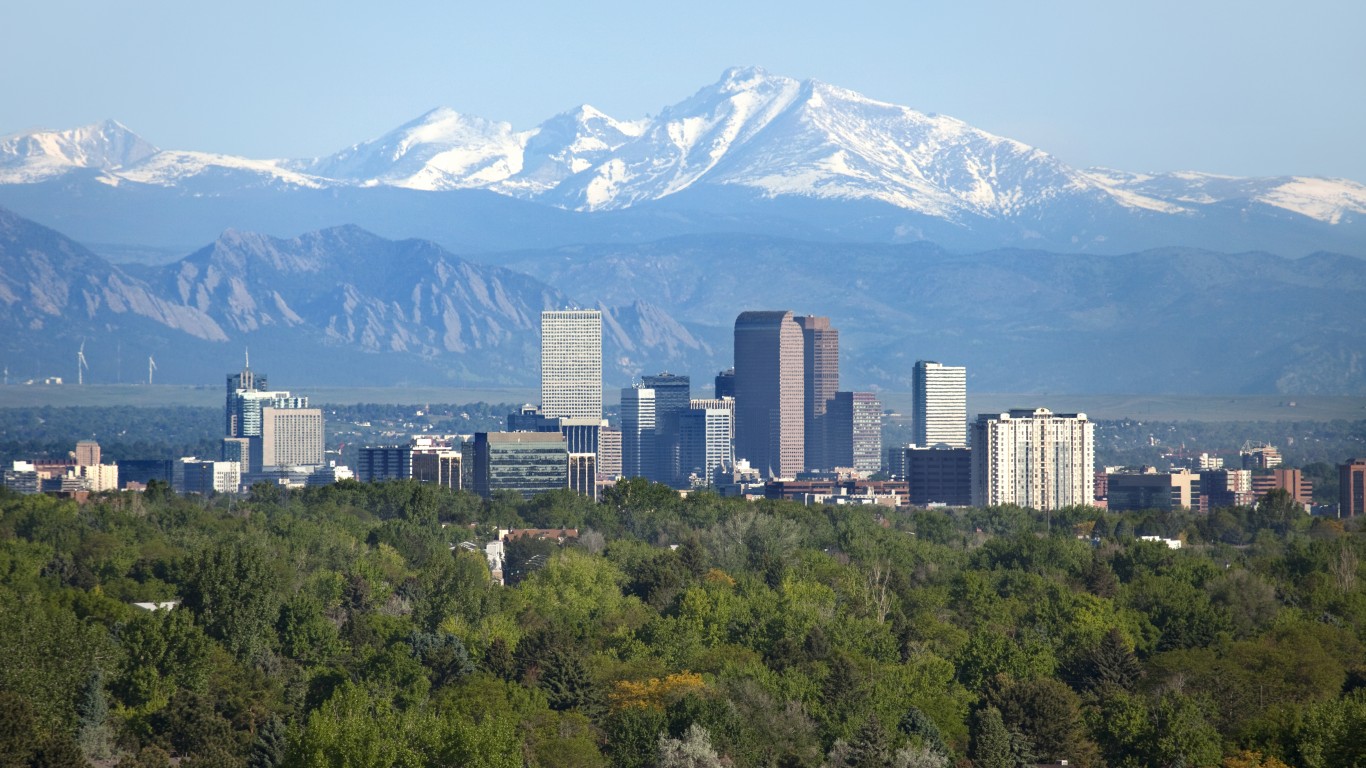
8. Denver-Aurora-Lakewood, CO
> Food CPI, March 23, YoY chg.: +9.7%
> Poverty rate, 2021: 8.4% – #22 lowest of 386 metros
> Median household income, 2021: $90,716 – #14 highest of 386 metros
> Population, 2021: 2,972,567 – #19 highest of 386 metros
[in-text-ad]
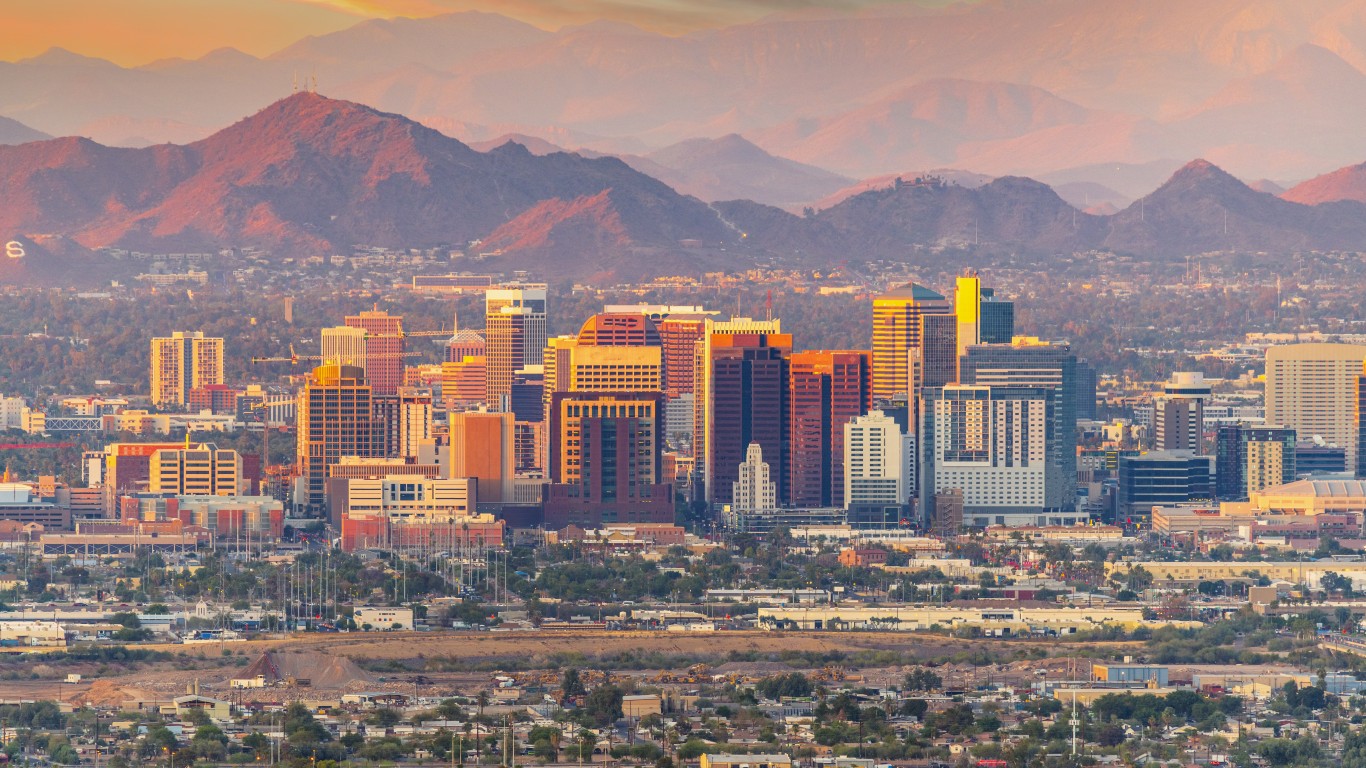
7. Phoenix-Mesa-Scottsdale, AZ
> Food CPI, Feb 23, YoY chg.: +10.1%
> Poverty rate, 2021: 11.1% – #108 lowest of 386 metros
> Median household income, 2021: $75,731 – #67 highest of 386 metros
> Population, 2021: 4,946,145 – #10 highest of 386 metros
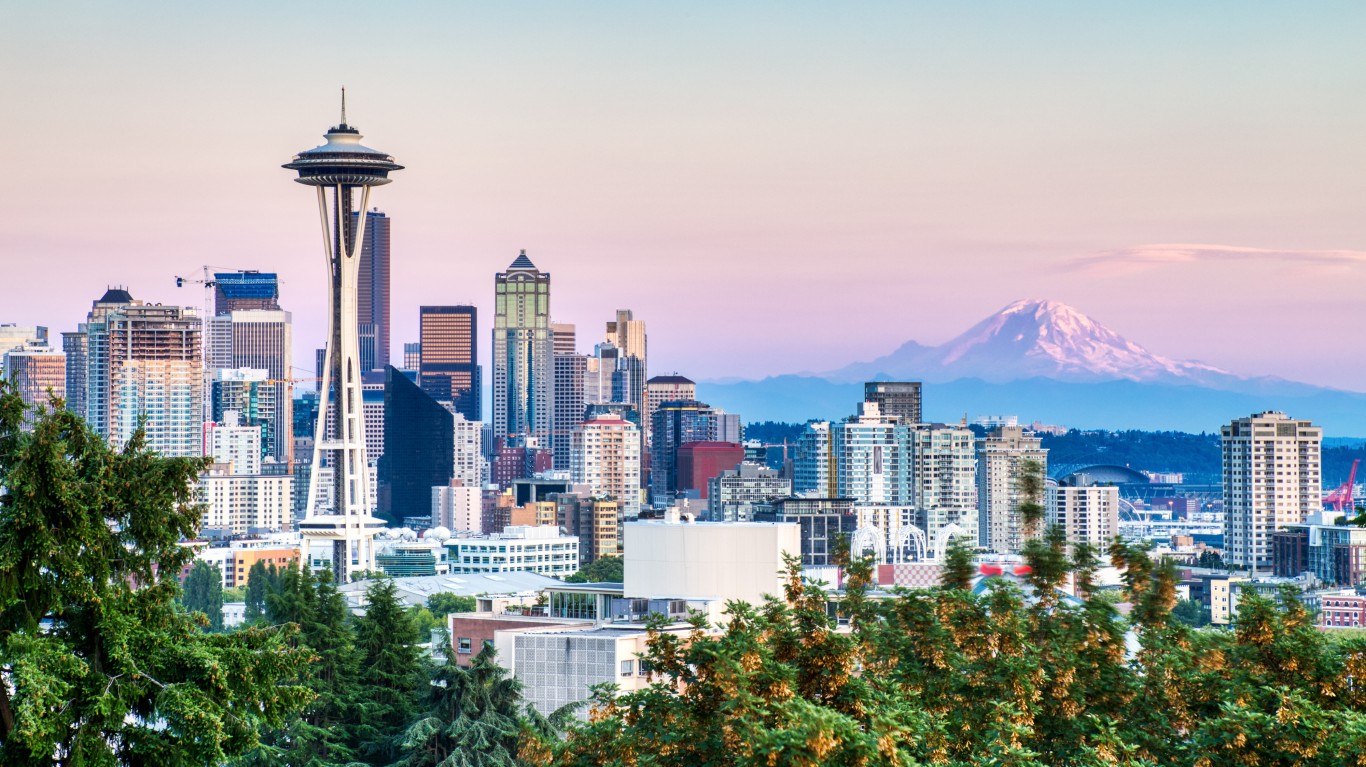
6. Seattle-Tacoma-Bellevue, WA
> Food CPI, Feb 23, YoY chg.: +10.4%
> Poverty rate, 2021: 8.6% – #26 lowest of 386 metros
> Median household income, 2021: $101,721 – #5 highest of 386 metros
> Population, 2021: 4,011,553 – #15 highest of 386 metros
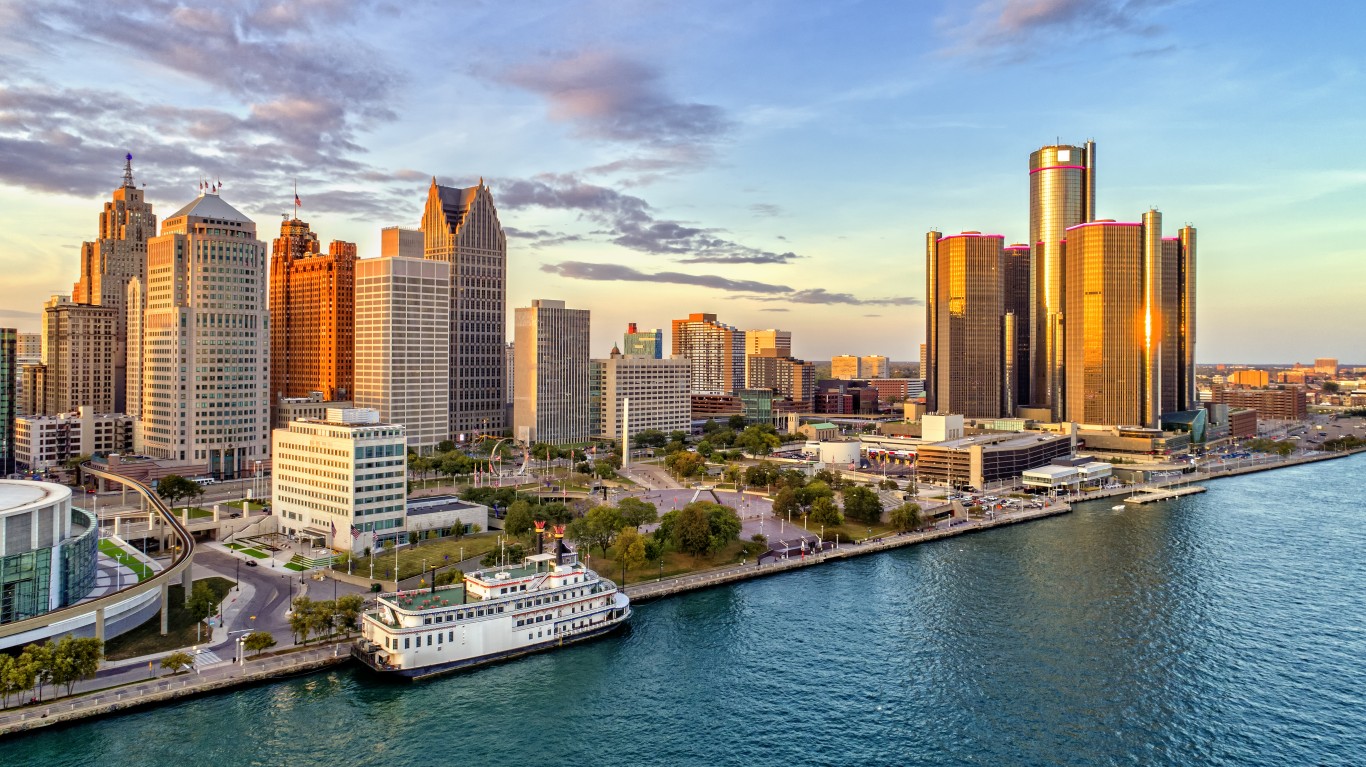
5. Detroit-Warren-Dearborn, MI
> Food CPI, Feb 23, YoY chg.: +10.5%
> Poverty rate, 2021: 13.4% – #174 highest of 386 metros
> Median household income, 2021: $67,153 – #124 highest of 386 metros
> Population, 2021: 4,365,205 – #14 highest of 386 metros
[in-text-ad-2]

4. Philadelphia-Camden-Wilmington, PA-NJ-DE-MD
> Food CPI, Feb 23, YoY chg.: +10.9%
> Poverty rate, 2021: 12.3% – #166 lowest of 386 metros
> Median household income, 2021: $80,007 – #45 highest of 386 metros
> Population, 2021: 6,228,601 – #7 highest of 386 metros

3. Houston-The Woodlands-Sugar Land, TX
> Food CPI, Feb 23, YoY chg.: +11.1%
> Poverty rate, 2021: 14.1% – #143 highest of 386 metros
> Median household income, 2021: $70,893 – #100 highest of 386 metros
> Population, 2021: 7,206,841 – #5 highest of 386 metros
[in-text-ad]

2. Minneapolis-St. Paul-Bloomington, MN-WI
> Food CPI, March 23, YoY chg.: +11.3%
> Poverty rate, 2021: 8.0% – #19 lowest of 386 metros
> Median household income, 2021: $87,433 – #20 highest of 386 metros
> Population, 2021: 3,690,512 – #16 highest of 386 metros

1. St. Louis, MO-IL
> Food CPI, Feb 23, YoY chg.: +13.2%
> Poverty rate, 2021: 10.6% – #90 lowest of 386 metros
> Median household income, 2021: $70,189 – #105 highest of 386 metros
> Population, 2021: 2,806,615 – #21 highest of 386 metros
Methodology
To find the U.S. metropolitan areas with the highest food inflation, 24/7 Wall St. reviewed consumer price index data from the Bureau of Labor Statistics by geography. The BLS only has recent CPI data for 23 metro areas and included here are the 13 metros where the increase in the food CPI was higher than the 8.5% increase nationwide. The food CPI is either for March or February 2023 and is compared to March or February 2022, respectively. Only the Miami area figures are for December 2022. All other data came from the Census Bureau 2021 American Community Survey.
Three metro areas are slightly different in the BLS and the ACS – Atlanta-Sandy Springs-Roswell, GA in the BLS vs Atlanta-Sandy Springs-Alpharetta, GA in the ACS; Phoenix-Mesa-Scottsdale, AZ vs Phoenix-Mesa-Chandler, AZ; and Miami-Fort Lauderdale-West Palm Beach, FL vs Miami-Fort Lauderdale-Pompano Beach, FL.
If you’re one of the over 4 Million Americans set to retire this year, you may want to pay attention.
Finding a financial advisor who puts your interest first can be the difference between a rich retirement and barely getting by, and today it’s easier than ever. SmartAsset’s free tool matches you with up to three fiduciary financial advisors that serve your area in minutes. Each advisor has been carefully vetted, and must act in your best interests. Start your search now.
Don’t waste another minute; get started right here and help your retirement dreams become a retirement reality.
Thank you for reading! Have some feedback for us?
Contact the 24/7 Wall St. editorial team.