Special Report
The National Debt Under Every US President in the Last 100 Years
Published:
Last Updated:

The United States government is on the brink of defaulting on its debt. Since surpassing its $31.4 trillion borrowing cap in January 2023, the federal government has remained solvent through extraordinary measures enacted by the Treasury Department. The efficacy of these measures have a rapidly approaching expiration date, as early as June 1, 2023 by some estimates, and pressure is mounting for Congress and the White House to reach a deal and raise the debt ceiling – a prospect that remains allusive in an era of divided government. (Here is a look at America’s most politically divided cities.)
The current debt crisis is not only the result of political brinkmanship, but also of decades of deficit spending across multiple administrations. In the last 22 years alone, the national debt has expanded by 445%, as the wars in Iraq and Afghanistan, the ongoing War on Terror, and the COVID-19 pandemic sent government spending soaring. At the same time, tax cuts and three economic recessions have reduced tax revenue, forcing the government to pay its bills with borrowed money.
With the threat of a debt-ceiling crisis looming large, 24/7 Wall St. reviewed how the national debt changed under each U.S. president in the last 100 years using data on total government debt (unadjusted for inflation) each year since 1923 from the U.S. Treasury Department. The 17 presidents – from Calvin Coolidge to Joe Biden – are listed in chronological order along with the national debt at the end of their first and last fiscal years in office.
The last time the federal government had a balanced budget – when revenue exceeded spending – was in 2000, under the Clinton Administration. That year, the national debt stood at $5.8 trillion, or about 55% of the U.S. gross domestic product at the time. As of the end of fiscal 2022, the national debt amounted to about 120% of current GDP.
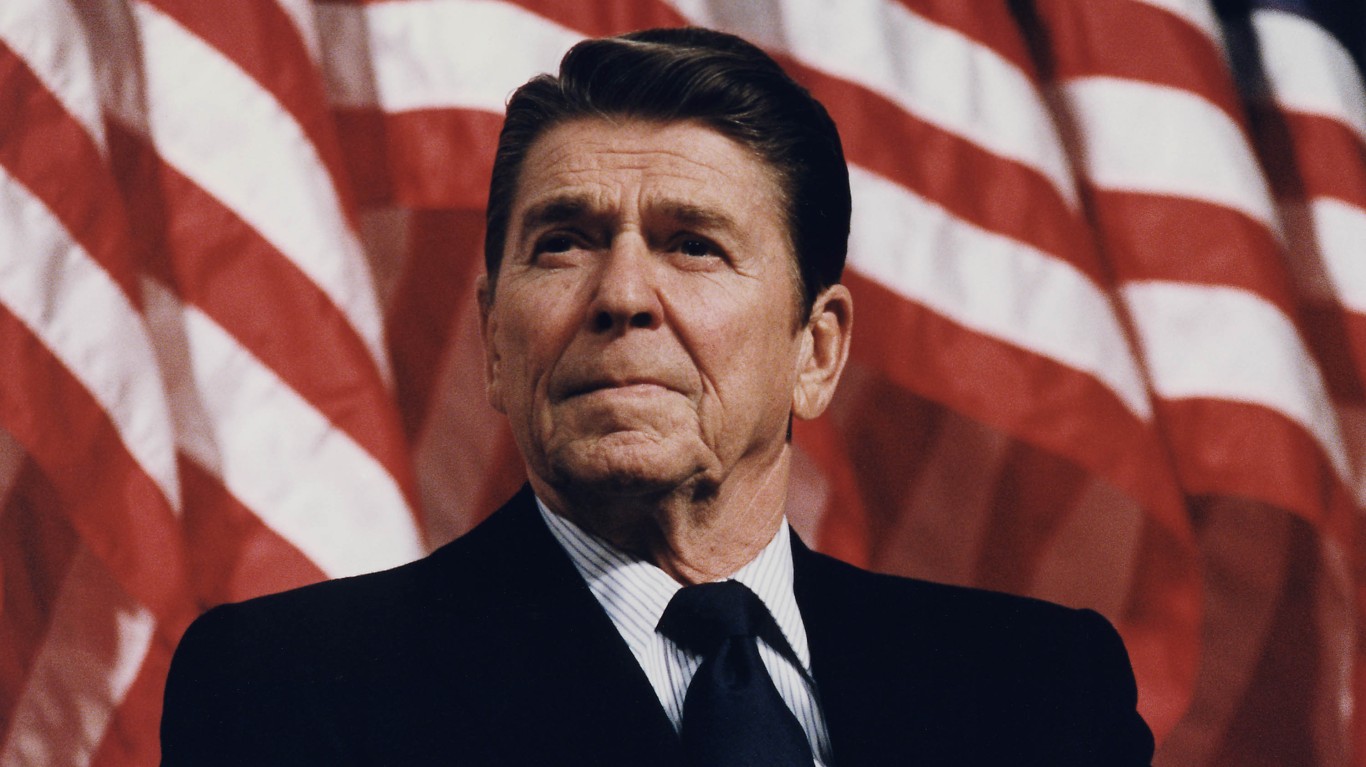
The first U.S. president to increase the national debt by over a trillion dollars during his time in office was Ronald Reagan. During the Reagan Administration, the national debt expanded by 186%, the largest relative increase since Franklin Roosevelt, who raised government spending to fight World War II and bring the country out of the Great Depression. In dollar terms, the national debt increased the most under President Barack Obama and President Donald Trump, who oversaw increases of $8.3 trillion and $8.2 trillion, respectively, during their time in office. (Here is a look at each president’s path to the oval office.)
It is important to note that presidents have only limited control over the national debt while they are in office. Factors outside the control of the White House, including macroeconomic circumstances, geopolitical crises, global pandemics, and laws set by previous administrations all impact government spending and revenue.
Click here to see the national debt under every administration since WW2.
Click here to see our detailed methodology.

Calvin Coolidge (1923-1929)
> Change in national debt during presidency: -24.2% (-$5.4 billion)
> Total federal debt first year in office: $22.3 billion
> Total federal debt final year in office: $16.9 billion (16.2% of GDP)
> Party affiliation: Republican
The U.S. debt fell by 24.2%, or $5.4 billion, from the beginning of fiscal 1923 to the end of fiscal 1929, the years spanning Calvin Coolidge’s presidency. A rapidly-growing economy in the wake of World War I, in addition to limited spending, allowed Coolidge to reduce the federal debt even while cutting taxes.
However, economic growth and deregulation under Coolidge also brought growing inequality and worsening economic hardship for American farmers — factors that contributed to the stock market crash of 1929 and the Great Depression, according to some economists.
[in-text-ad]
Herbert Hoover (1929-1933)
> Change in national debt during presidency: +33.1% (+$5.6 billion)
> Total federal debt first year in office: $16.9 billion (16.2% of GDP)
> Total federal debt final year in office: $22.5 billion (39.4% of GDP)
> Party affiliation: Republican
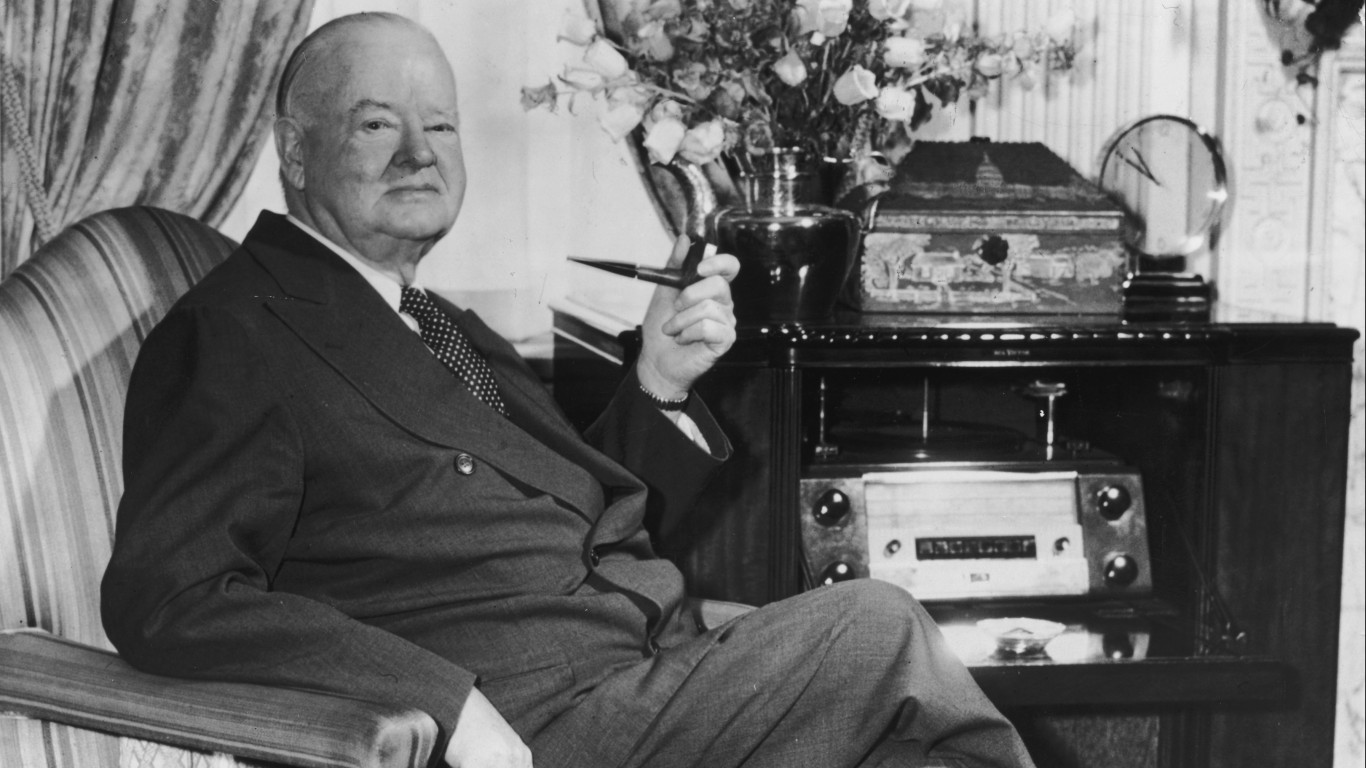
Less than a year after Herbert Hoover took office, in 1929, the stock market crashed, and the country entered the Great Depression. Though initially committed to maintaining a balanced budget, Hoover reduced taxes and increased public spending in an attempt to blunt the effects of the depression.
Much of the groundwork for the Great Depression was laid by Hoover’s predecessor, Coolidge. Still, Hoover bore the blame and was not elected to a second term. During Hoover’s time in office, the U.S. debt climbed by 33.1% from $16.9 billion to $22.5 billion.
Franklin D. Roosevelt (1933-1945)
> Change in national debt during presidency: +1,047.7% (+$236.1 billion)
> Total federal debt first year in office: $22.5 billion (39.4% of GDP)
> Total federal debt final year in office: $258.7 billion (113.5% of GDP)
> Party affiliation: Democratic
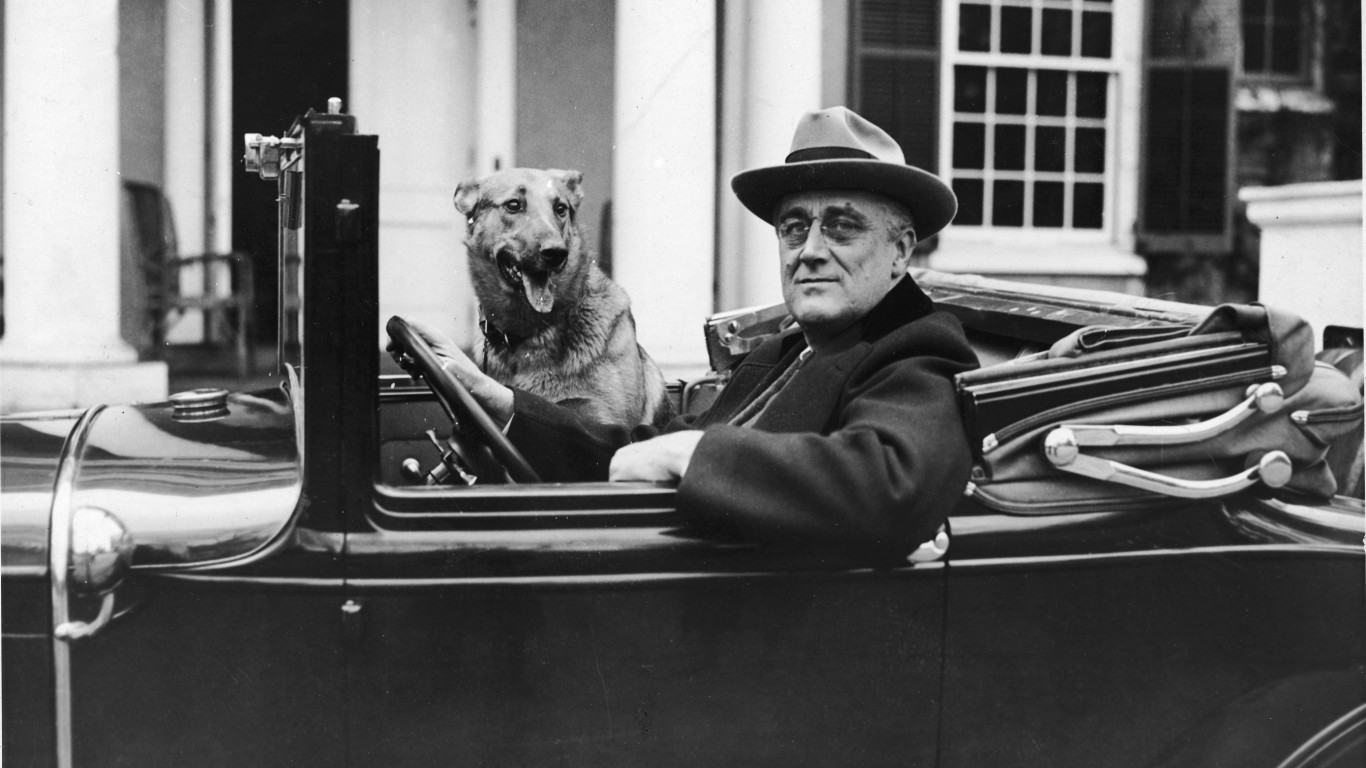
Franklin Roosevelt served as president of the United States for 12 years, longer than any other president in history. Leading the country through the Great Depression and World War II, FDR’s presidency also spanned some of the most trying times in U.S. history.
To address the economic crisis at home, Roosevelt enacted a set of progressive policies designed to restore growth and prosperity known as the New Deal. Components of the New Deal that remain intact today include Social Security, the Tennessee Valley Authority, unemployment insurance, and agricultural subsidies. While each of these progressive policies came with steep costs, WWII was by far the largest contributor to the national debt. During the fiscal years spanning Roosevelt’s time in office, the federal debt increased by 1,047%, or $236.1 billion.
Harry S. Truman (1945-1953)
> Change in national debt during presidency: +2.9% (+$7.4 billion)
> Total federal debt first year in office: $258.7 billion (113.5% of GDP)
> Total federal debt final year in office: $266.1 billion (68.4% of GDP)
> Party affiliation: Democratic
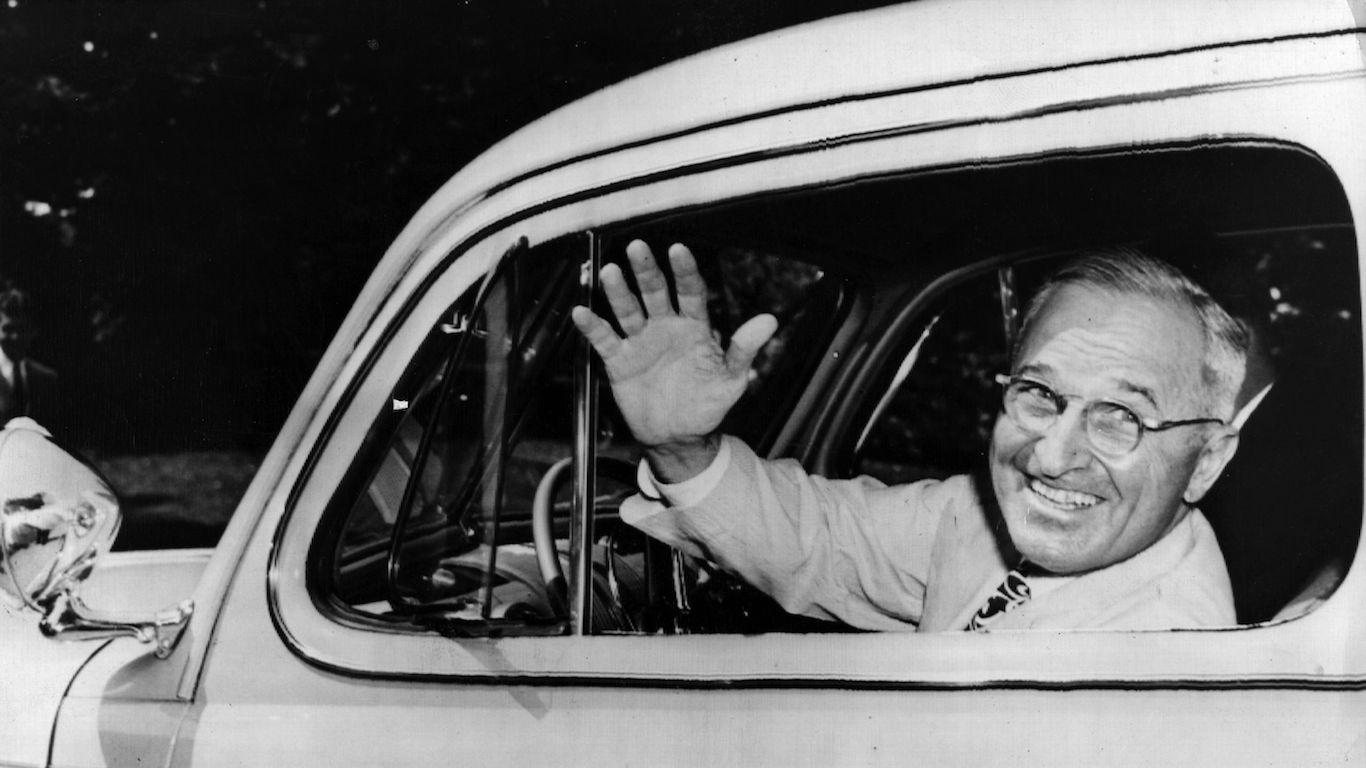
Serving as vice president for only a few short months before Roosevelt died in office, Harry Truman took the oath of office on April 12, 1945, becoming the 33rd president of the United States. Presiding over Japan’s surrender and the end of WWII, Truman was tasked with transitioning the country to a peacetime economy in the face of organized labor strikes, rapid inflation, and congressional opposition to his progressive agenda. During Truman’s first full year in office, U.S. GDP fell by 11.6%, as the economy suddenly contracted after the war.
With the goal of balancing the federal budget, Truman increased taxes and minimized spending — policies that were ultimately tweaked following a period of economic stagnation. The outbreak of the Korean War in 1950 also led to increased government spending and strong economic growth. Overall, U.S. debt climbed by 2.9%, or $7.4 billion, over the years of the Truman Administration — the smallest increase under any president in the last 100 years.
[in-text-ad-2]

Dwight Eisenhower (1953-1961)
> Change in national debt during presidency: +8.6% (+$22.9 billion)
> Total federal debt first year in office: $266.1 billion (68.4% of GDP)
> Total federal debt final year in office: $289.0 billion (51.4% of GDP)
> Party affiliation: Republican
Though he was a conservative president and prioritized a balanced budget, Dwight Eisenhower resisted pressure from the right to cut taxes while not shying away from investing in the country’s future. During his presidency, Eisenhower built the St. Lawrence Seaway, started NASA, and most famously created the Interstate Highway system — investing $119 billion in the construction of 41,000 miles of roadway.
In addition, Eisenhower expanded Social Security, increased the minimum wage, and created the Departments of Health, Education, and Welfare. Even with these investments, federal spending as a share of GDP fell during Eisenhower’s presidency — an accomplishment no president since can claim. Still, the national debt increased during his presidency.

John F. Kennedy (1961-1963)
> Change in national debt during presidency: +5.8% (+$16.9 billion)
> Total federal debt first year in office: $289.0 billion (51.4% of GDP)
> Total federal debt final year in office: $305.9 billion (48.0% of GDP)
> Party affiliation: Democratic
John F. Kennedy’s presidency was short and tumultuous. From Jan. 20, 1961, the day he was sworn in, to Nov. 22, 1963, the day he was assassinated, Kennedy’s time in office was defined not only by escalating Cold War tensions, but also by an ambitious domestic agenda.
Taking office at a time of rising unemployment, falling corporate profits, and a stagnating stock market, JFK prioritized economic revitalization. Not only did he expand Social Security and unemployment benefits, increase the minimum wage, and invest in infrastructure, but he also pushed for reduced taxes, insisting that “a rising tide lifts all boats.” Though his tax cuts did not receive congressional approval until three months after his assassination, Kennedy’s policies led to a reduced federal deficit and strong returns on Wall Street. U.S. debt climbed by a relatively marginal 5.8% from fiscal 1961 to fiscal 1963.
[in-text-ad]
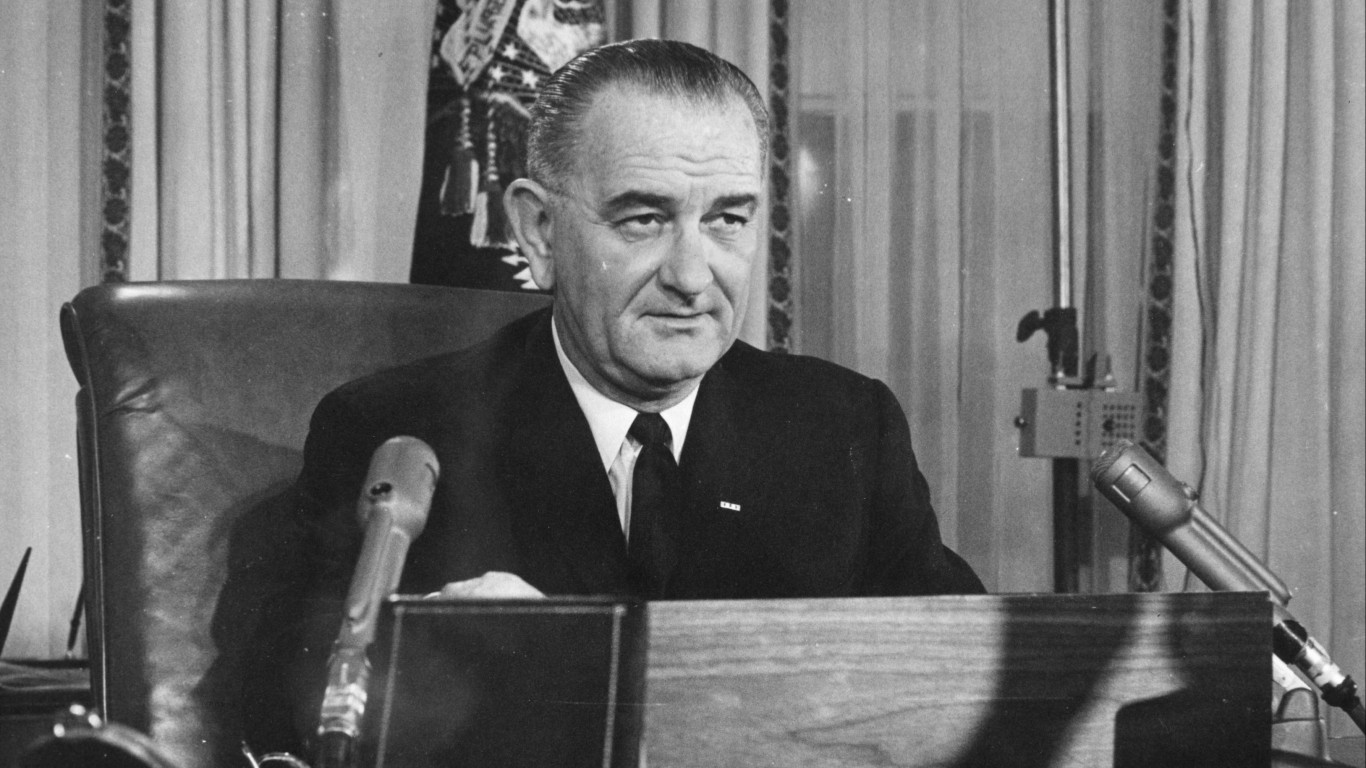
Lyndon Johnson (1963-1969)
> Change in national debt during presidency: +15.7% (+$47.9 billion)
> Total federal debt first year in office: $305.9 billion (48.0% of GDP)
> Total federal debt final year in office: $353.7 billion (34.8% of GDP)
> Party affiliation: Democratic
Taking office following the assassination of John F. Kennedy and winning in a landslide election the following year, Lyndon Johnson claimed a mandate for his “Great Society” agenda. The list of new programs and initiatives under Johson included the National Endowment for the Arts, the Highway Safety Act, the Public Broadcasting Act, Medicare and Medicaid, consumer protections, the Civil Rights Act, and the Voting Rights Act.
Economic growth was strong during Johnson’s presidency, ranging between 2.7% to 6.6% annually. Despite the rapid expansion in the role of government — and a ramp up of combat operations in Vietnam — U.S. debt grew by 15.7% over the years Johnson was in the White House, a smaller increase than during most presidents’ time in office in the 20th and 21st century.
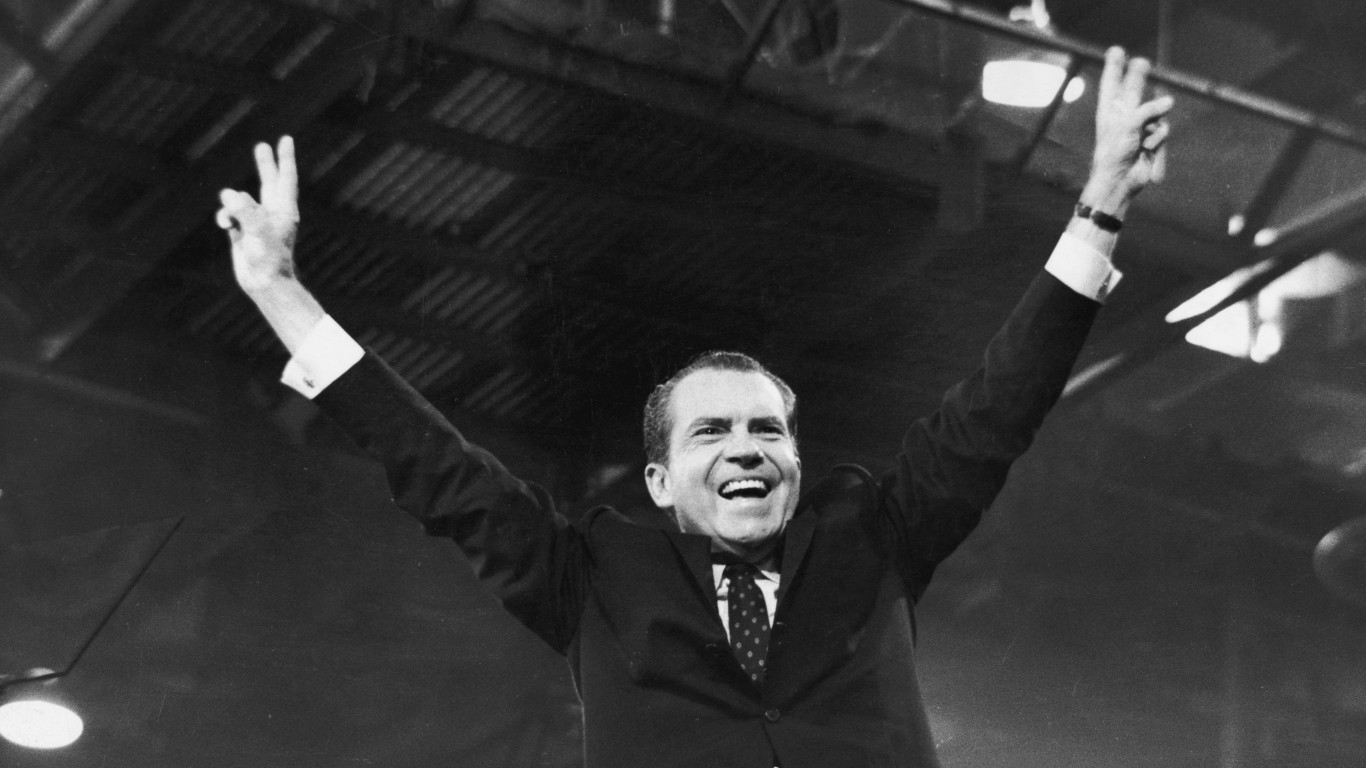
Richard Nixon (1969-1974)
> Change in national debt during presidency: +34.3% (+$121.3 billion)
> Total federal debt first year in office: $353.7 billion (34.8% of GDP)
> Total federal debt final year in office: $475.1 billion (30.7% of GDP)
> Party affiliation: Republican
President Richard Nixon faced some of the most daunting economic challenges the country had faced in decades. With inflation and unemployment rising in his second year, Nixon reversed course on an earlier strategy and announced a wage and price freeze, tax cuts, and a 10% import tax.
These policies temporarily turned the economy around, but the recovery was short lived. By the time Nixon stepped down amid the Watergate scandal, the stock market was crashing and unemployment and inflation were soaring. During his time in office, Nixon continued funding a war in Vietnam and used the federal government to address certain problems, creating the Occupational Safety and Health Administration and the Environmental Protection Agency. Over Nixon’s years in office, the federal debt increased by 34.3%, or $121.3 billion.
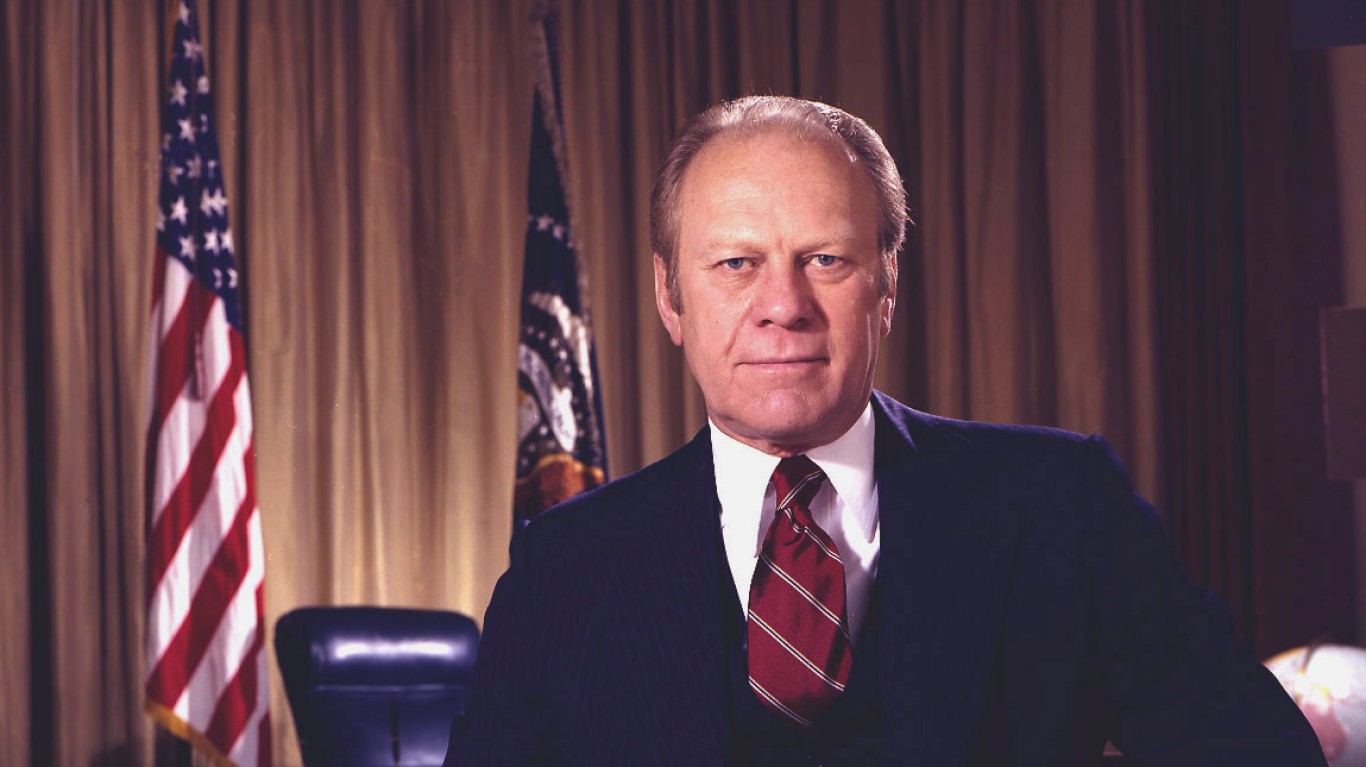
Gerald Ford (1974-1977)
> Change in national debt during presidency: +47.1% (+$223.8 billion)
> Total federal debt first year in office: $475.1 billion (30.7% of GDP)
> Total federal debt final year in office: $698.8 billion (33.6% of GDP)
> Party affiliation: Republican
Vice President Gerald Ford moved into the Oval Office following the Watergate Scandal and the subsequent resignation of Nixon. Inheriting an economy suffering from stagflation — slow growth, high inflation, and high unemployment — Ford was able to successfully restore growth and jobs through deregulation and tax cuts. Inflation remained high, however.
During Ford’s tenure, New York City was facing a budget crisis, nearly going bankrupt. In a reversal of an earlier non-interventionist position, Ford authorized $2.3 billion in federal loans to the city. Still, minimal spending was a cornerstone of the Ford administration. With the goal of limiting the federal deficit, Ford vetoed multiple appropriations bills that came across his desk.
[in-text-ad-2]

Jimmy Carter (1977-1981)
> Change in national debt during presidency: +42.8% (+$299.0 billion)
> Total federal debt first year in office: $698.8 billion (33.6% of GDP)
> Total federal debt final year in office: $997.9 billion (31.1% of GDP)
> Party affiliation: Democratic
Jimmy Carter’s term in the Oval Office was marked by multiple economic hurdles that carried over from the Nixon-Ford era and were compounded by rising energy prices due in part to OPEC policies. Carter faced near record-high inflation at a time when unemployment was also approaching all-time highs. The Iranian hostage crisis of 1979 and resulting international tensions contributed to a 0.3% economic contraction in 1980, Carter’s final full-year in office.
Though he reduced the federal deficit as a share of gross domestic product, the national debt overall climbed by $299 billion, or 42.8%, during Carter’s four years in office.

Ronald Reagan (1981-1989)
> Change in national debt during presidency: +186.4% (+$1.9 trillion)
> Total federal debt first year in office: $997.9 billion (31.1% of GDP)
> Total federal debt final year in office: $2.9 trillion (50.6% of GDP)
> Party affiliation: Republican
Though he was elected to office on a platform of tax cuts and reduced government spending, Ronald Reagan was the first American president in history to increase the country’s total debt by more than a trillion dollars. During the Reagan years, federal debt ballooned by 186.4%, from $997.9 billion to $2.9 trillion.
While Reagan did cut corporate income taxes, he increased payroll taxes — and while he marginally cut social welfare spending, he expanded defense spending considerably. Additionally, Reagan’s easing of banking regulations ultimately brought about the savings and loan crisis. Reagan era policies ushered in a period of strong economic expansion that peaked with a 7.2% annual GDP growth rate in 1984 — a high no American president has achieved since.
[in-text-ad]

George H. W. Bush (1989-1993)
> Change in national debt during presidency: +54.4% (+$1.6 trillion)
> Total federal debt first year in office: $2.9 trillion (50.6% of GDP)
> Total federal debt final year in office: $4.4 trillion (64.3% of GDP)
> Party affiliation: Republican
When President George H.W. Bush took office, reducing the federal deficit without raising taxes was a leading priority for his administration. As a result, he was limited in his willingness and ability to enact major new programs, opting instead to maintain the status quo left by the Reagan administration.
However, the savings and loan crisis led to a recession, reducing federal revenue. On top of that, to save the industry, the Bush White House issued a $100 billion bailout. Ultimately, in a move that many say cost him the 1992 election, Bush went back on his word and raised taxes to maintain a level of government revenue. During his single term in office, Bush added $1.6 trillion to the federal debt, a 54.4% increase.

William J. Clinton (1993-2001)
> Change in national debt during presidency: +31.6% (+$1.4 trillion)
> Total federal debt first year in office: $4.4 trillion (64.3% of GDP)
> Total federal debt final year in office: $5.8 trillion (54.9% of GDP)
> Party affiliation: Democratic
Bill Clinton’s two terms in the White House marked an era of unprecedented economic prosperity in the United States. Under the Clinton administration, unemployment hit its lowest level in decades, inflation declined to a 30-year low, and homeownership soared to all-time highs. Clinton also achieved a budget surplus in the four final fiscal years he held office.
Due in part to the budget surplus, the federal debt rose by 31.6% during the Clinton years, a far smaller increase than most presidents in the last century. Clinton’s ability to balance the budget for several years of his presidency was due in part to policies that raised taxes and cut spending programs. Rapid economic growth also led to a surge in tax revenue, as the U.S. economy expanded each year Clinton was in office, from between 2.7% to 4.8%, depending on the year.

George W. Bush (2001-2009)
> Change in national debt during presidency: +105.1% (+$6.1 trillion)
> Total federal debt first year in office: $5.8 trillion (54.9% of GDP)
> Total federal debt final year in office: $11.9 trillion (82.3% of GDP)
> Party affiliation: Republican
George W. Bush took the oath of office in January 2001, less than one year before the terrorist attacks of Sept. 11. The attacks ultimately led to the Bush administration’s war on terror and the creation of the U.S. Department of Homeland Security.
Bush’s economic initiatives began with a $1.35 trillion tax cut that was accompanied by an increase in entitlement and discretionary spending as well as massive military engagements in Afghanistan and the Middle East. More tax cuts followed in 2003 and 2006, ending the budgetary surpluses of the Clinton years. During the Bush presidency, government debt more than doubled from $5.8 trillion in 2001 to $11.9 trillion in 2009.
[in-text-ad-2]
Barack Obama (2009-2017)
> Change in national debt during presidency: +70.0% (+$8.3 trillion)
> Total federal debt first year in office: $11.9 trillion (82.3% of GDP)
> Total federal debt final year in office: $20.2 trillion (103.9% of GDP)
> Party affiliation: Democratic
No American president added more, monetarily, to the U.S. debt than Barack Obama. Over his eight years in office, the federal debt climbed by $8.3 trillion. However, in relative terms, the 70% debt increase during his administration was only the fourth largest in the last 100 years.
Obama took office in 2009, a time when the U.S. economy was in the midst of the Great Recession following the financial crisis that was triggered in 2007. At the time, unemployment soared, the housing market collapsed, the global economy was also in recession, and financial institutions were on the brink of failure. In addition to the $700 billion relief program authorized under the Bush administration, Obama passed another $800 billion stimulus package. After contracting 2.5% in 2009, the U.S. economy grew every year of Obama’s presidency. Major policy changes during the Obama years included Medicaid expansion, the Affordable Care Act, strengthened regulations on financial institutions, and the end of the Iraq War.

Donald J. Trump (2017-2021)
> Change in national debt during presidency: +40.4% (+$8.2 trillion)
> Total federal debt first year in office: $20.2 trillion (103.9% of GDP)
> Total federal debt final year in office: $28.4 trillion (121.9% of GDP)
> Party affiliation: Republican
Over Donald Trump’s single term in the White House, American debt increased by $8.2 trillion, a larger monetary increase than under any other president in U.S. history — with the exception of President Barack Obama, who was in office twice as long. Still, in relative terms, the national debt increase of 40.4% under Trump is close to the median among presidents in the last 100 years.
Trump-era economic policies were defined in large part by increases in defense and other spending, tax cuts, and a trade war with China. Under Trump, the federal government spent over $2 trillion to bolster the economy in the face of the COVID-19 pandemic in addition to previously budgeted spending.
[in-text-ad]
Joe Biden (2021-Present)
> Change in national debt during presidency: +8.8% (+$2.5 trillion)
> Total federal debt first year in office: $28.4 trillion (121.9% of GDP)
> Total federal debt in 2022: $30.9 trillion (120.2% of GDP)
> Party affiliation: Democratic
At the start of President Joe Biden’s first full fiscal year in office on Oct. 1, 2021, the national debt stood at $28.4 trillion. By the end of the fiscal year, in September 2022, the nation’s debt had climbed 8.8%, totaling $30.9 trillion. During his time in office, Biden enacted a $1.9 trillion stimulus package with provisions that included emergency funding for state and local governments, increased unemployment benefits, new child tax credits, and funding for the Federal Emergency Management Agency.
The Biden Administration also successfully passed a tax reconciliation bill, which will result in $450 billion in tax increases. With no new COVID-19 relief or economic stimulus spending in the coming year, the $1.2 trillion deficit projected for fiscal 2023 is considerably lower than it has been in recent years.
Methodology
To determine how the national debt changed under each president in the last 100 years, 24/7 Wall St. reviewed total, non-inflation-adjusted government debt each year since 1923 with data from the U.S. Treasury Department. We calculated the change in debt, both in absolute and relative terms, from each president’s first year in office to his last. It is important to note that due to data limitations, debt measurements do not align with each presidential administration to the day.
We also reviewed data on U.S. gross domestic product each year from the Bureau of Economic Analysis. We used GDP data to calculate the debt as a share of GDP, or the debt-to-GDP ratio.
Start by taking a quick retirement quiz from SmartAsset that will match you with up to 3 financial advisors that serve your area and beyond in 5 minutes, or less.
Each advisor has been vetted by SmartAsset and is held to a fiduciary standard to act in your best interests.
Here’s how it works:
1. Answer SmartAsset advisor match quiz
2. Review your pre-screened matches at your leisure. Check out the advisors’ profiles.
3. Speak with advisors at no cost to you. Have an introductory call on the phone or introduction in person and choose whom to work with in the future
Thank you for reading! Have some feedback for us?
Contact the 24/7 Wall St. editorial team.