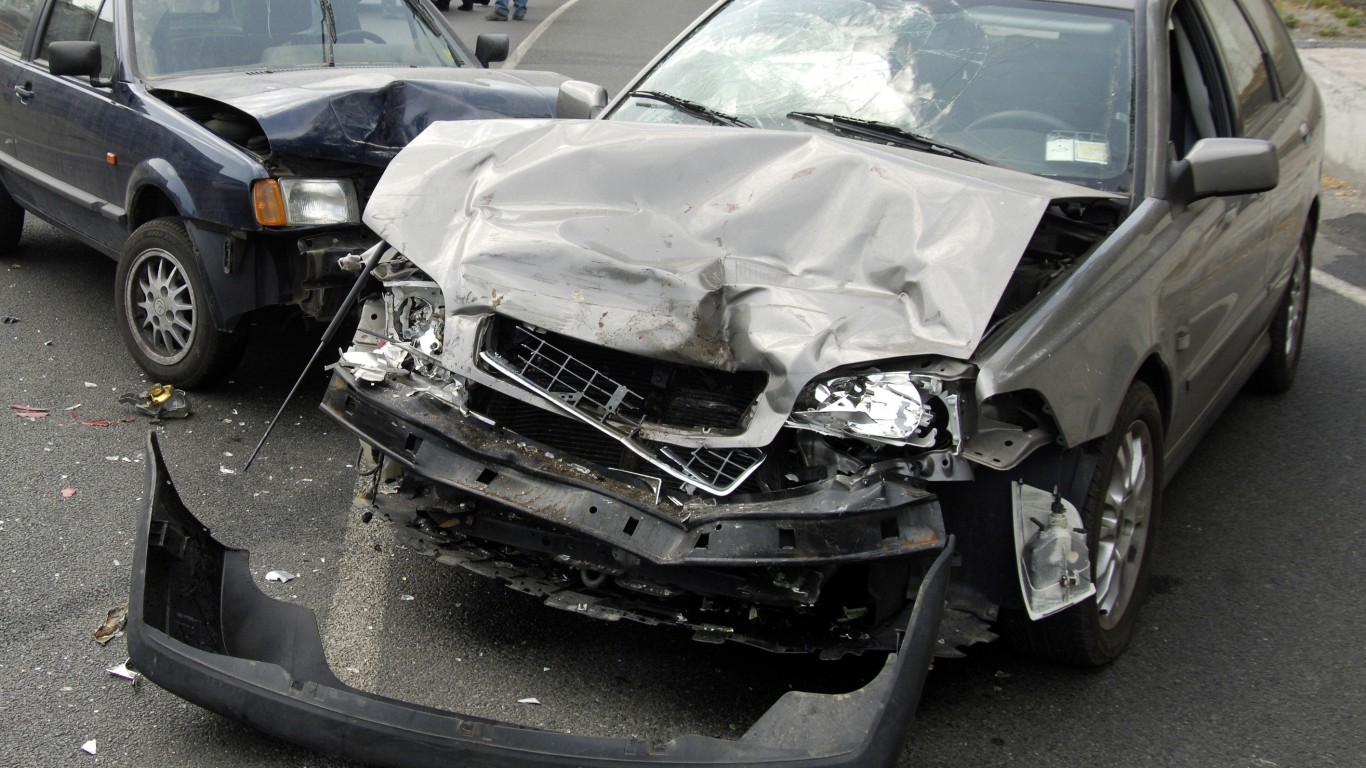
According to figures just published by the The National Highway Traffic Safety Administration, an estimated 42,939 Americans died in motor vehicle traffic crashes. That figure is just shy of last year’s 42,939, which was the highest figure in more than a decade. Last year, the Biden administration called the rise in automobile deaths a crisis.
Not all cars are equally involved in traffic fatalities. While safety features in cars have vastly improved over the years, there are some vehicles that receive poor grades in safety measures. Some of these cars, as well as cars that receive good safety grades, are among the cars that are more likely to be involved in fatal crashes.
To find the deadliest cars in America, 24/7 Wall St. reviewed fatal car crashes data from the NHTSA and car sales data from GoodCarBadCar. Both fatal crashes and sales are from 2018-2020, with 2020 being the most recent year for which crash data is available. Crash figures are also for 2018 model year vehicles or later. Models with fewer than 100,000 cars sold in the three-year period or with no sales or crash data were excluded.
Safety standards in vehicles have improved over the years, and cars that fail standard safety tests are rare. Many of the cars on this list received top marks from safety ratings agencies. However, a number of cars received mediocre or poor grades in the small overlap front crash test, created by nonprofit vehicle safety organization the Insurance Institute for Highway Safety. The test measures what happens when the front corner of the vehicle hits an object, as opposed to the entire front part of the car taking the impact.
Three of the four cars with the highest fatalities per vehicle sold are sports sedans, which people buy because they can go fast. Driving at excessive speeds is one of the biggest causes of motor vehicle deaths. (These are the worst car accidents since the 1990s)
A number of the cars ranking close to the top of this list (meaning they were involved in more crashes) are compact and subcompact vehicles. In a 2020 report published by the IIHS, smaller vehicles are more dangerous simply because they have less mass, which means they take the worst of a collision with a larger one, even if the vehicle has good safety ratings.
Click here to see the deadliest cars to drive in America.
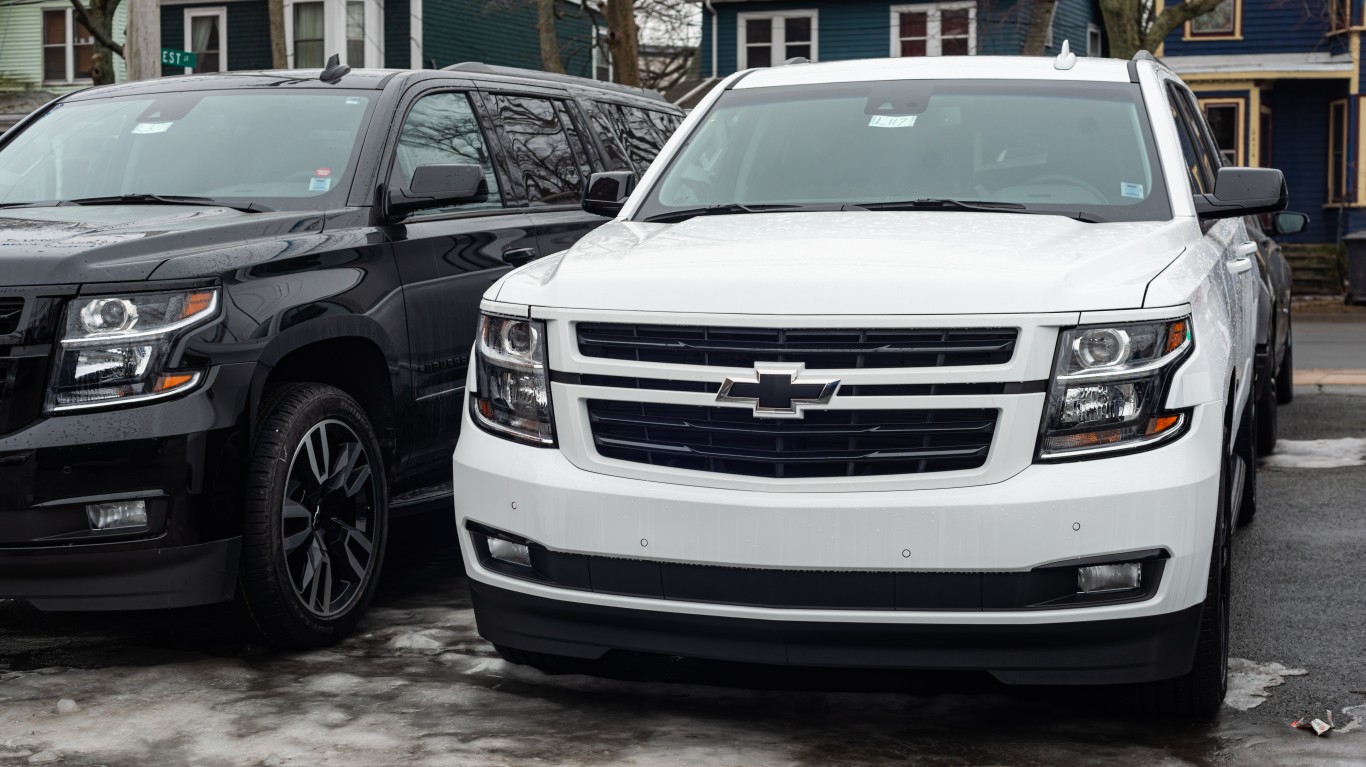
25. Chevrolet Suburban
> Fatal crashes to sales, 2018-2020: 2.3 per 10,000 sold cars
> Fatal crashes, 2018-2020: 34
> Sales, 2018-2020: 146,205
[in-text-ad]
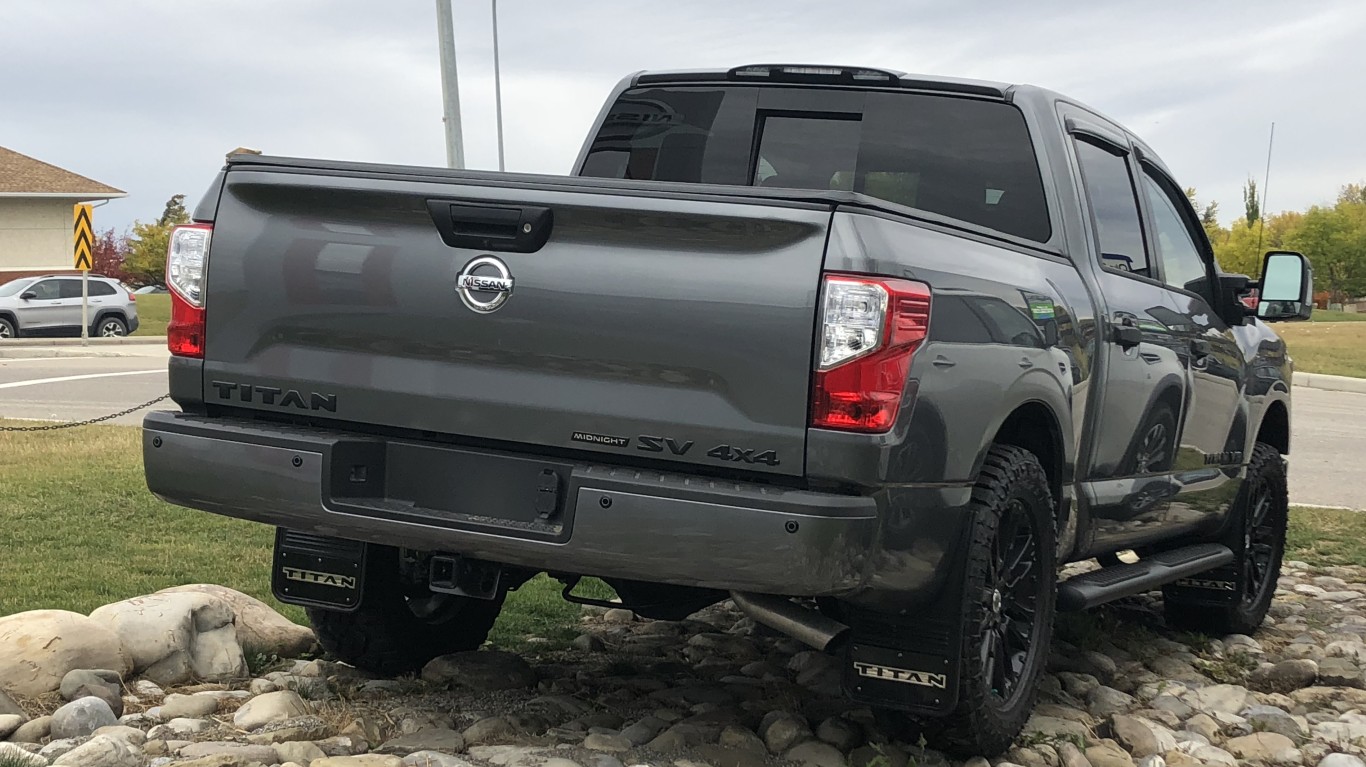
24. Nissan Titan
> Fatal crashes to sales, 2018-2020: 2.4 per 10,000 sold cars
> Fatal crashes, 2018-2020: 26
> Sales, 2018-2020: 108,414
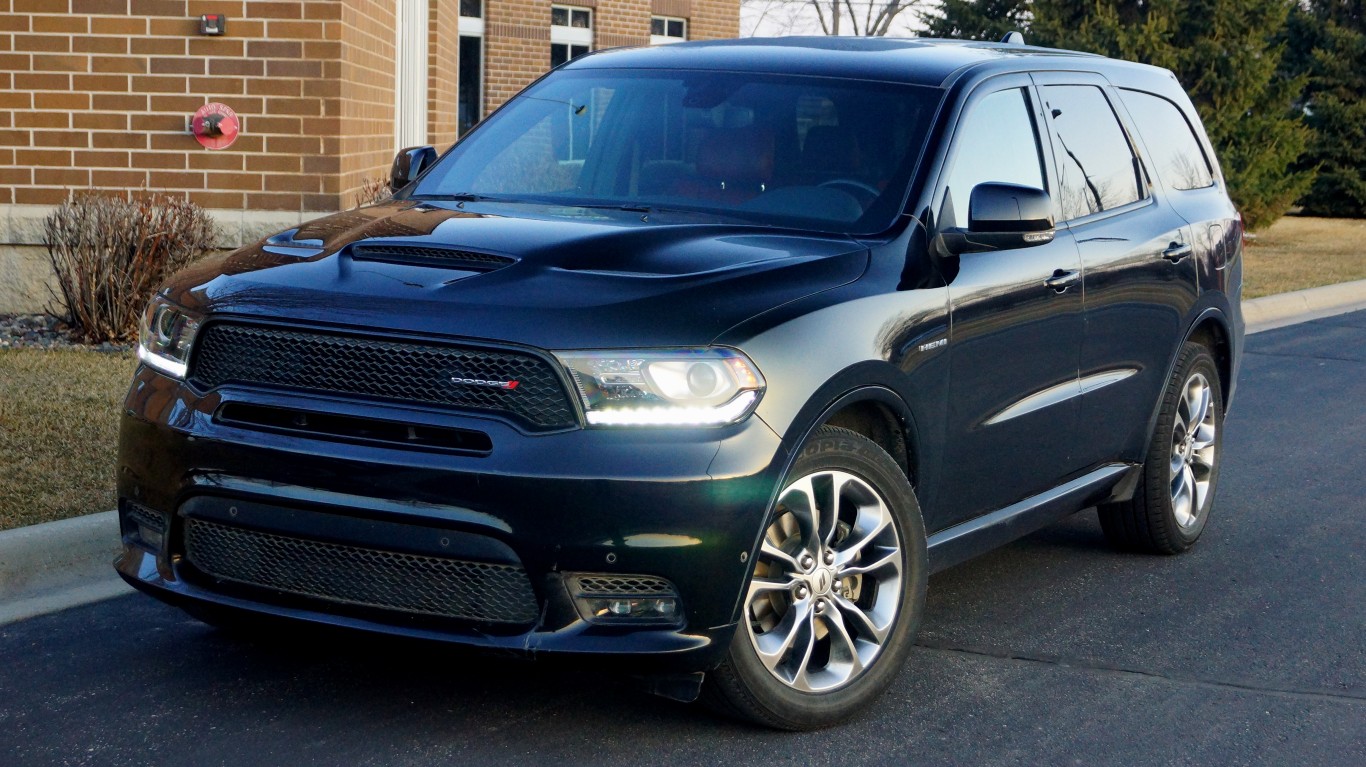
23. Dodge Durango
> Fatal crashes to sales, 2018-2020: 2.5 per 10,000 sold cars
> Fatal crashes, 2018-2020: 47
> Sales, 2018-2020: 191,373
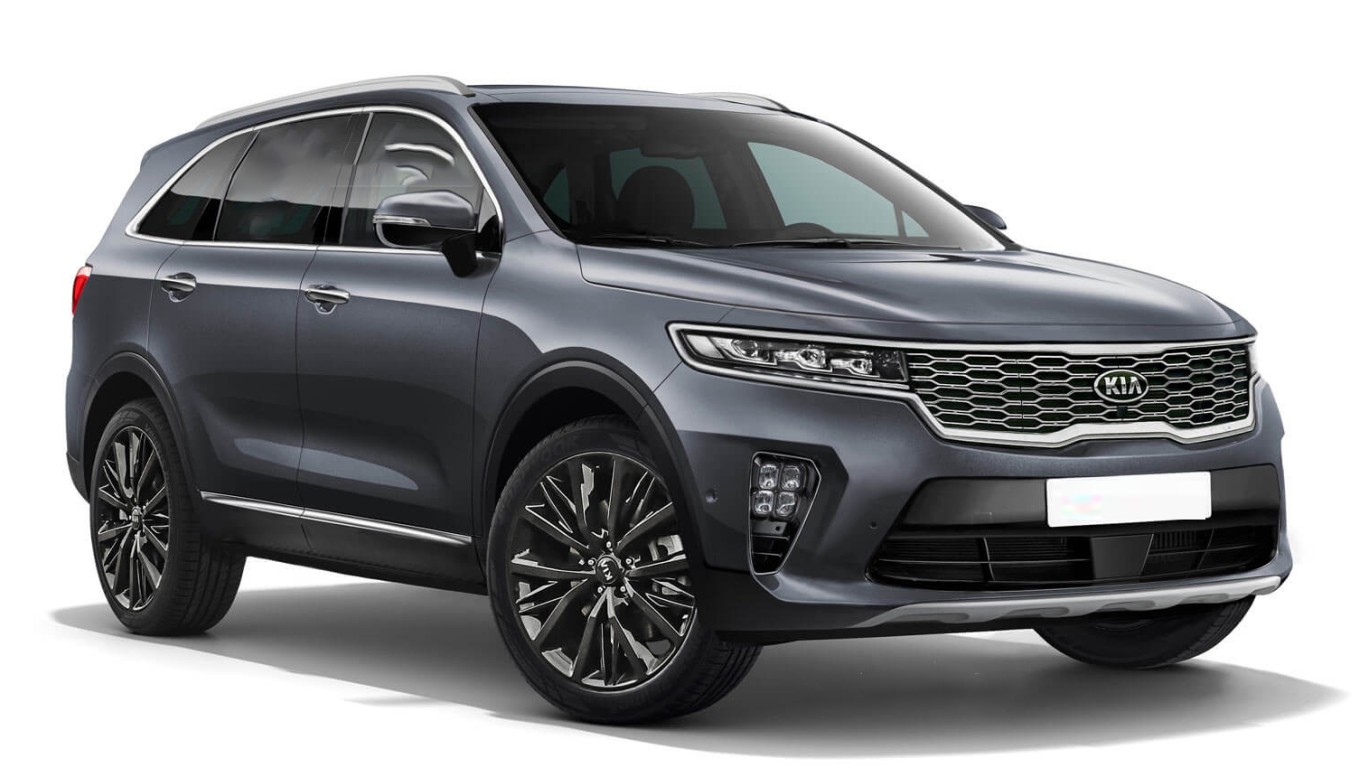
22. Kia Sorento
> Fatal crashes to sales, 2018-2020: 2.5 per 10,000 sold cars
> Fatal crashes, 2018-2020: 69
> Sales, 2018-2020: 279,054
[in-text-ad-2]
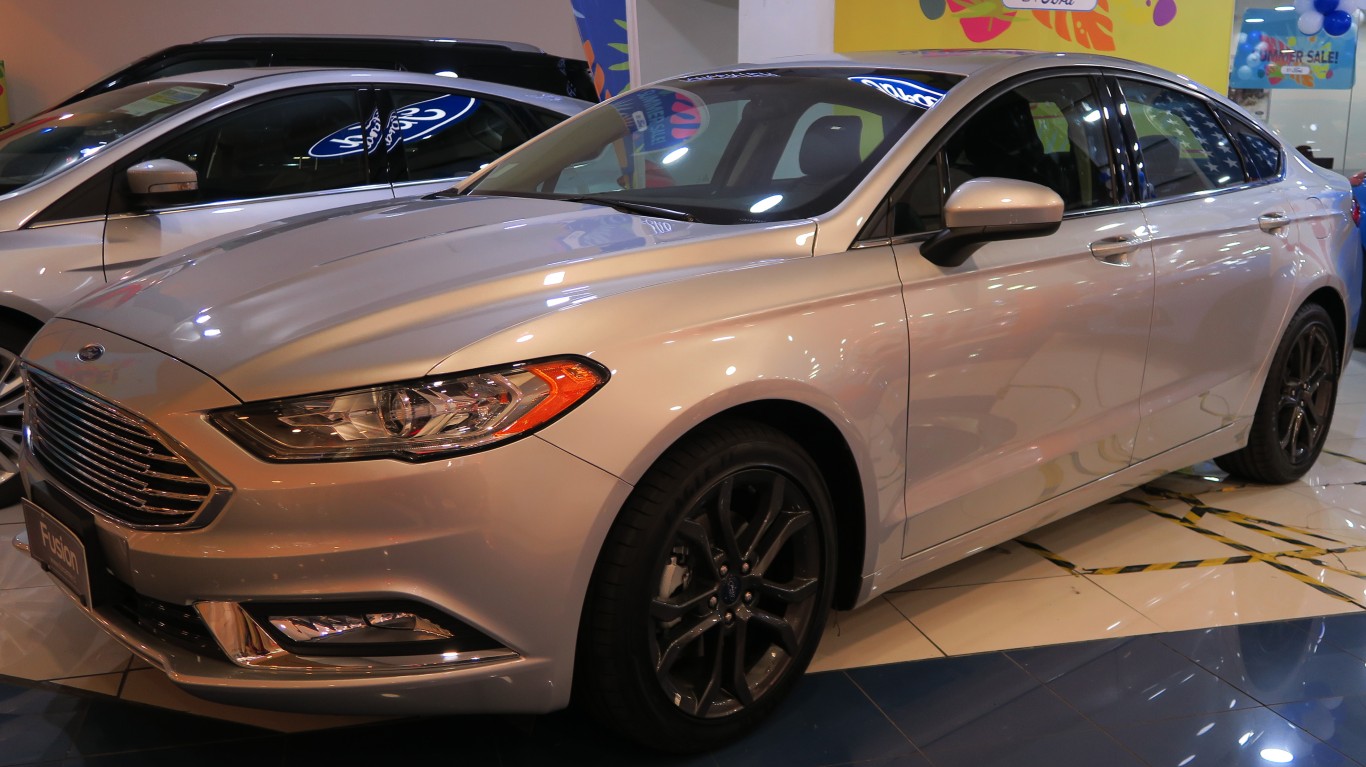
21. Ford Fusion
> Fatal crashes to sales, 2018-2020: 2.5 per 10,000 sold cars
> Fatal crashes, 2018-2020: 114
> Sales, 2018-2020: 450,310
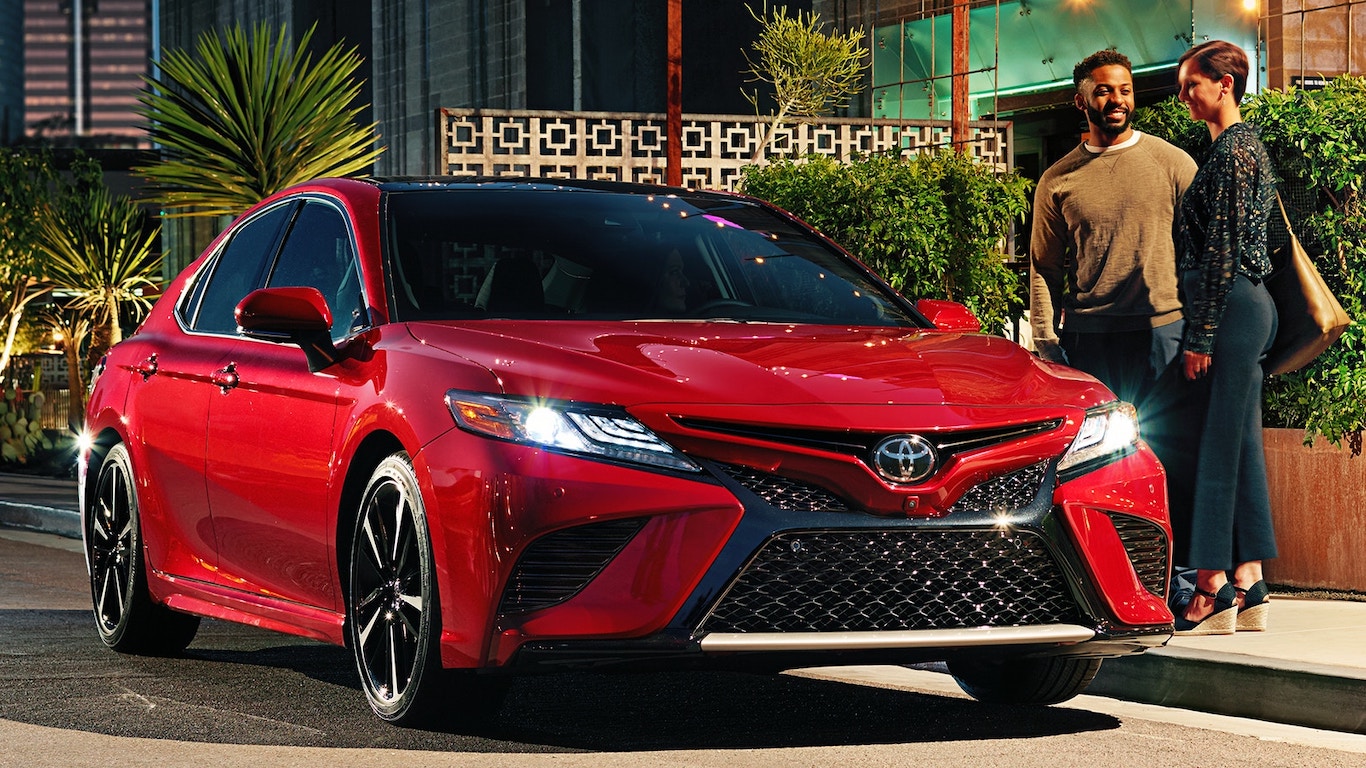
20. Toyota Camry
> Fatal crashes to sales, 2018-2020: 2.6 per 10,000 sold cars
> Fatal crashes, 2018-2020: 251
> Sales, 2018-2020: 974,765
[in-text-ad]
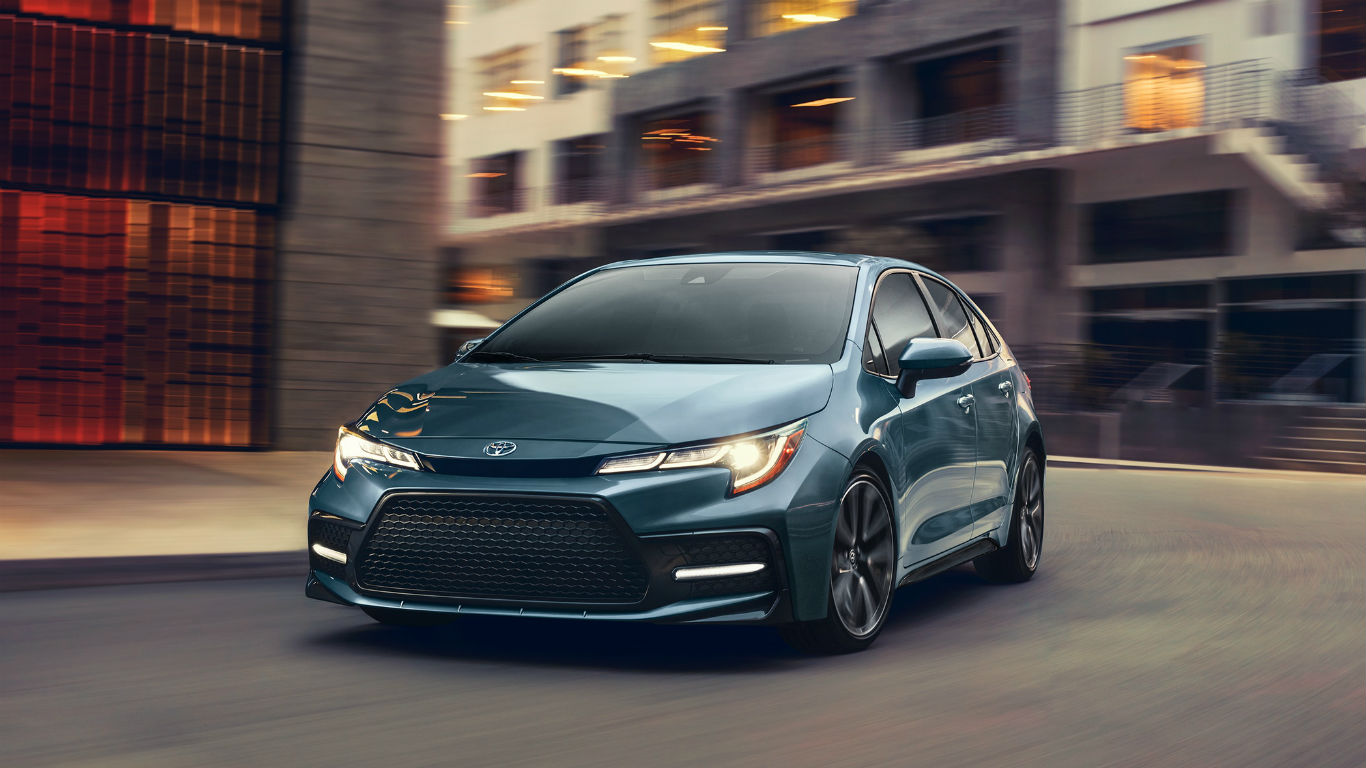
19. Toyota Corolla
> Fatal crashes to sales, 2018-2020: 2.6 per 10,000 sold cars
> Fatal crashes, 2018-2020: 219
> Sales, 2018-2020: 845,761
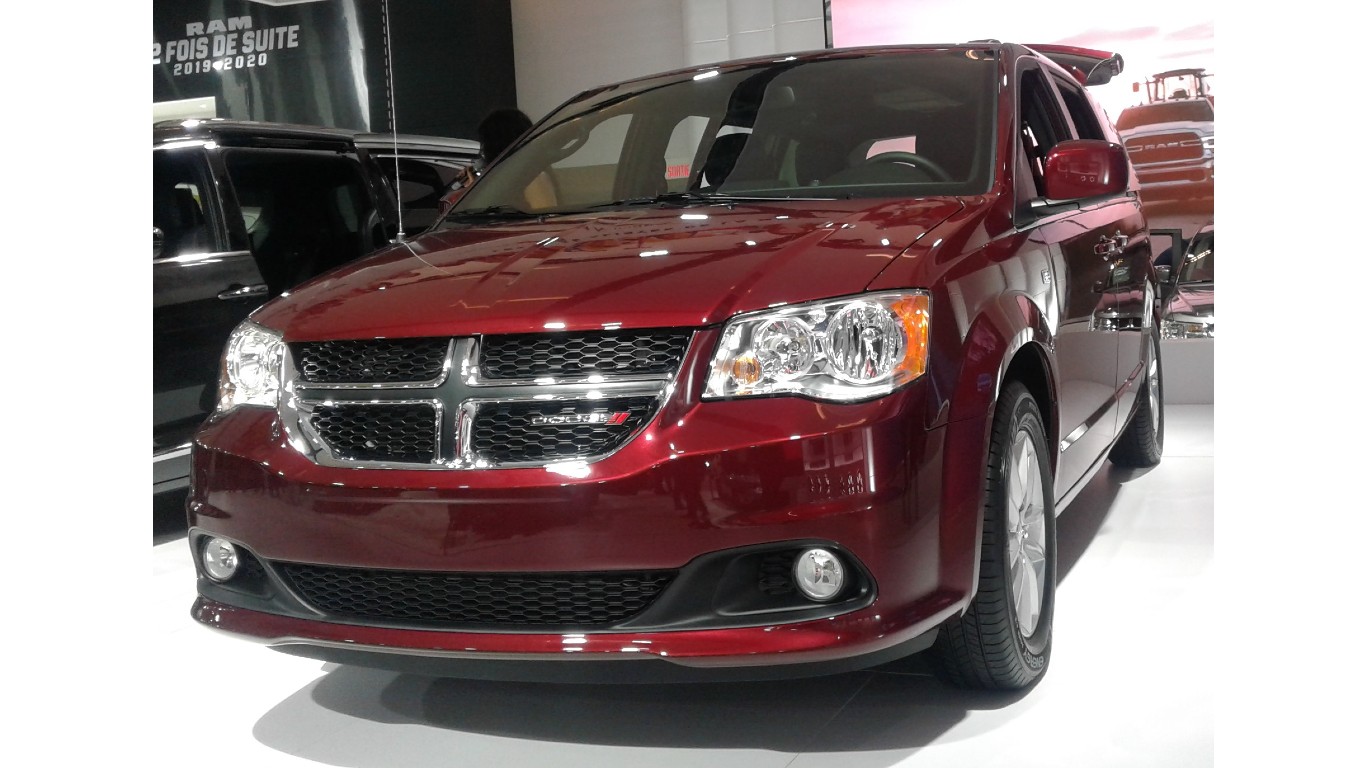
18. Dodge Grand Caravan
> Fatal crashes to sales, 2018-2020: 2.6 per 10,000 sold cars
> Fatal crashes, 2018-2020: 82
> Sales, 2018-2020: 313,340
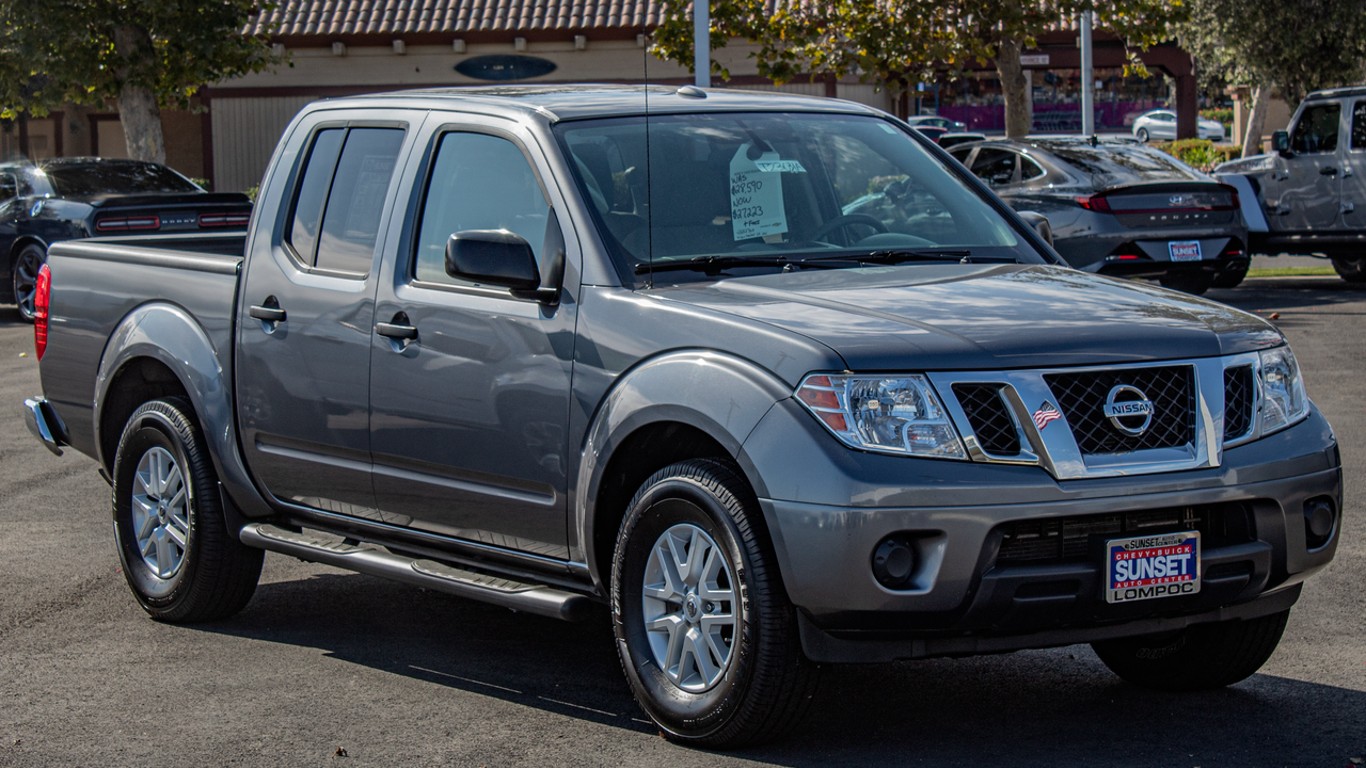
17. Nissan Frontier
> Fatal crashes to sales, 2018-2020: 2.9 per 10,000 sold cars
> Fatal crashes, 2018-2020: 60
> Sales, 2018-2020: 206,832
[in-text-ad-2]
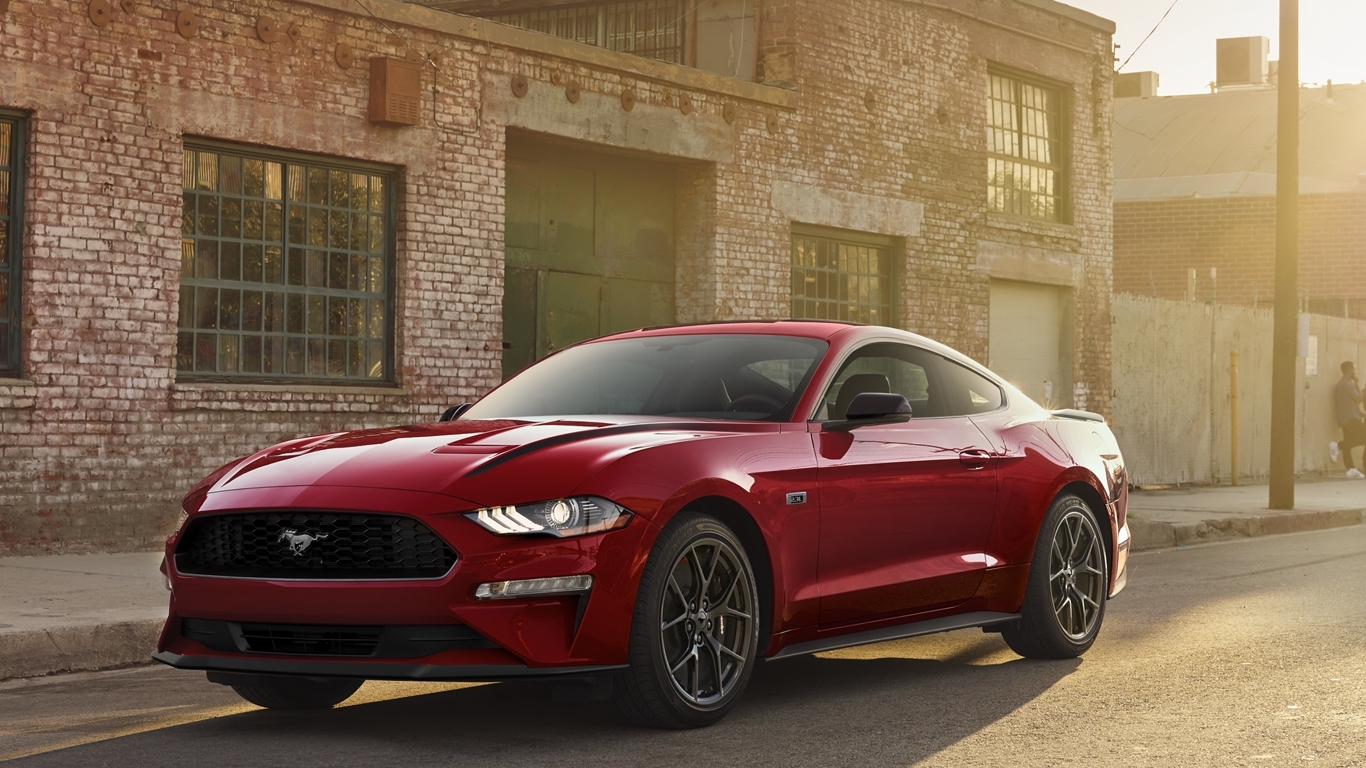
16. Ford Mustang
> Fatal crashes to sales, 2018-2020: 3.5 per 10,000 sold cars
> Fatal crashes, 2018-2020: 73
> Sales, 2018-2020: 209,421
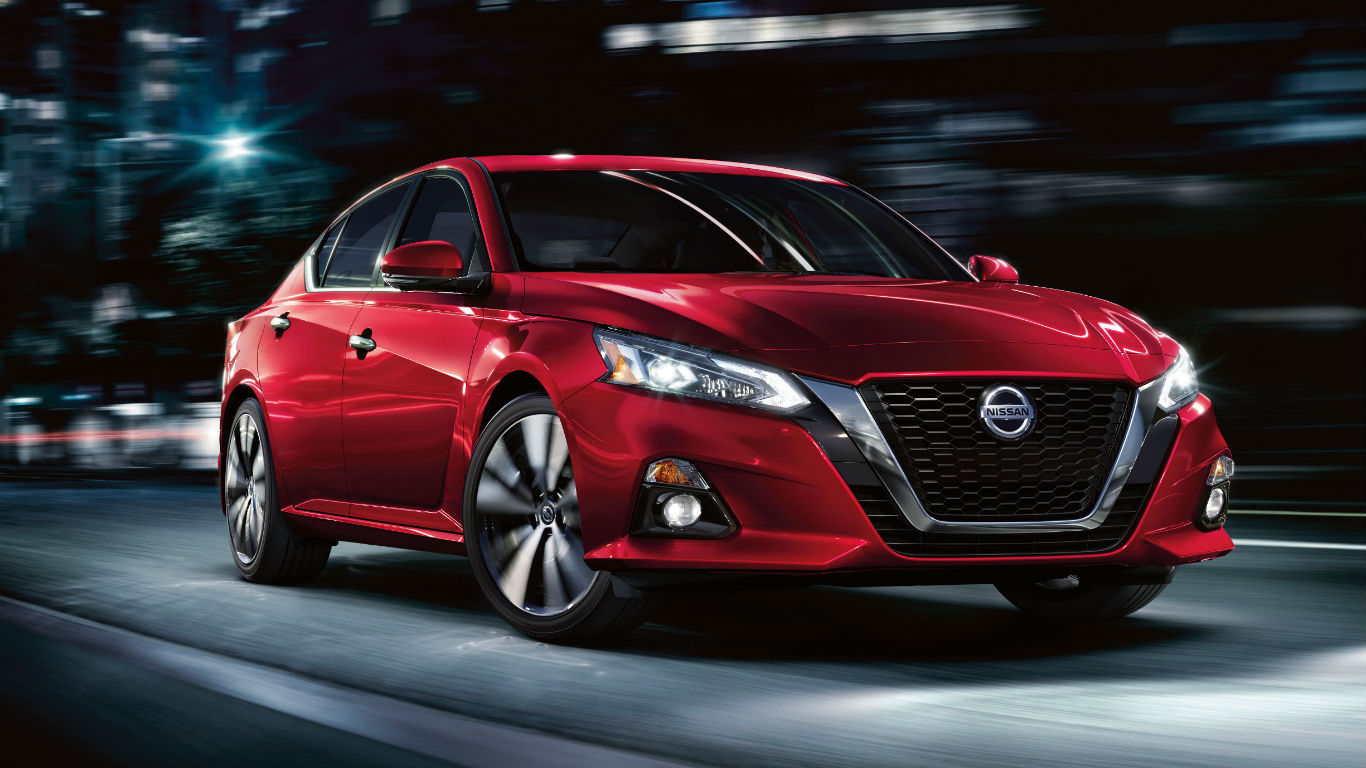
15. Nissan Altima
> Fatal crashes to sales, 2018-2020: 3.6 per 10,000 sold cars
> Fatal crashes, 2018-2020: 200
> Sales, 2018-2020: 556,317
[in-text-ad]
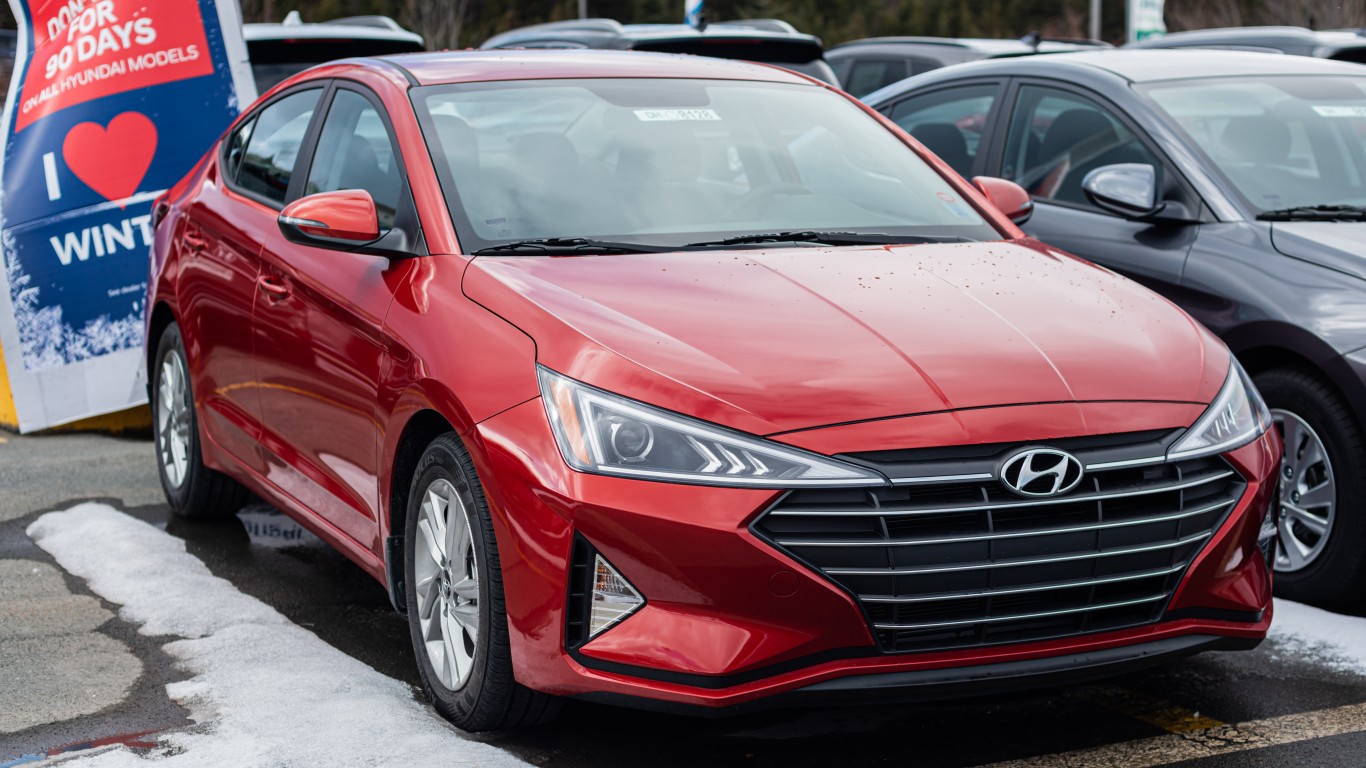
14. Hyundai Elantra
> Fatal crashes to sales, 2018-2020: 3.7 per 10,000 sold cars
> Fatal crashes, 2018-2020: 179
> Sales, 2018-2020: 480,984
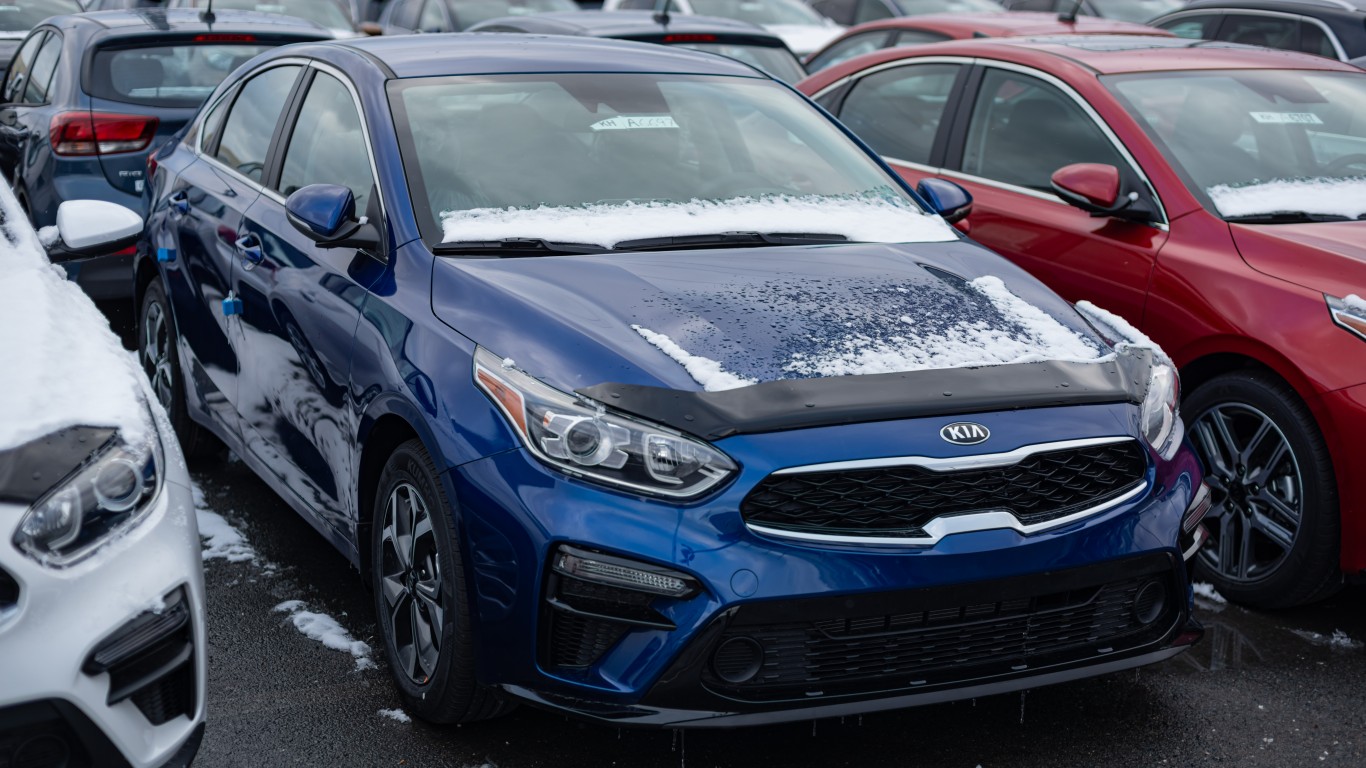
13. Kia Forte
> Fatal crashes to sales, 2018-2020: 3.8 per 10,000 sold cars
> Fatal crashes, 2018-2020: 106
> Sales, 2018-2020: 282,570
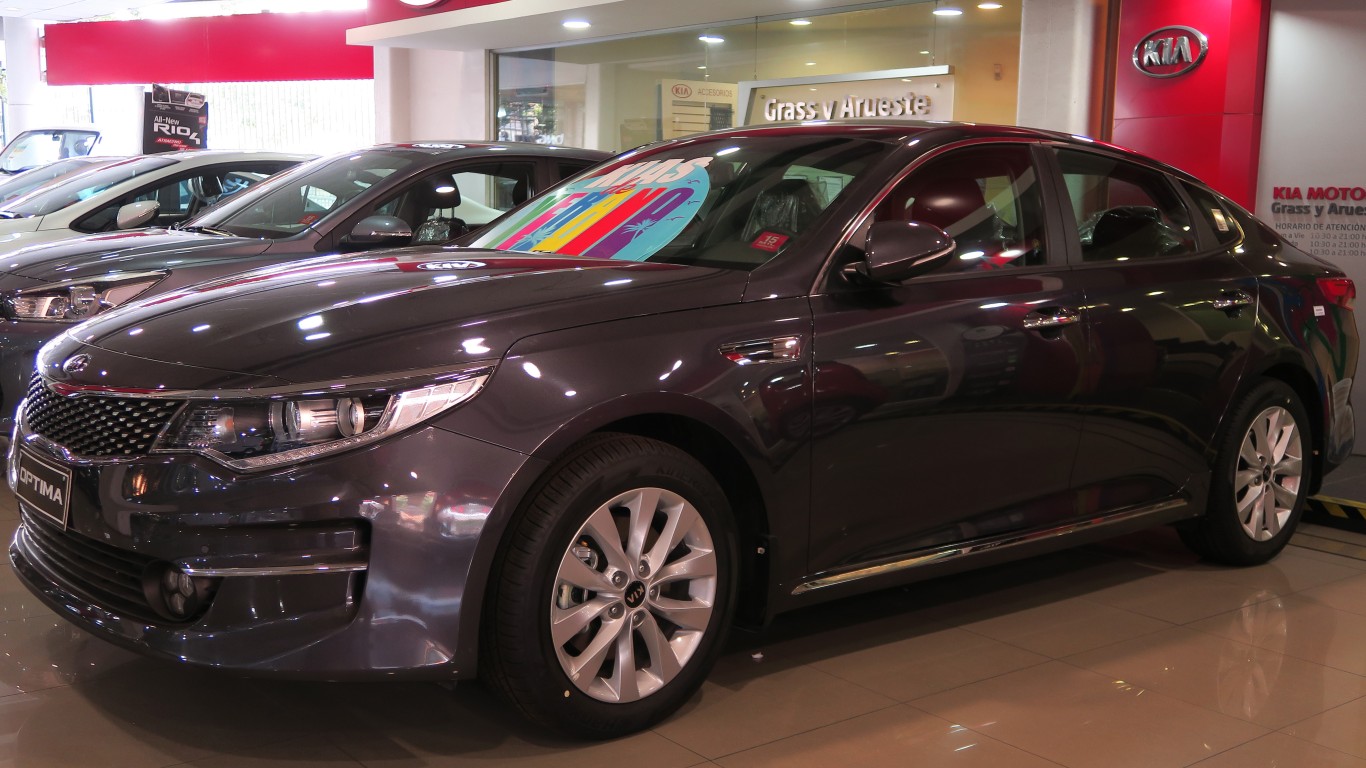
12. Kia Optima
> Fatal crashes to sales, 2018-2020: 3.9 per 10,000 sold cars
> Fatal crashes, 2018-2020: 95
> Sales, 2018-2020: 246,137
[in-text-ad-2]
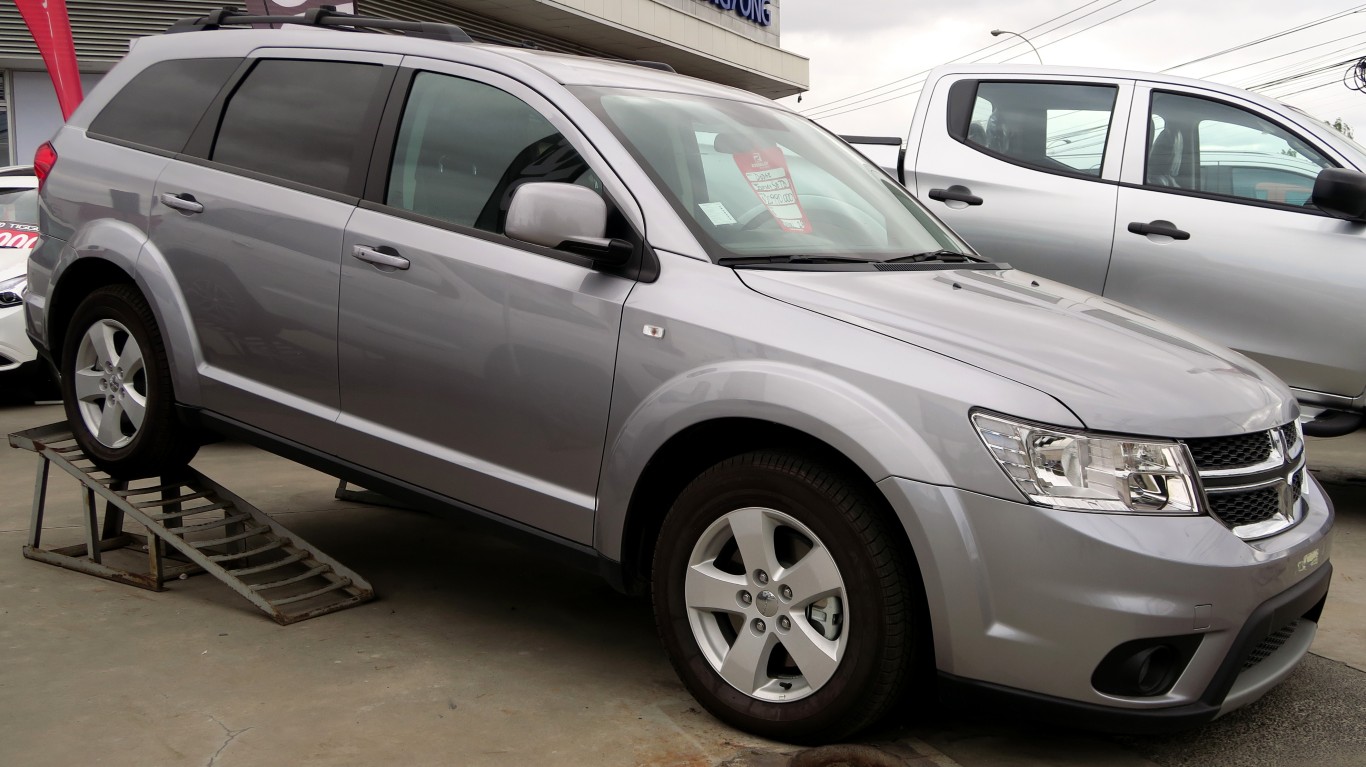
11. Dodge Journey
> Fatal crashes to sales, 2018-2020: 4.0 per 10,000 sold cars
> Fatal crashes, 2018-2020: 83
> Sales, 2018-2020: 209,124
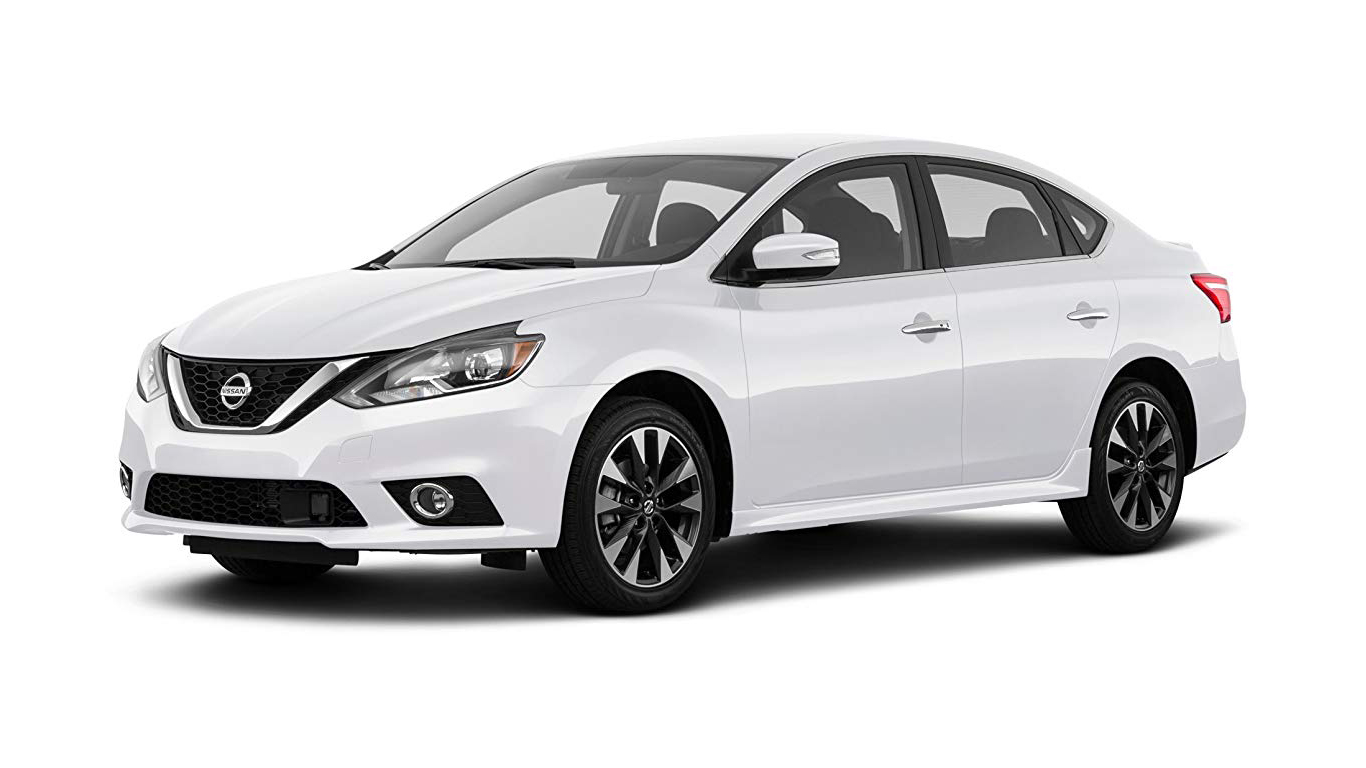
10. Nissan Sentra
> Fatal crashes to sales, 2018-2020: 4.0 per 10,000 sold cars
> Fatal crashes, 2018-2020: 197
> Sales, 2018-2020: 492,309
[in-text-ad]
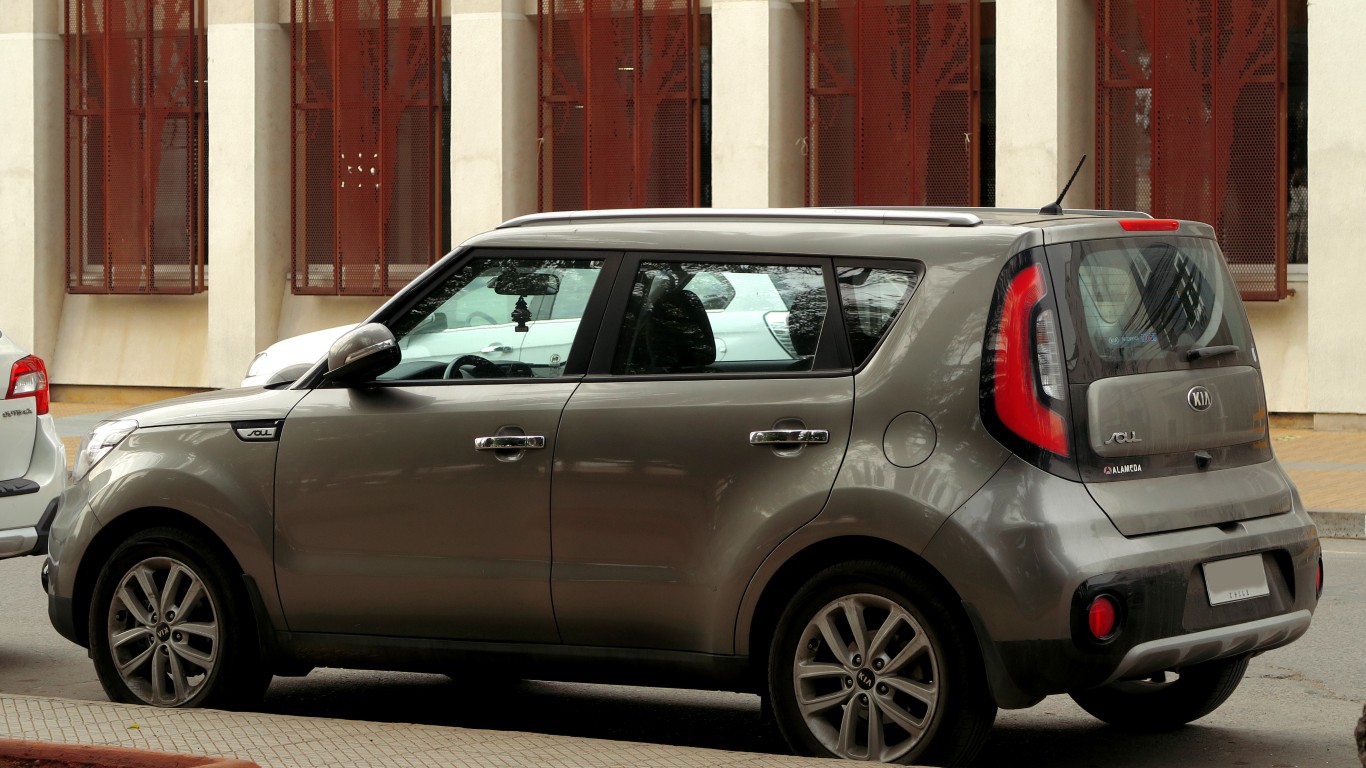
9. Kia Soul
> Fatal crashes to sales, 2018-2020: 4.0 per 10,000 sold cars
> Fatal crashes, 2018-2020: 111
> Sales, 2018-2020: 274,295
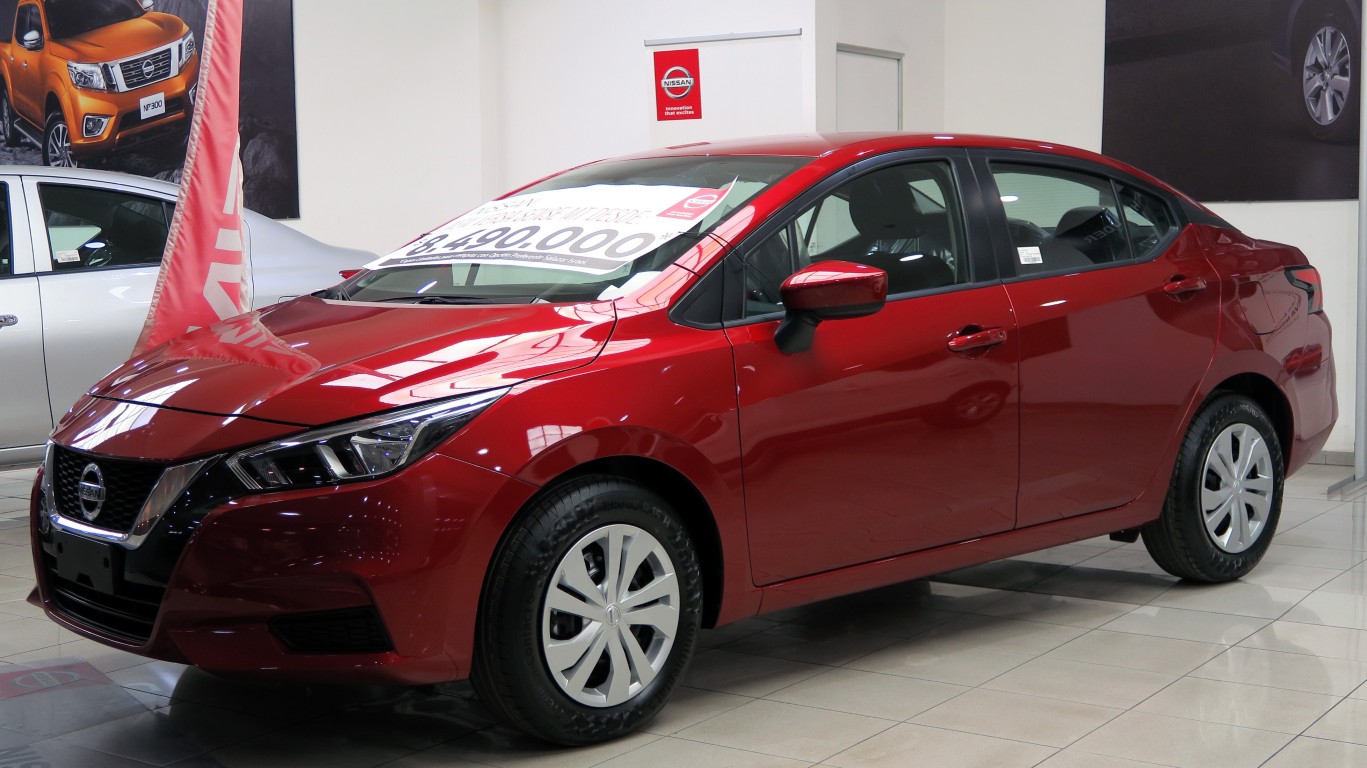
8. Nissan Versa
> Fatal crashes to sales, 2018-2020: 4.3 per 10,000 sold cars
> Fatal crashes, 2018-2020: 82
> Sales, 2018-2020: 190,677
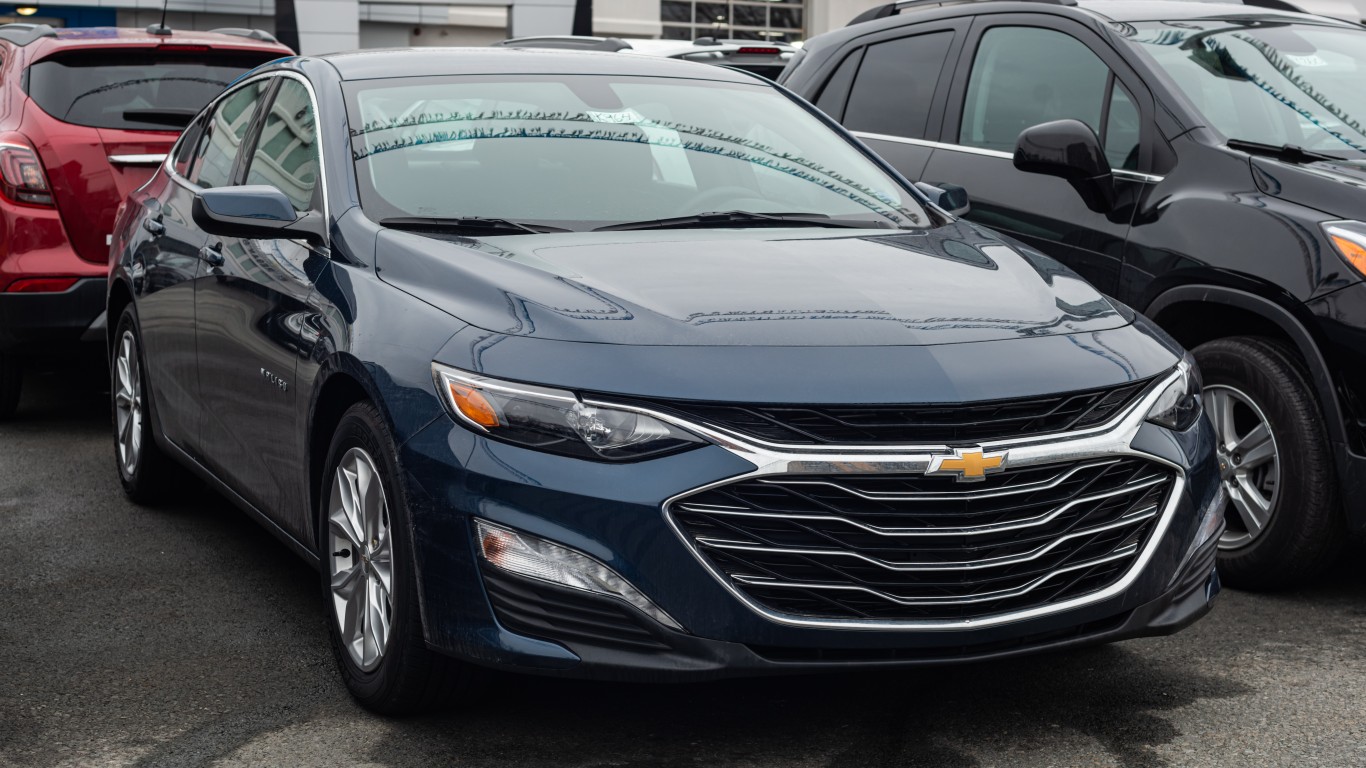
7. Chevrolet Malibu
> Fatal crashes to sales, 2018-2020: 4.4 per 10,000 sold cars
> Fatal crashes, 2018-2020: 163
> Sales, 2018-2020: 367,496
[in-text-ad-2]
6. Ford Fiesta
> Fatal crashes to sales, 2018-2020: 4.9 per 10,000 sold cars
> Fatal crashes, 2018-2020: 56
> Sales, 2018-2020: 115,232
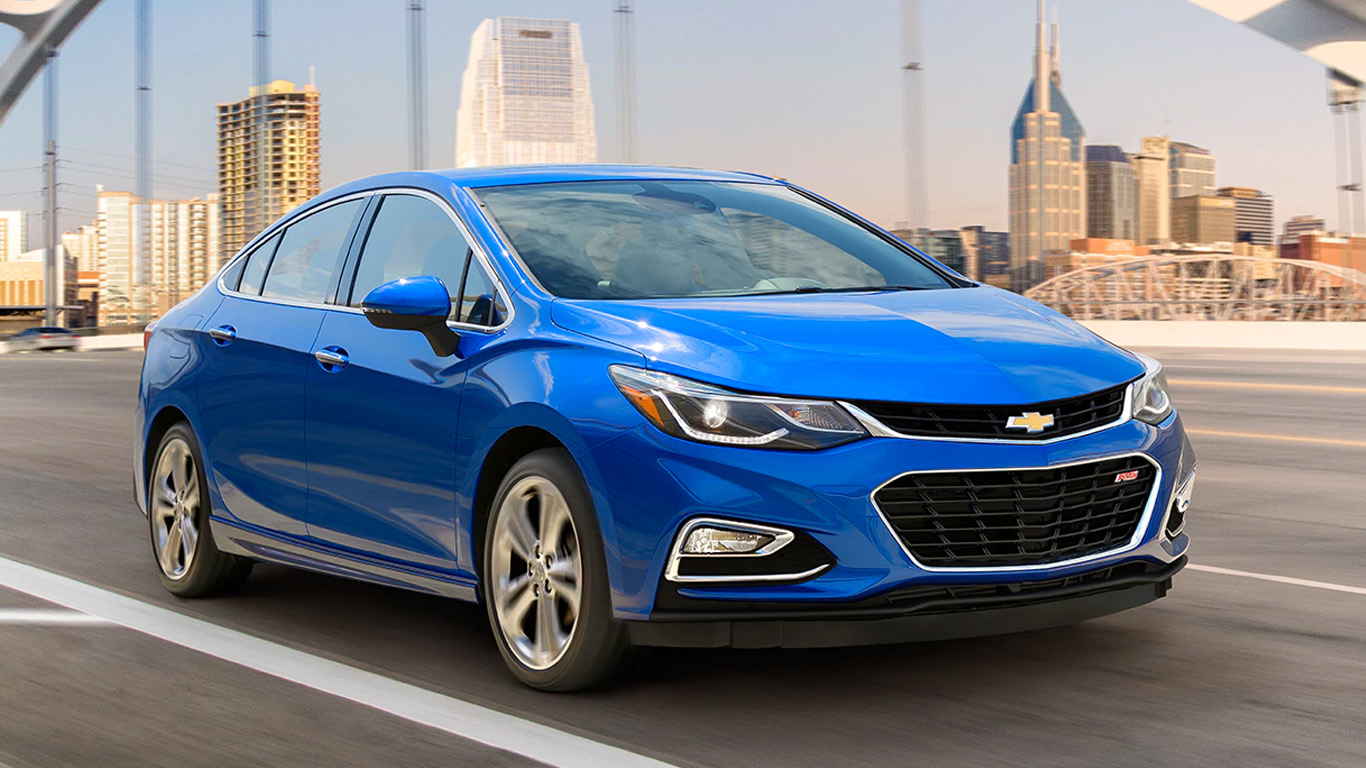
5. Chevrolet Cruze
> Fatal crashes to sales, 2018-2020: 5.0 per 10,000 sold cars
> Fatal crashes, 2018-2020: 96
> Sales, 2018-2020: 191,376
[in-text-ad]
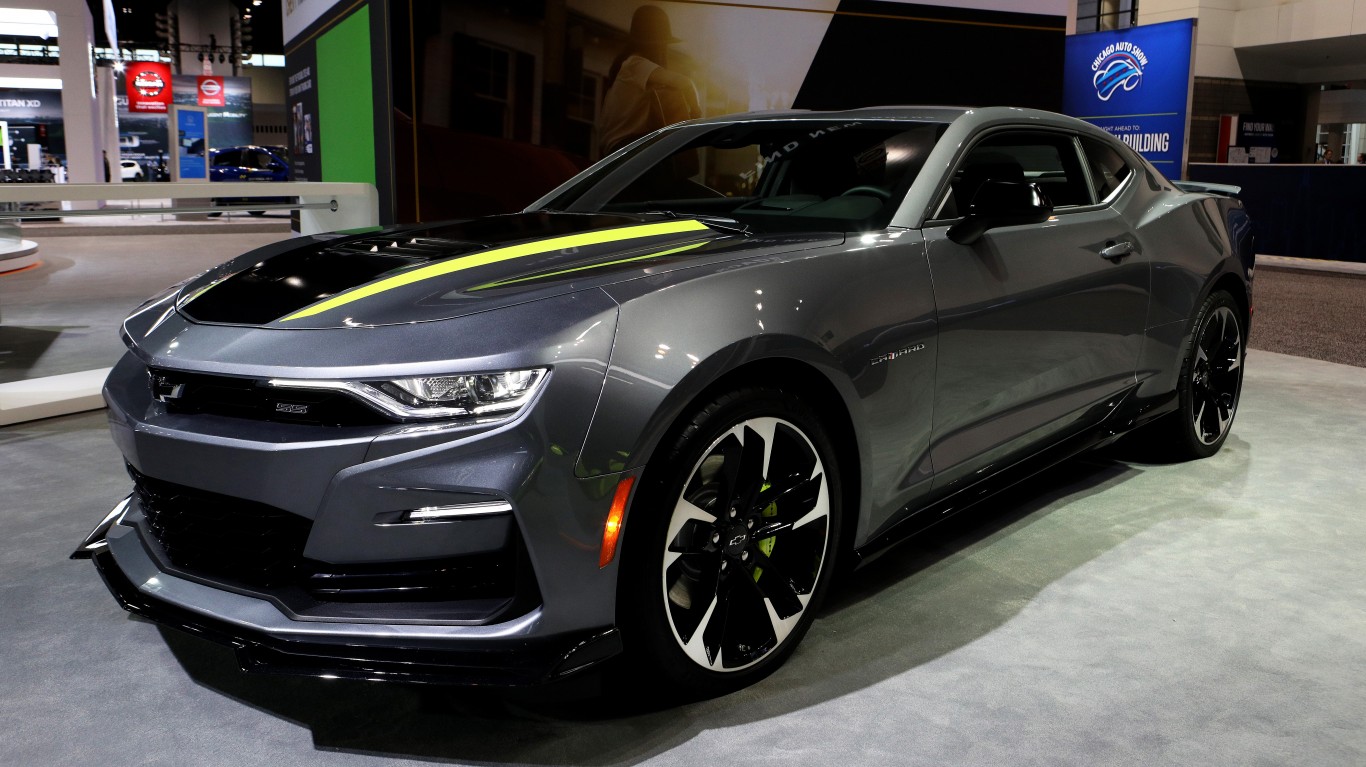
4. Chevrolet Camaro
> Fatal crashes to sales, 2018-2020: 5.7 per 10,000 sold cars
> Fatal crashes, 2018-2020: 74
> Sales, 2018-2020: 129,006
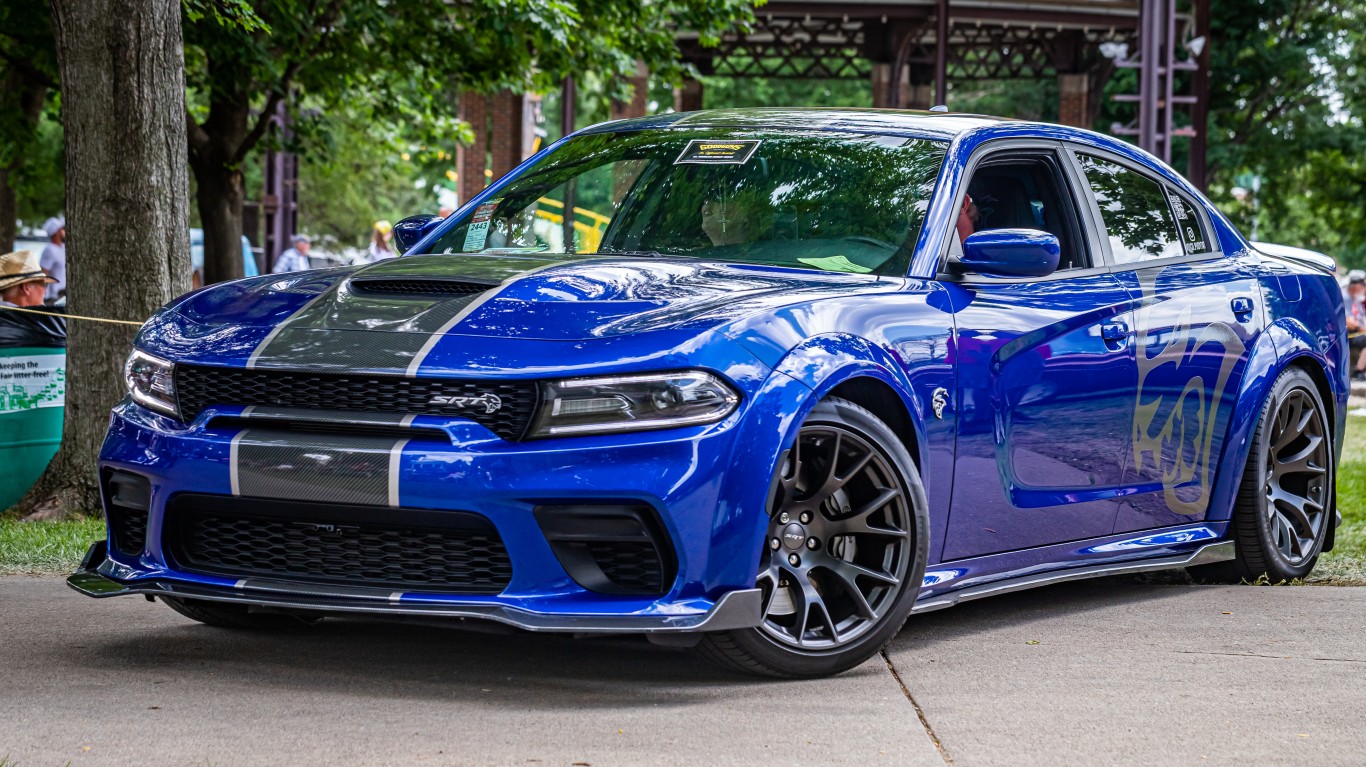
3. Dodge Charger
> Fatal crashes to sales, 2018-2020: 6.0 per 10,000 sold cars
> Fatal crashes, 2018-2020: 152
> Sales, 2018-2020: 254,588
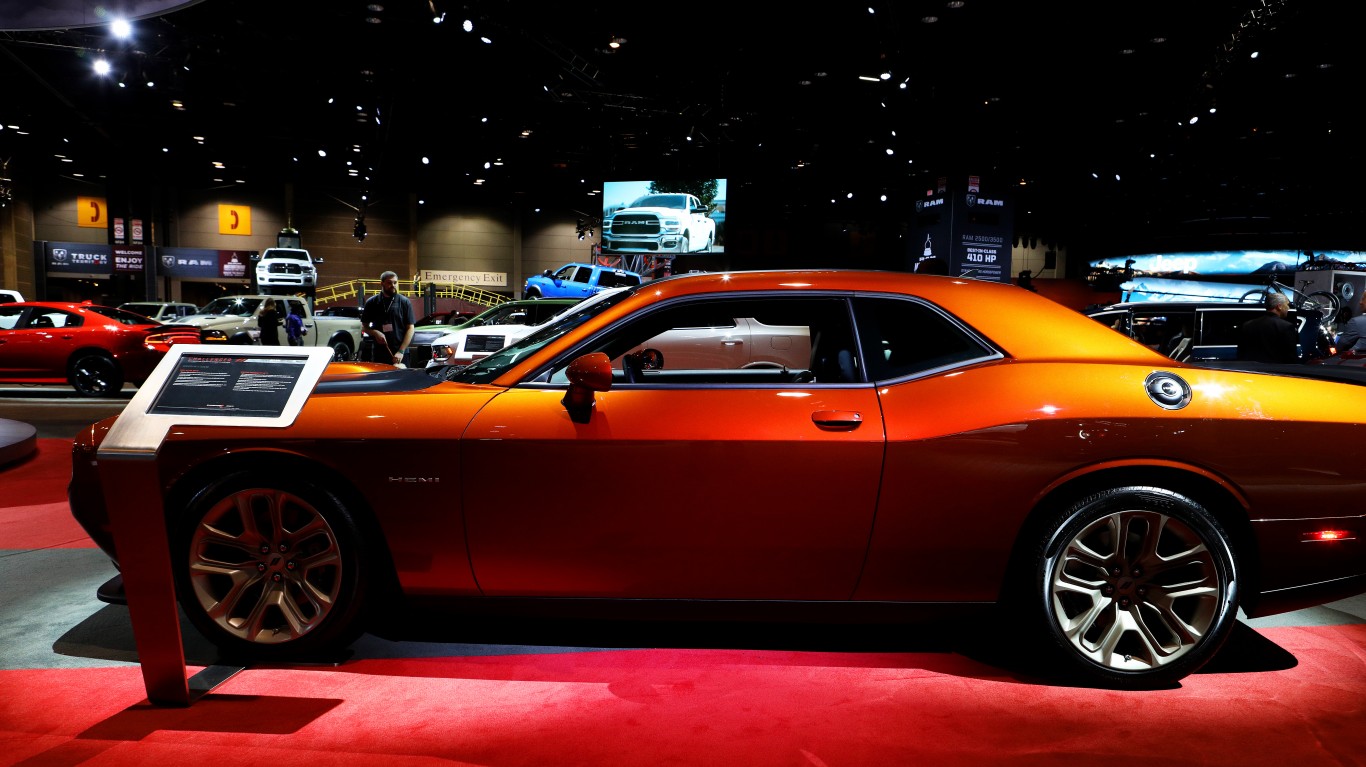
2. Dodge Challenger
> Fatal crashes to sales, 2018-2020: 6.1 per 10,000 sold cars
> Fatal crashes, 2018-2020: 111
> Sales, 2018-2020: 180,668
[in-text-ad-2]
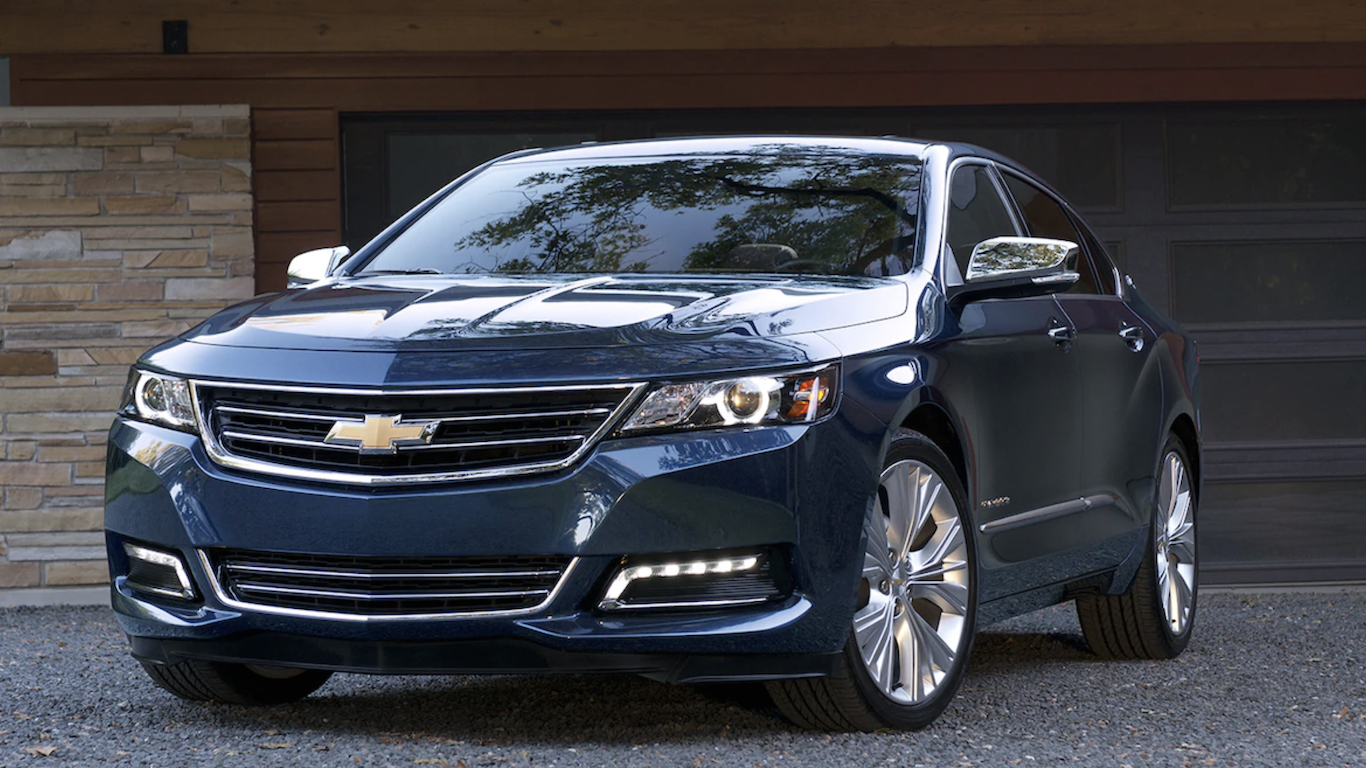
1. Chevrolet Impala
> Fatal crashes to sales, 2018-2020: 7.0 per 10,000 sold cars
> Fatal crashes, 2018-2020: 78
> Sales, 2018-2020: 111,478
Are You Ahead, or Behind on Retirement?
If you’re one of the over 4 Million Americans set to retire this year, you may want to pay attention. Many people have worked their whole lives preparing to retire without ever knowing the answer to the most important question: am I ahead, or behind on my goals?
Don’t make the same mistake. It’s an easy question to answer. A quick conversation with a financial advisor can help you unpack your savings, spending, and goals for your money. With Zoe Financial’s free matching tool, you can connect with trusted financial advisors in minutes.
Why wait? Click here to get started today!
Thank you for reading! Have some feedback for us?
Contact the 24/7 Wall St. editorial team.
 24/7 Wall St.
 24/7 Wall St.