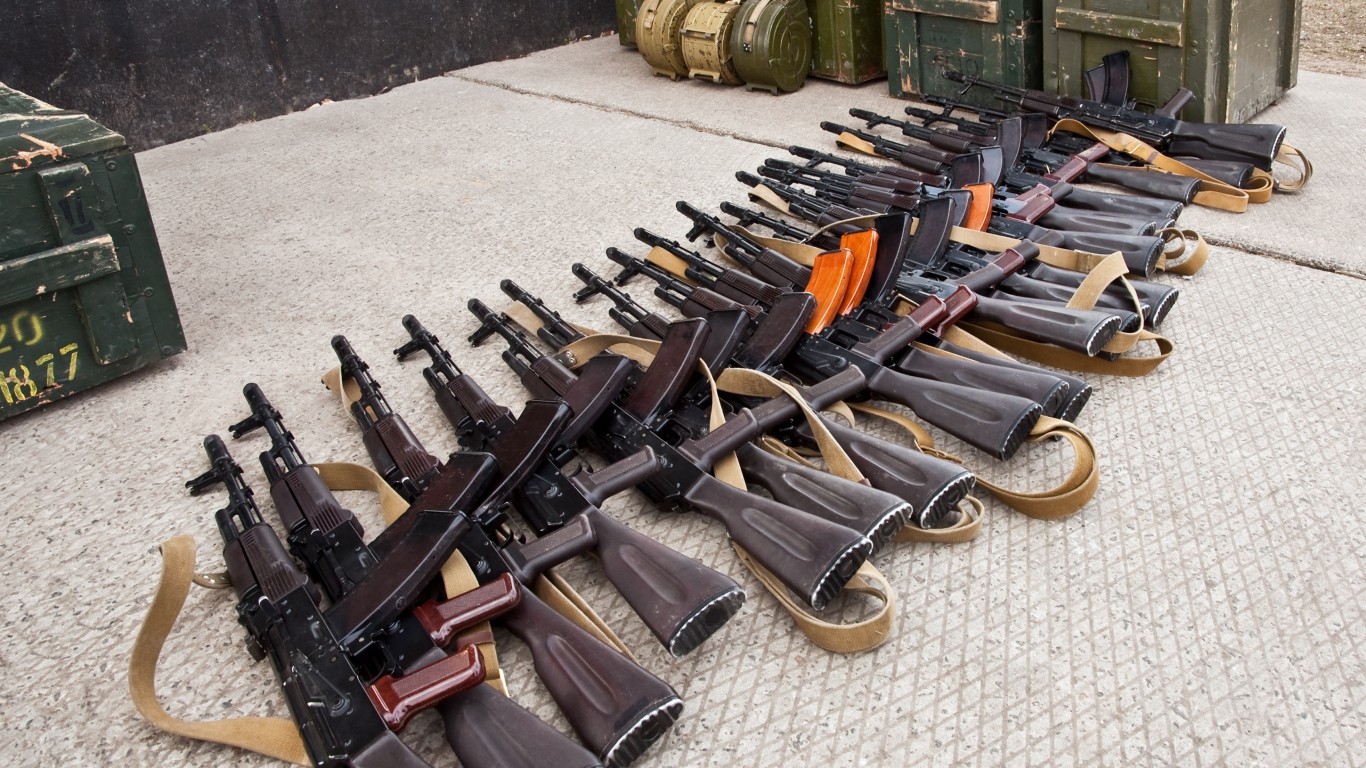
U.S. firearm sales have surged in recent years and have coincided with a steep increase in gun violence — a record number of Americans died of gun-related injuries in 2021, according to data from the Centers for Disease Control and Prevention. While law-abiding citizens with no intention of engaging in criminal activity account for the vast majority of gun purchases, the influx of guns in American households increases the likelihood of firearms falling into the wrong hands, particularly through theft.
According to the Bureau of Alcohol, Tobacco, Firearms, and Explosives, more than 1 million firearms were reported stolen by private citizens in the five years from 2017 to 2021. Stolen guns are most commonly burgled from homes and vehicles, but some are also taken directly from a person. Though many stolen guns are ultimately linked to crimes, they are typically first sold on the black market.
Hundreds, if not thousands, of firearms were reported stolen in every state in the last five years. Still, gun theft is far more common in some states than in others.
Using data from the ATF’s report National Firearms Commerce and Trafficking Assessment (NFCTA): Crime Guns – Volume Two,, 24/7 Wall St. identified the states with the highest firearm theft rates. States are ranked by the annual average number of guns stolen from private citizens from 2017 to 2021 for every 100,000 people in the state. Thefts from gun stores and gunmakers were not considered.
Depending on the state, the average number of guns stolen each year ranges from 5.4 for every 100,000 people to 185.1 guns stolen per 100,000. According to the ATF, there is a regional pattern to firearm theft. Southern states, for example, accounted for over 60% of all incidents of firearm theft from 2017 to 2021, while states in the Northeast accounted for less than 5%. In keeping with these findings, each of the five states with the highest gun theft rates is in the South, while four of the five states with the lowest rates are in the Northeast. (Here is a look at how many guns used to commit crime are traced in every state.)
Semi-automatic pistols are by far the most commonly stolen firearm type, accounting for over 70% of all reported firearm thefts in the U.S. in the last five years. And all of the top five stolen calibers – .45, .22, .380, .40, and 9mm – are widely available in semi-automatic handguns. (Here is a look at the gun calibers most likely to be used for crime in every state.)
Click here to see the states where the most guns are stolen.
Click here to read our detailed methodology.

50. Massachusetts
> Avg. number of guns stolen from private citizens annually: 5.4 per 100,000 people (378 total per year)
> Est. total number of guns stolen from private citizens, 2017-2021: 1,890 (7th fewest of 50 states)
> Stolen guns recovered in state, 2017-2021: 416 (approx. 22.0% of total – 10th smallest share of 50 states)
> Population: 6,991,852
[in-text-ad]

49. New Jersey
> Avg. number of guns stolen from private citizens annually: 6.8 per 100,000 people (629 total per year)
> Est. total number of guns stolen from private citizens, 2017-2021: 3,145 (11th fewest of 50 states)
> Stolen guns recovered in state, 2017-2021: 795 (approx. 25.3% of total – 18th smallest share of 50 states)
> Population: 9,234,024

48. New York
> Avg. number of guns stolen from private citizens annually: 8.9 per 100,000 people (1,766 total per year)
> Est. total number of guns stolen from private citizens, 2017-2021: 8,830 (23rd fewest of 50 states)
> Stolen guns recovered in state, 2017-2021: 1,287 (approx. 14.6% of total – 4th smallest share of 50 states)
> Population: 20,114,745

47. Rhode Island
> Avg. number of guns stolen from private citizens annually: 10.7 per 100,000 people (117 total per year)
> Est. total number of guns stolen from private citizens, 2017-2021: 585 (the fewest of 50 states)
> Stolen guns recovered in state, 2017-2021: 125 (approx. 21.4% of total – 9th smallest share of 50 states)
> Population: 1,091,949
[in-text-ad-2]

46. Hawaii
> Avg. number of guns stolen from private citizens annually: 12.1 per 100,000 people (174 total per year)
> Est. total number of guns stolen from private citizens, 2017-2021: 870 (2nd fewest of 50 states)
> Stolen guns recovered in state, 2017-2021: 118 (approx. 13.6% of total – 2nd smallest share of 50 states)
> Population: 1,453,498

45. Maryland
> Avg. number of guns stolen from private citizens annually: 18.3 per 100,000 people (1,130 total per year)
> Est. total number of guns stolen from private citizens, 2017-2021: 5,650 (17th fewest of 50 states)
> Stolen guns recovered in state, 2017-2021: 1,287 (approx. 22.8% of total – 11th smallest share of 50 states)
> Population: 6,148,545
[in-text-ad]

44. Wisconsin
> Avg. number of guns stolen from private citizens annually: 21.3 per 100,000 people (1,255 total per year)
> Est. total number of guns stolen from private citizens, 2017-2021: 6,275 (19th fewest of 50 states)
> Stolen guns recovered in state, 2017-2021: 05 (approx. 0.1% of total – the smallest share of 50 states)
> Population: 5,871,661

43. California
> Avg. number of guns stolen from private citizens annually: 21.7 per 100,000 people (8,509 total per year)
> Est. total number of guns stolen from private citizens, 2017-2021: 42,545 (5th most of 50 states)
> Stolen guns recovered in state, 2017-2021: 6,274 (approx. 14.7% of total – 5th smallest share of 50 states)
> Population: 39,455,353

42. Connecticut
> Avg. number of guns stolen from private citizens annually: 24.0 per 100,000 people (866 total per year)
> Est. total number of guns stolen from private citizens, 2017-2021: 4,330 (13th fewest of 50 states)
> Stolen guns recovered in state, 2017-2021: 816 (approx. 18.8% of total – 6th smallest share of 50 states)
> Population: 3,605,330
[in-text-ad-2]

41. New Hampshire
> Avg. number of guns stolen from private citizens annually: 26.8 per 100,000 people (372 total per year)
> Est. total number of guns stolen from private citizens, 2017-2021: 1,860 (5th fewest of 50 states)
> Stolen guns recovered in state, 2017-2021: 538 (approx. 28.9% of total – 15th largest share of 50 states)
> Population: 1,372,175

40. Minnesota
> Avg. number of guns stolen from private citizens annually: 27.3 per 100,000 people (1,559 total per year)
> Est. total number of guns stolen from private citizens, 2017-2021: 7,795 (21st fewest of 50 states)
> Stolen guns recovered in state, 2017-2021: 2,275 (approx. 29.2% of total – 12th largest share of 50 states)
> Population: 5,670,472
[in-text-ad]

39. Illinois
> Avg. number of guns stolen from private citizens annually: 33.7 per 100,000 people (4,265 total per year)
> Est. total number of guns stolen from private citizens, 2017-2021: 21,325 (20th most of 50 states)
> Stolen guns recovered in state, 2017-2021: 6,401 (approx. 30.0% of total – 9th largest share of 50 states)
> Population: 12,821,813

38. Nebraska
> Avg. number of guns stolen from private citizens annually: 37.3 per 100,000 people (733 total per year)
> Est. total number of guns stolen from private citizens, 2017-2021: 3,665 (12th fewest of 50 states)
> Stolen guns recovered in state, 2017-2021: 1,310 (approx. 35.7% of total – 3rd largest share of 50 states)
> Population: 1,951,480
37. Delaware
> Avg. number of guns stolen from private citizens annually: 37.8 per 100,000 people (379 total per year)
> Est. total number of guns stolen from private citizens, 2017-2021: 1,895 (8th fewest of 50 states)
> Stolen guns recovered in state, 2017-2021: 455 (approx. 24.0% of total – 13th smallest share of 50 states)
> Population: 981,892
[in-text-ad-2]

36. Vermont
> Avg. number of guns stolen from private citizens annually: 39.1 per 100,000 people (253 total per year)
> Est. total number of guns stolen from private citizens, 2017-2021: 1,265 (3rd fewest of 50 states)
> Stolen guns recovered in state, 2017-2021: 244 (approx. 19.3% of total – 7th smallest share of 50 states)
> Population: 641,637

35. Iowa
> Avg. number of guns stolen from private citizens annually: 39.1 per 100,000 people (1,249 total per year)
> Est. total number of guns stolen from private citizens, 2017-2021: 6,245 (18th fewest of 50 states)
> Stolen guns recovered in state, 2017-2021: 1,706 (approx. 27.3% of total – 20th largest share of 50 states)
> Population: 3,179,090
[in-text-ad]

34. Maine
> Avg. number of guns stolen from private citizens annually: 40.8 per 100,000 people (559 total per year)
> Est. total number of guns stolen from private citizens, 2017-2021: 2,795 (10th fewest of 50 states)
> Stolen guns recovered in state, 2017-2021: 386 (approx. 13.8% of total – 3rd smallest share of 50 states)
> Population: 1,357,046

33. Utah
> Avg. number of guns stolen from private citizens annually: 42.1 per 100,000 people (1,406 total per year)
> Est. total number of guns stolen from private citizens, 2017-2021: 7,030 (20th fewest of 50 states)
> Stolen guns recovered in state, 2017-2021: 2,355 (approx. 33.5% of total – 4th largest share of 50 states)
> Population: 3,231,370

32. Pennsylvania
> Avg. number of guns stolen from private citizens annually: 45.3 per 100,000 people (5,870 total per year)
> Est. total number of guns stolen from private citizens, 2017-2021: 29,350 (13th most of 50 states)
> Stolen guns recovered in state, 2017-2021: 7,886 (approx. 26.9% of total – 24th largest share of 50 states)
> Population: 12,970,650
[in-text-ad-2]
31. North Dakota
> Avg. number of guns stolen from private citizens annually: 45.8 per 100,000 people (355 total per year)
> Est. total number of guns stolen from private citizens, 2017-2021: 1,775 (4th fewest of 50 states)
> Stolen guns recovered in state, 2017-2021: 476 (approx. 26.8% of total – 25th smallest share of 50 states)
> Population: 773,344

30. Washington
> Avg. number of guns stolen from private citizens annually: 52.6 per 100,000 people (4,074 total per year)
> Est. total number of guns stolen from private citizens, 2017-2021: 20,370 (21st most of 50 states)
> Stolen guns recovered in state, 2017-2021: 5,921 (approx. 29.1% of total – 13th largest share of 50 states)
> Population: 7,617,364
[in-text-ad]

29. South Dakota
> Avg. number of guns stolen from private citizens annually: 53.2 per 100,000 people (476 total per year)
> Est. total number of guns stolen from private citizens, 2017-2021: 2,380 (9th fewest of 50 states)
> Stolen guns recovered in state, 2017-2021: 739 (approx. 31.1% of total – 6th largest share of 50 states)
> Population: 881,785

28. Idaho
> Avg. number of guns stolen from private citizens annually: 53.6 per 100,000 people (1,018 total per year)
> Est. total number of guns stolen from private citizens, 2017-2021: 5,090 (16th fewest of 50 states)
> Stolen guns recovered in state, 2017-2021: 1,427 (approx. 28.0% of total – 18th largest share of 50 states)
> Population: 1,811,617

27. Ohio
> Avg. number of guns stolen from private citizens annually: 56.8 per 100,000 people (6,697 total per year)
> Est. total number of guns stolen from private citizens, 2017-2021: 33,485 (11th most of 50 states)
> Stolen guns recovered in state, 2017-2021: 8,700 (approx. 26.0% of total – 20th smallest share of 50 states)
> Population: 11,769,923
[in-text-ad-2]

26. Oregon
> Avg. number of guns stolen from private citizens annually: 57.1 per 100,000 people (2,423 total per year)
> Est. total number of guns stolen from private citizens, 2017-2021: 12,115 (25th most of 50 states)
> Stolen guns recovered in state, 2017-2021: 3,249 (approx. 26.8% of total – 25th largest share of 50 states)
> Population: 4,207,177

25. Colorado
> Avg. number of guns stolen from private citizens annually: 57.4 per 100,000 people (3,336 total per year)
> Est. total number of guns stolen from private citizens, 2017-2021: 16,680 (23rd most of 50 states)
> Stolen guns recovered in state, 2017-2021: 4,075 (approx. 24.4% of total – 15th smallest share of 50 states)
> Population: 5,723,176
[in-text-ad]

24. Virginia
> Avg. number of guns stolen from private citizens annually: 60.4 per 100,000 people (5,224 total per year)
> Est. total number of guns stolen from private citizens, 2017-2021: 26,120 (16th most of 50 states)
> Stolen guns recovered in state, 2017-2021: 6,914 (approx. 26.5% of total – 24th smallest share of 50 states)
> Population: 8,582,479

23. Florida
> Avg. number of guns stolen from private citizens annually: 64.0 per 100,000 people (13,940 total per year)
> Est. total number of guns stolen from private citizens, 2017-2021: 69,700 (3rd most of 50 states)
> Stolen guns recovered in state, 2017-2021: 20,460 (approx. 29.4% of total – 11th largest share of 50 states)
> Population: 21,339,762

22. Michigan
> Avg. number of guns stolen from private citizens annually: 64.3 per 100,000 people (6,462 total per year)
> Est. total number of guns stolen from private citizens, 2017-2021: 32,310 (12th most of 50 states)
> Stolen guns recovered in state, 2017-2021: 8,546 (approx. 26.5% of total – 23rd smallest share of 50 states)
> Population: 10,062,512
[in-text-ad-2]

21. Wyoming
> Avg. number of guns stolen from private citizens annually: 64.7 per 100,000 people (374 total per year)
> Est. total number of guns stolen from private citizens, 2017-2021: 1,870 (6th fewest of 50 states)
> Stolen guns recovered in state, 2017-2021: 551 (approx. 29.5% of total – 10th largest share of 50 states)
> Population: 576,641

20. Arizona
> Avg. number of guns stolen from private citizens annually: 70.0 per 100,000 people (5,090 total per year)
> Est. total number of guns stolen from private citizens, 2017-2021: 25,450 (17th most of 50 states)
> Stolen guns recovered in state, 2017-2021: 7,101 (approx. 27.9% of total – 19th largest share of 50 states)
> Population: 7,079,203
[in-text-ad]

19. Kansas
> Avg. number of guns stolen from private citizens annually: 76.0 per 100,000 people (2,230 total per year)
> Est. total number of guns stolen from private citizens, 2017-2021: 11,150 (24th fewest of 50 states)
> Stolen guns recovered in state, 2017-2021: 2,876 (approx. 25.8% of total – 19th smallest share of 50 states)
> Population: 2,932,099

18. Indiana
> Avg. number of guns stolen from private citizens annually: 77.3 per 100,000 people (5,260 total per year)
> Est. total number of guns stolen from private citizens, 2017-2021: 26,300 (15th most of 50 states)
> Stolen guns recovered in state, 2017-2021: 6,906 (approx. 26.3% of total – 22nd smallest share of 50 states)
> Population: 6,751,340

17. Nevada
> Avg. number of guns stolen from private citizens annually: 83.1 per 100,000 people (2,614 total per year)
> Est. total number of guns stolen from private citizens, 2017-2021: 13,070 (24th most of 50 states)
> Stolen guns recovered in state, 2017-2021: 3,223 (approx. 24.7% of total – 17th smallest share of 50 states)
> Population: 3,059,238
[in-text-ad-2]

16. Texas
> Avg. number of guns stolen from private citizens annually: 85.6 per 100,000 people (25,270 total per year)
> Est. total number of guns stolen from private citizens, 2017-2021: 126,350 (the most of 50 states)
> Stolen guns recovered in state, 2017-2021: 31,098 (approx. 24.6% of total – 16th smallest share of 50 states)
> Population: 28,862,581

15. Montana
> Avg. number of guns stolen from private citizens annually: 88.7 per 100,000 people (980 total per year)
> Est. total number of guns stolen from private citizens, 2017-2021: 4,900 (15th fewest of 50 states)
> Stolen guns recovered in state, 2017-2021: 1,484 (approx. 30.3% of total – 8th largest share of 50 states)
> Population: 1,077,978
[in-text-ad]

14. West Virginia
> Avg. number of guns stolen from private citizens annually: 97.0 per 100,000 people (1,730 total per year)
> Est. total number of guns stolen from private citizens, 2017-2021: 8,650 (22nd fewest of 50 states)
> Stolen guns recovered in state, 2017-2021: 1,703 (approx. 19.7% of total – 8th smallest share of 50 states)
> Population: 1,801,049

13. North Carolina
> Avg. number of guns stolen from private citizens annually: 103.9 per 100,000 people (10,961 total per year)
> Est. total number of guns stolen from private citizens, 2017-2021: 54,805 (4th most of 50 states)
> Stolen guns recovered in state, 2017-2021: 15,859 (approx. 28.9% of total – 14th largest share of 50 states)
> Population: 10,367,022

12. Kentucky
> Avg. number of guns stolen from private citizens annually: 103.9 per 100,000 people (4,684 total per year)
> Est. total number of guns stolen from private citizens, 2017-2021: 23,420 (18th most of 50 states)
> Stolen guns recovered in state, 2017-2021: 8,537 (approx. 36.5% of total – the largest share of 50 states)
> Population: 4,494,141
[in-text-ad-2]

11. New Mexico
> Avg. number of guns stolen from private citizens annually: 106.8 per 100,000 people (2,260 total per year)
> Est. total number of guns stolen from private citizens, 2017-2021: 11,300 (25th fewest of 50 states)
> Stolen guns recovered in state, 2017-2021: 2,689 (approx. 23.8% of total – 12th smallest share of 50 states)
> Population: 2,109,366

10. Oklahoma
> Avg. number of guns stolen from private citizens annually: 111.0 per 100,000 people (4,426 total per year)
> Est. total number of guns stolen from private citizens, 2017-2021: 22,130 (19th most of 50 states)
> Stolen guns recovered in state, 2017-2021: 5,984 (approx. 27.0% of total – 23rd largest share of 50 states)
> Population: 3,948,136
[in-text-ad]

9. Tennessee
> Avg. number of guns stolen from private citizens annually: 116.7 per 100,000 people (8,143 total per year)
> Est. total number of guns stolen from private citizens, 2017-2021: 40,715 (7th most of 50 states)
> Stolen guns recovered in state, 2017-2021: 11,113 (approx. 27.3% of total – 21st largest share of 50 states)
> Population: 6,859,497

8. Missouri
> Avg. number of guns stolen from private citizens annually: 117.9 per 100,000 people (7,270 total per year)
> Est. total number of guns stolen from private citizens, 2017-2021: 36,350 (9th most of 50 states)
> Stolen guns recovered in state, 2017-2021: 10,287 (approx. 28.3% of total – 17th largest share of 50 states)
> Population: 6,141,534

7. Alaska
> Avg. number of guns stolen from private citizens annually: 130.0 per 100,000 people (953 total per year)
> Est. total number of guns stolen from private citizens, 2017-2021: 4,765 (14th fewest of 50 states)
> Stolen guns recovered in state, 2017-2021: 1,725 (approx. 36.2% of total – 2nd largest share of 50 states)
> Population: 735,951
[in-text-ad-2]

6. Arkansas
> Avg. number of guns stolen from private citizens annually: 131.8 per 100,000 people (3,989 total per year)
> Est. total number of guns stolen from private citizens, 2017-2021: 19,945 (22nd most of 50 states)
> Stolen guns recovered in state, 2017-2021: 6,572 (approx. 33.0% of total – 5th largest share of 50 states)
> Population: 3,006,309

5. Georgia
> Avg. number of guns stolen from private citizens annually: 132.3 per 100,000 people (14,288 total per year)
> Est. total number of guns stolen from private citizens, 2017-2021: 71,440 (2nd most of 50 states)
> Stolen guns recovered in state, 2017-2021: 18,708 (approx. 26.2% of total – 21st smallest share of 50 states)
> Population: 10,625,615
[in-text-ad]

4. South Carolina
> Avg. number of guns stolen from private citizens annually: 150.8 per 100,000 people (7,825 total per year)
> Est. total number of guns stolen from private citizens, 2017-2021: 39,125 (8th most of 50 states)
> Stolen guns recovered in state, 2017-2021: 10,666 (approx. 27.3% of total – 22nd largest share of 50 states)
> Population: 5,078,903

3. Louisiana
> Avg. number of guns stolen from private citizens annually: 155.1 per 100,000 people (7,170 total per year)
> Est. total number of guns stolen from private citizens, 2017-2021: 35,850 (10th most of 50 states)
> Stolen guns recovered in state, 2017-2021: 10,919 (approx. 30.5% of total – 7th largest share of 50 states)
> Population: 4,657,305

2. Alabama
> Avg. number of guns stolen from private citizens annually: 165.7 per 100,000 people (8,353 total per year)
> Est. total number of guns stolen from private citizens, 2017-2021: 41,765 (6th most of 50 states)
> Stolen guns recovered in state, 2017-2021: 11,851 (approx. 28.4% of total – 16th largest share of 50 states)
> Population: 4,997,675
[in-text-ad-2]

1. Mississippi
> Avg. number of guns stolen from private citizens annually: 185.1 per 100,000 people (5,460 total per year)
> Est. total number of guns stolen from private citizens, 2017-2021: 27,300 (14th most of 50 states)
> Stolen guns recovered in state, 2017-2021: 6,647 (approx. 24.3% of total – 14th smallest share of 50 states)
> Population: 2,967,023
Methodology
To identify the states where the most guns are stolen per capita, 24/7 Wall St. reviewed data from part five of the Bureau of Alcohol, Tobacco, Firearms, and Explosives report National Firearms Commerce and Trafficking Assessment (NFCTA): Crime Guns – Volume Two. States are ranked by the annual average number of guns stolen from private citizens from 2017 to 2021 for every 100,000 people in the state. Population-adjusted theft figures came from the ATF. Firearms stolen from gun stores and gunmakers were not considered in this ranking.
Data on the total number of stolen firearms that were recovered in each state is also from the ATF.
To calculate the total number of guns stolen from private citizens between 2017 and 2021, we multiplied the average number of guns stolen each year by five. These figures, which are estimates only, were also used to calculate the share of total stolen guns that were recovered.
State population figures are five-year averages from the U.S. Census Bureau’s 2021 American Community Survey. These figures may differ from population estimates used by the ATF for annual, population-adjusted firearm theft figures.
Cash Back Credit Cards Have Never Been This Good
Credit card companies are at war, handing out free rewards and benefits to win the best customers. A good cash back card can be worth thousands of dollars a year in free money, not to mention other perks like travel, insurance, and access to fancy lounges. See our top picks for the best credit cards today. You won’t want to miss some of these offers.
Flywheel Publishing has partnered with CardRatings for our coverage of credit card products. Flywheel Publishing and CardRatings may receive a commission from card issuers.
Thank you for reading! Have some feedback for us?
Contact the 24/7 Wall St. editorial team.
 24/7 Wall St.
 24/7 Wall St.
 24/7 Wall St.
 24/7 Wall St.
 24/7 Wall St.