Special Report
25 American Cities Where Police Are Funded Better Than Health and Social Services

Published:

Since the murder of George Floyd at the hands of police in summer 2020 and subsequent protests in the U.S. and around the world, a growing number of activists have called on governments to divest funding from police departments and reinvest funding into health care and social support programs. While calls to “defund the police” have dwindled since 2020 and police budgets have largely remained unchanged, the debates of the last few years have put city budgets under increased scrutiny from the public.
Most U.S. cities spend more on police, corrections, and related institutions than on programs related to resident welfare. Researchers have found that increases in policing and correctional expenditures tend to occur in tandem with decreases in welfare spending, often at the expense of programs dedicated to housing, education, and mental health.
To determine which cities prioritize police over health and support systems the most, 24/7 Wall St. reviewed data on municipal spending from Health in Justice Action Lab, an initiative of the Center for Health Policy and Law of Northeastern University. We first ranked the 50 largest U.S. cities by population based on the initiative’s 2020 Carceral Resource Index – a composite measure that compares municipal expenditures on health and social support with expenditures on carceral systems.
Carceral systems include police, courts, jails, and related services. Health and social support systems include health and human services, public health, parks and recreation, housing and employment assistance, and more. The Carceral Resource Index, or CRI, value ranges between -1 and 1, with higher numbers denoting budget prioritization of health and support systems over carceral systems. We chose the 25 cities with the lowest CRI values, meaning the ones that spend considerably more on law enforcement and punishment systems relative to health and social ones.
Across the United States, spending on carceral institutions is roughly twice the expenditure on welfare systems. In 2020, expenditures on health and support systems outweighed carceral expenditures in just seven of the 50 largest U.S. cities. In at least a dozen major cities, for every $1 spent on health and support, $5 or more are spent on carceral systems. In Kansas City, Missouri, where police the police budget is the most outsized relative to welfare, carceral expenditures outweigh health and support expenditures by a ratio of 20 to 1. (These are the largest police departments in the U.S.)
Many of the cities where police budgets are the largest relative to welfare spending have large disparities in other socioeconomic measures. In Chicago, for example, 64.3% of the Black population lives in majority-Black neighborhoods, making it one of the most segregated cities nationwide. Click here to see the most segregated cities in America.
Click here to see our detailed methodology.

25. Minneapolis, MN
> Carceral Resource Index (-1 to 1): -0.56 (lower values mean higher law enforcement and punishment budget priority)
> Carceral spending: $202.3 million
> Health and support spending: $56.9 million
> Total population: 425,091
[in-text-ad]
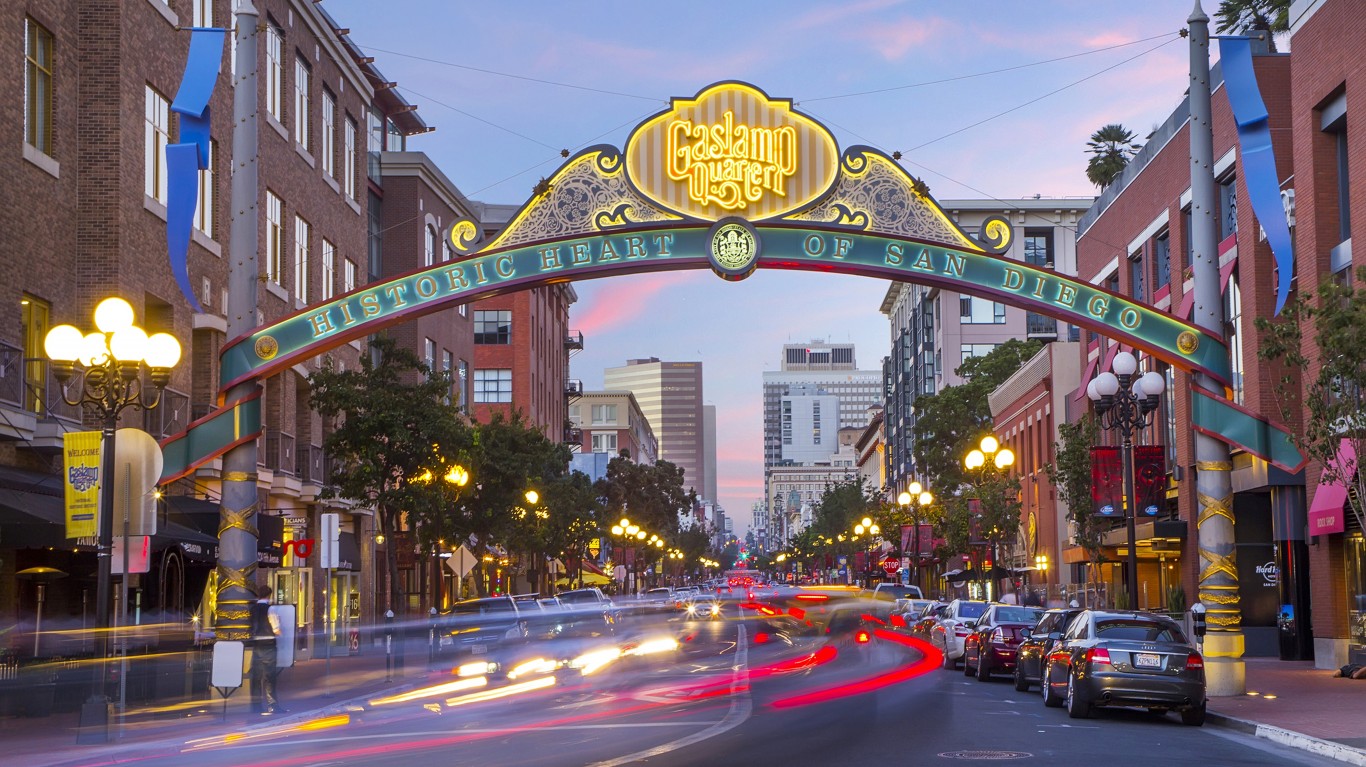
24. San Diego, CA
> Carceral Resource Index value (-1 to 1): -0.57 (lower values mean higher law enforcement and punishment budget priority)
> Carceral spending: $560.4 million
> Health and support spending: $152.6 million
> Total population: 1.4 million

23. Mesa, AZ
> Carceral Resource Index value (-1 to 1): -0.57 (lower values mean higher law enforcement and punishment budget priority)
> Carceral spending: $179.7 million
> Health and support spending: $48.7 million
> Total population: 497,752

22. Jacksonville, FL
> Carceral Resource Index value (-1 to 1): -0.57 (lower values mean higher law enforcement and punishment budget priority)
> Carceral spending: $493.7 million
> Health and support spending: $133.8 million
> Total population: 937,690
[in-text-ad-2]

21. Tulsa, OK
> Carceral Resource Index value (-1 to 1): -0.58 (lower values mean higher law enforcement and punishment budget priority)
> Carceral spending: $104.7 million
> Health and support spending: $28.1 million
> Total population: 410,652
20. San Antonio, TX
> Carceral Resource Index value (-1 to 1): -0.58 (lower values mean higher law enforcement and punishment budget priority)
> Carceral spending: $512.7 million
> Health and support spending: $137.1 million
> Total population: 1.4 million
[in-text-ad]
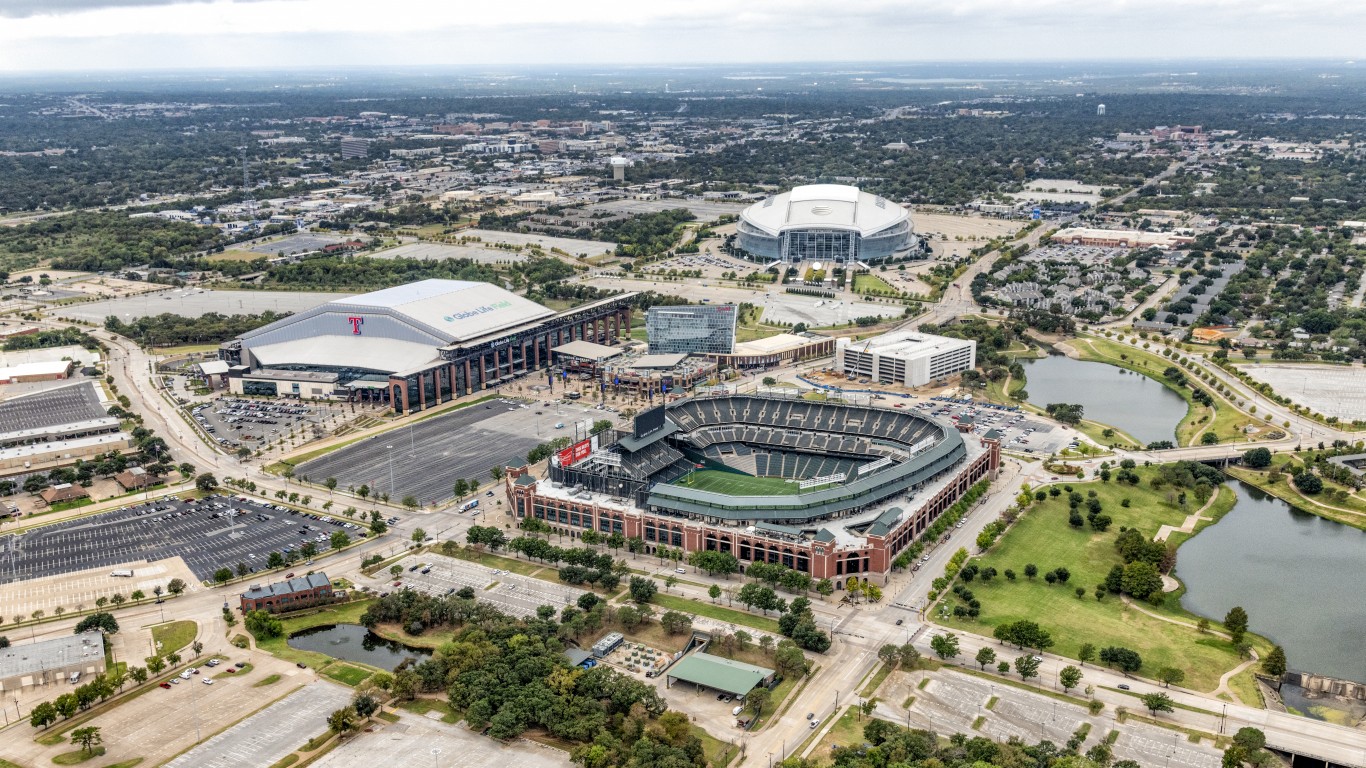
19. Arlington, TX
> Carceral Resource Index value (-1 to 1): -0.60 (lower values mean higher law enforcement and punishment budget priority)
> Carceral spending: $121.4 million
> Health and support spending: $30.5 million
> Total population: 392,304

18. Phoenix, AZ
> Carceral Resource Index value (-1 to 1): -0.60 (lower values mean higher law enforcement and punishment budget priority)
> Carceral spending: $603.1 million
> Health and support spending: $148.7 million
> Total population: 1.6 million

17. Bakersfield, CA
> Carceral Resource Index value (-1 to 1): -0.60 (lower values mean higher law enforcement and punishment budget priority)
> Carceral spending: $96.9 million
> Health and support spending: $23.9 million
> Total population: 398,756
[in-text-ad-2]

16. Las Vegas, NV
> Carceral Resource Index value (-1 to 1): -0.61 (lower values mean higher law enforcement and punishment budget priority)
> Carceral spending: $269.6 million
> Health and support spending: $64.3 million
> Total population: 634,786

15. Sacramento, CA
> Carceral Resource Index value (-1 to 1): -0.62 (lower values mean higher law enforcement and punishment budget priority)
> Carceral spending: $149.8 million
> Health and support spending: $35.5 million
> Total population: 518,605
[in-text-ad]

14. Oakland, CA
> Carceral Resource Index value (-1 to 1): -0.63 (lower values mean higher law enforcement and punishment budget priority)
> Carceral spending: $295.2 million
> Health and support spending: $66.3 million
> Total population: 437,548

13. Colorado Springs, CO
> Carceral Resource Index value (-1 to 1): -0.65 (lower values mean higher law enforcement and punishment budget priority)
> Carceral spending: $117.4 million
> Health and support spending: $25.0 million
> Total population: 475,282

12. Atlanta, GA
> Carceral Resource Index value (-1 to 1): -0.65 (lower values mean higher law enforcement and punishment budget priority)
> Carceral spending: $250.5 million
> Health and support spending: $52.9 million
> Total population: 492,204
[in-text-ad-2]

11. Oklahoma City, OK
> Carceral Resource Index value (-1 to 1): -0.67 (lower values mean higher law enforcement and punishment budget priority)
> Carceral spending: $163.6 million
> Health and support spending: $32.6 million
> Total population: 673,183

10. Tucson, AZ
> Carceral Resource Index value (-1 to 1): -0.68 (lower values mean higher law enforcement and punishment budget priority)
> Carceral spending: $184.1 million
> Health and support spending: $35.0 million
> Total population: 538,167
[in-text-ad]

9. Memphis, TN
> Carceral Resource Index value (-1 to 1): -0.69 (lower values mean higher law enforcement and punishment budget priority)
> Carceral spending: $279.6 million
> Health and support spending: $50.6 million
> Total population: 634,139

8. Indianapolis, IN
> Carceral Resource Index value (-1 to 1): -0.72 (lower values mean higher law enforcement and punishment budget priority)
> Carceral spending: $241.2 million
> Health and support spending: $40.1 million
> Total population: 880,104
7. Houston, TX
> Carceral Resource Index value (-1 to 1): -0.73 (lower values mean higher law enforcement and punishment budget priority)
> Carceral spending: $932.9 million
> Health and support spending: $148.6 million
> Total population: 2.3 million
[in-text-ad-2]

6. Long Beach, CA
> Carceral Resource Index value (-1 to 1): -0.73 (lower values mean higher law enforcement and punishment budget priority)
> Carceral spending: $250.2 million
> Health and support spending: $39.1 million
> Total population: 466,565

5. Charlotte, NC
> Carceral Resource Index value (-1 to 1): -0.74 (lower values mean higher law enforcement and punishment budget priority)
> Carceral spending: $285.2 million
> Health and support spending: $43.4 million
> Total population: 864,871
[in-text-ad]
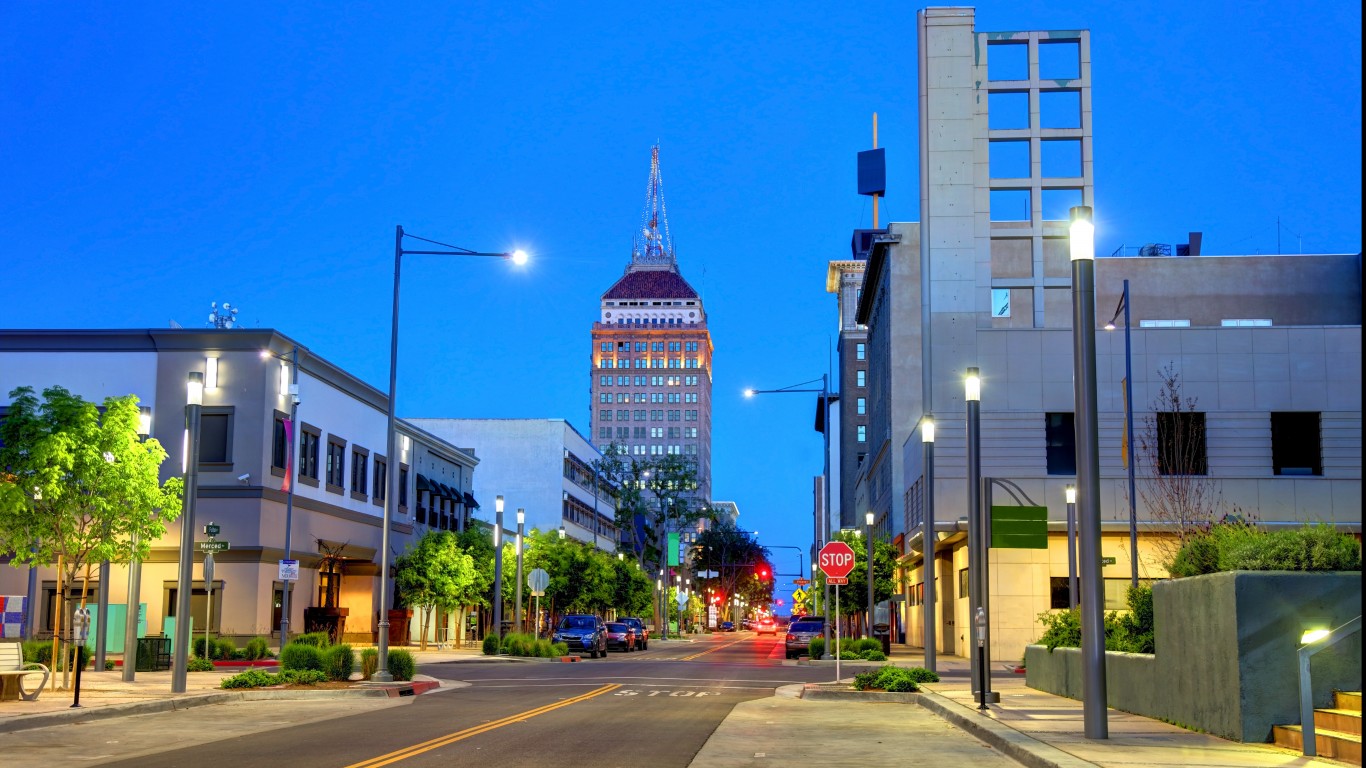
4. Fresno, CA
> Carceral Resource Index value (-1 to 1): -0.80 (lower values mean higher law enforcement and punishment budget priority)
> Carceral spending: $184.8 million
> Health and support spending: $20.0 million
> Total population: 538,678

3. Chicago, IL
> Carceral Resource Index value (-1 to 1): -0.82 (lower values mean higher law enforcement and punishment budget priority)
> Carceral spending: $6.7 billion
> Health and support spending: $670.7 million
> Total population: 2.7 million

2. Columbus, OH
> Carceral Resource Index value (-1 to 1): -0.87 (lower values mean higher law enforcement and punishment budget priority)
> Carceral spending: $385.5 million
> Health and support spending: $26.8 million
> Total population: 898,143
[in-text-ad-2]

1. Kansas City, MO
> Carceral Resource Index value (-1 to 1): -0.91 (lower values mean higher law enforcement and punishment budget priority)
> Carceral spending: $246.7 million
> Health and support spending: $12.2 million
> Total population: 502,597
Methodology
To determine the cities prioritizing police more than health and support services, 24/7 Wall St. reviewed data on municipal spending from the Health in Justice Action Lab of Northeastern University. The 50 largest U.S. cities by population were ranked based on the Health in Justice Action Lab’s 2020 Carceral Resource Index – a composite measure of the contrast between municipal expenditures on health and social support versus carceral systems. CRI values are normalized on a scale of -1 to 1, where a higher number indicates greater prioritization of health and support systems over carceral expenditures in the 2020 fiscal year, and vice versa. We then chose the 25 cities with the lowest CRI values.
Data on city spending by category in 2020 also came from the Health in Justice Action Lab. Carceral spending includes expenditure on police, sheriffs, courts, prosecutors, public defenders, jails and community supervision programs. Health and support spending includes health and human services, public health, parks and recreation, housing assistance, employment assistance, civic and community engagement, and arts and culture. Supplemental data on total population came from the U.S. Census Bureau’s 2021 American Community Survey and are five-year estimates.
Start by taking a quick retirement quiz from SmartAsset that will match you with up to 3 financial advisors that serve your area and beyond in 5 minutes, or less.
Each advisor has been vetted by SmartAsset and is held to a fiduciary standard to act in your best interests.
Here’s how it works:
1. Answer SmartAsset advisor match quiz
2. Review your pre-screened matches at your leisure. Check out the advisors’ profiles.
3. Speak with advisors at no cost to you. Have an introductory call on the phone or introduction in person and choose whom to work with in the future
Get started right here.
Thank you for reading! Have some feedback for us?
Contact the 24/7 Wall St. editorial team.