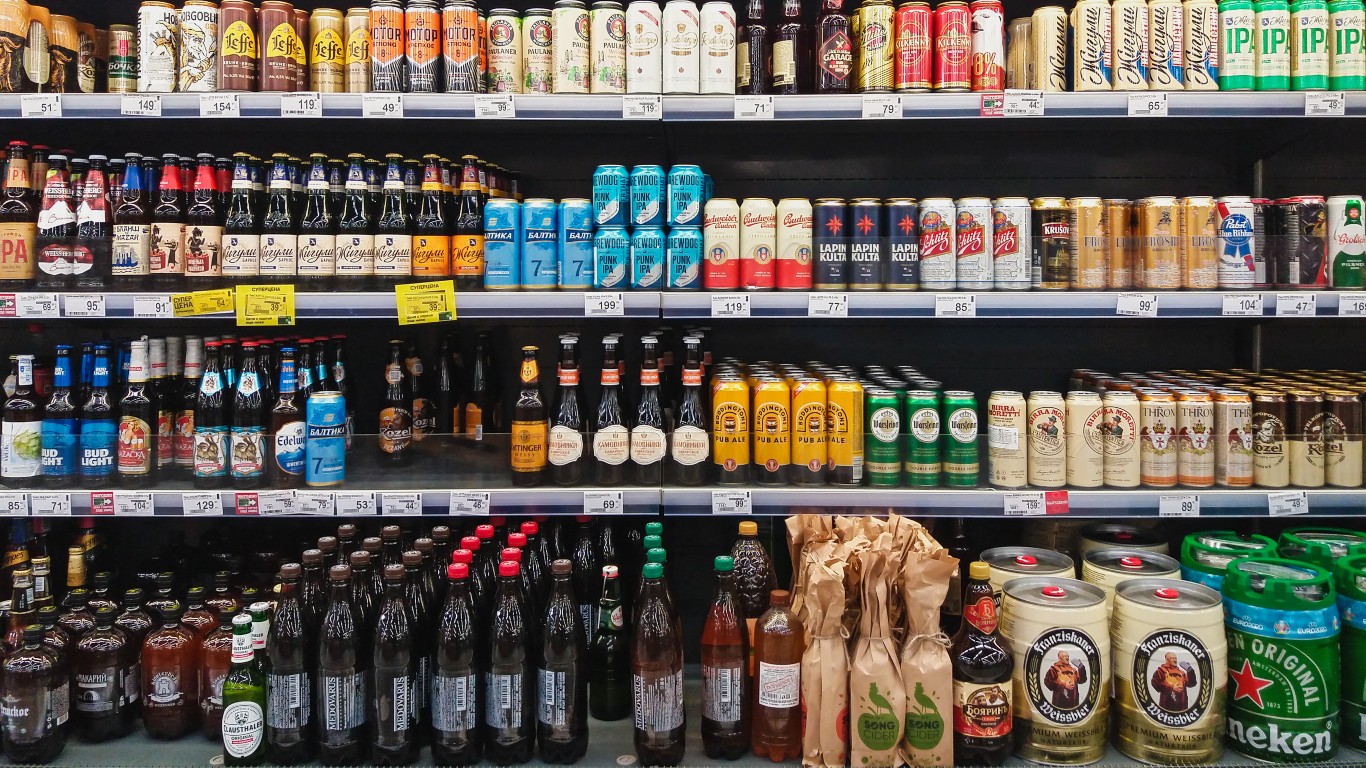
One in six U.S. adults indulges in binge drinking on a single occasion, according to the Centers for Disease Control and Prevention. The CDC defines binge drinking as consuming five or more drinks on a single occasion for men or four or more drinks on a single occasion for women.
Like overall alcohol usage, the prevalence of binge drinking varies considerably from state to state. To identify the states with the highest excessive drinking rates, 24/7 Tempo reviewed on the percentage of adults 18 and older who reported binge or heavy drinking within a 30-day period across all metro areas in the country from the 2023 County Health Rankings & Roadmaps, a Robert Wood Johnson Foundation and University of Wisconsin Population Health Institute joint program.
The share of driving deaths that involve alcohol and the metro area with the highest percentage of adults drinking excessively were aggregated from county-level data in the same source and are for the most recent years available. Median household income comes from the U.S. Census Bureau’s 2021 American Community Survey.
Excessive drinking has the potential for serious health consequences. It can lead to chronic conditions such as liver disease, cancer, heart disease, and hypertension. Binge drinking also raises the danger of motor-vehicle accidents. (Deaths from alcohol-related cirrhosis have gone up almost every year since 2000.)
Adults drink excessively at a national average rate of 19.8%, and those in exactly half of the 50 states drink at that rate or above. The drunkest states in America are those in the Plains, Midwest, and Far West. Three of the four states with the highest incidence of alcohol-related driving deaths are Montana, North Dakota, and Alaska. These are also some of America’s largest states by size and areas that experience the coldest weather in the U.S., which may encourage alcohol consumption. Other cold-weather states among the top 10 binge-drinkers on this list are Massachusetts and Vermont. (On a more granular level, these are the drunkest cities in America.)
Click here for a list of the drunkest states in America
Seven of the 10 states with the lowest binge-drinking rates are in the South. Mississippi, the fifth-lowest excessive-drinking state at 15.9%, has the lowest rate of alcohol-related driving deaths at 18.5%. All of the Southern states at the low end of excessive drinking rates also have the lowest median incomes in the nation. Utah has by far the lowest incidence of binge drinking at 11.9%. The state has a large Mormon population that does not drink alcohol.
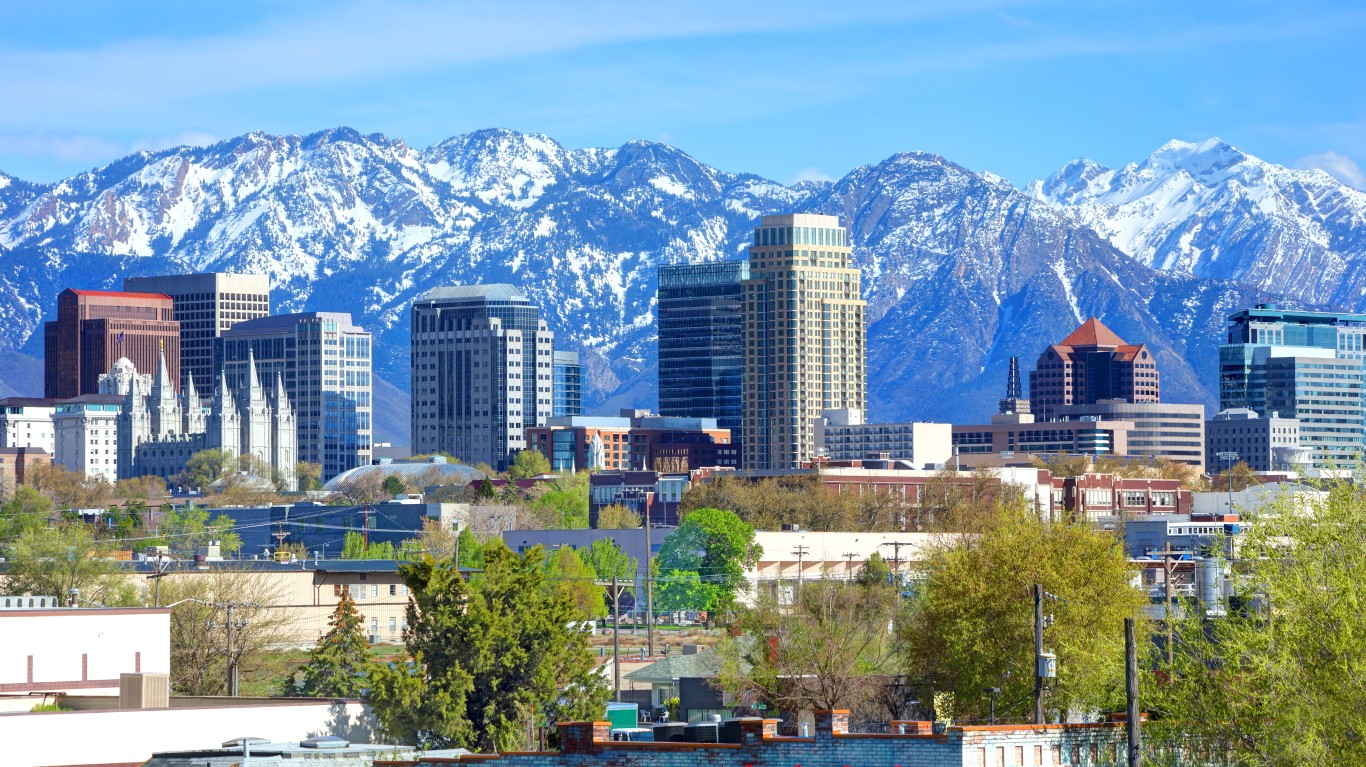
50. Utah
> Adults drinking excessively: 11.9% (US rate: 19.8%)
> Alcohol-related driving deaths: 21.7% — 6th lowest (US rate: 26.6%)
> Median household income: $79,449 — 11th highest (US median: $69,717)
> Drunkest metro area in Utah: Salt Lake City (14.1% of adult residents drinking excessively)
[in-text-ad]

49. Oklahoma
> Adults drinking excessively: 14.5% (US rate: 19.8%)
> Alcohol-related driving deaths: 26.8% — 20th lowest (US rate: 26.6%)
> Median household income: $55,826 — 8th lowest (US median: $69,717)
> Drunkest metro area in Oklahoma: Oklahoma City (15.5% of adult residents drinking excessively)

48. Alabama
> Adults drinking excessively: 14.8% (US rate: 19.8%)
> Alcohol-related driving deaths: 25.9% — 17th lowest (US rate: 26.6%)
> Median household income: $53,913 — 5th lowest (US median: $69,717)
> Drunkest metro area in Alabama: Daphne-Fairhope-Foley (21.5% of adult residents drinking excessively)
47. West Virginia
> Adults drinking excessively: 15.2% (US rate: 19.8%)
> Alcohol-related driving deaths: 26.1% — 18th lowest (US rate: 26.6%)
> Median household income: $51,248 — 2nd lowest (US median: $69,717)
> Drunkest metro area in West Virginia: Weirton-Steubenville (17.8% of adult residents drinking excessively)
[in-text-ad-2]

46. Mississippi
> Adults drinking excessively: 15.9% (US rate: 19.8%)
> Alcohol-related driving deaths: 18.5% — the lowest (US rate: 26.6%)
> Median household income: $48,716 — the lowest (US median: $69,717)
> Drunkest metro area in Mississippi: Gulfport-Biloxi (16.1% of adult residents drinking excessively)
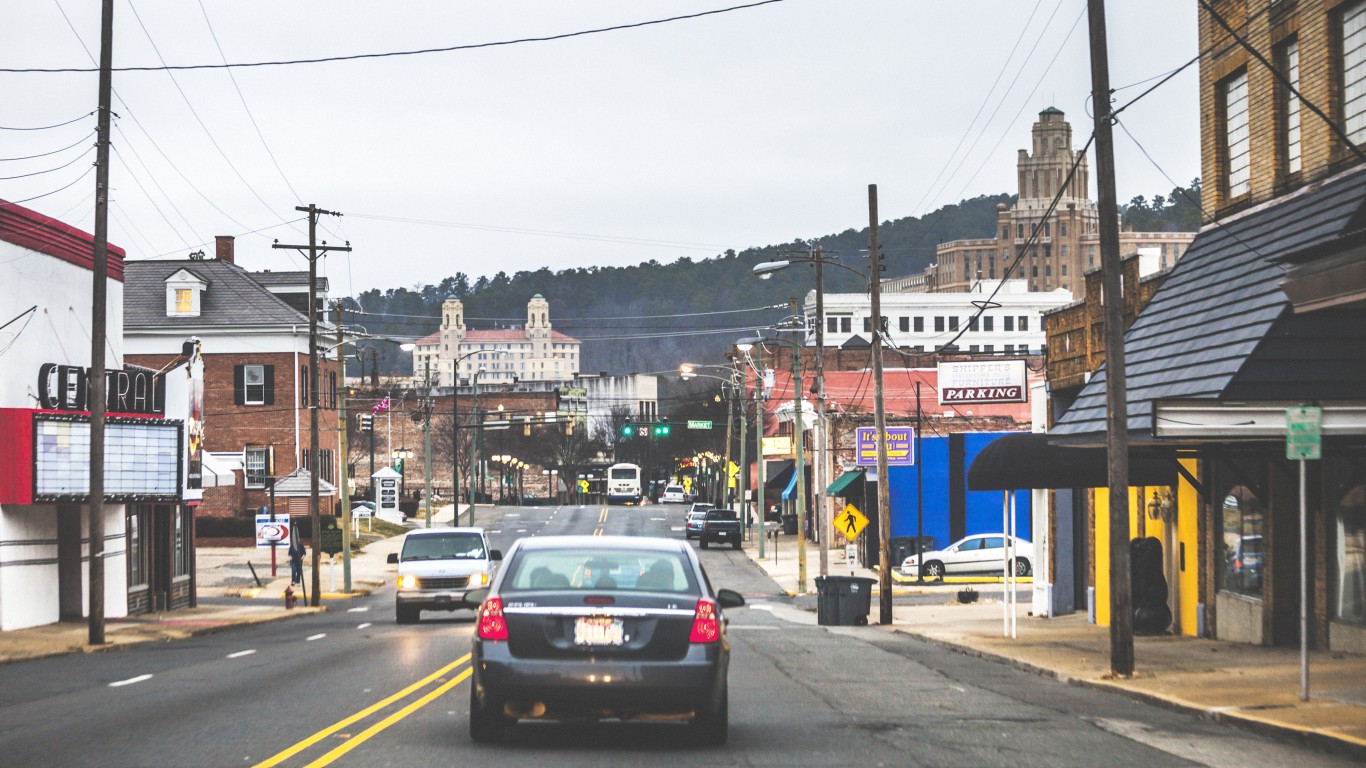
45. Arkansas
> Adults drinking excessively: 15.9% (US rate: 19.8%)
> Alcohol-related driving deaths: 25.7% — 15th lowest (US rate: 26.6%)
> Median household income: $52,528 — 4th lowest (US median: $69,717)
> Drunkest metro area in Arkansas: Hot Springs (17.8% of adult residents drinking excessively)
[in-text-ad]
44. Maryland
> Adults drinking excessively: 16.0% (US rate: 19.8%)
> Alcohol-related driving deaths: 28.3% — 25th lowest (US rate: 26.6%)
> Median household income: $90,203 — the highest (US median: $69,717)
> Drunkest metro area in Maryland: California-Lexington Park (19.7% of adult residents drinking excessively)
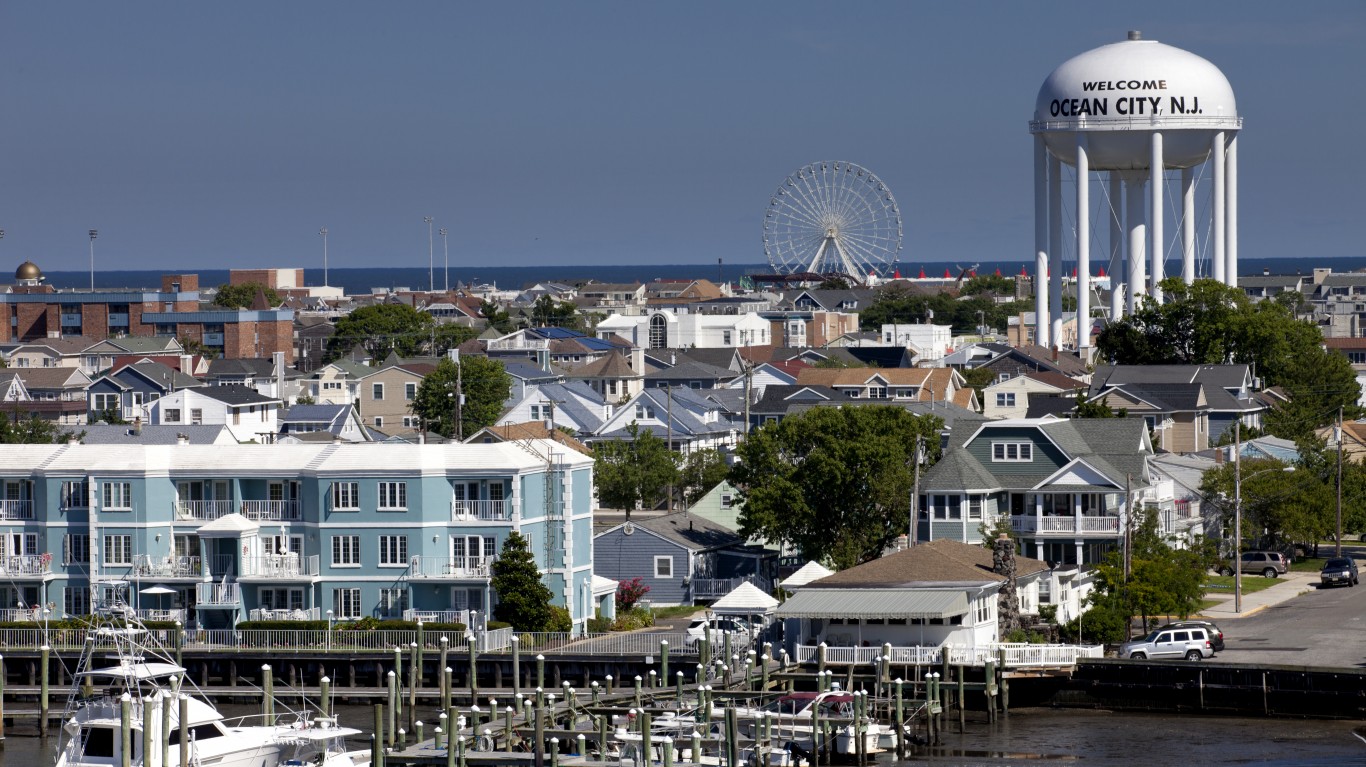
43. New Jersey
> Adults drinking excessively: 16.0% (US rate: 19.8%)
> Alcohol-related driving deaths: 22.8% — 9th lowest (US rate: 26.6%)
> Median household income: $89,296 — 3rd highest (US median: $69,717)
> Drunkest metro area in New Jersey: Ocean City (21.4% of adult residents drinking excessively)
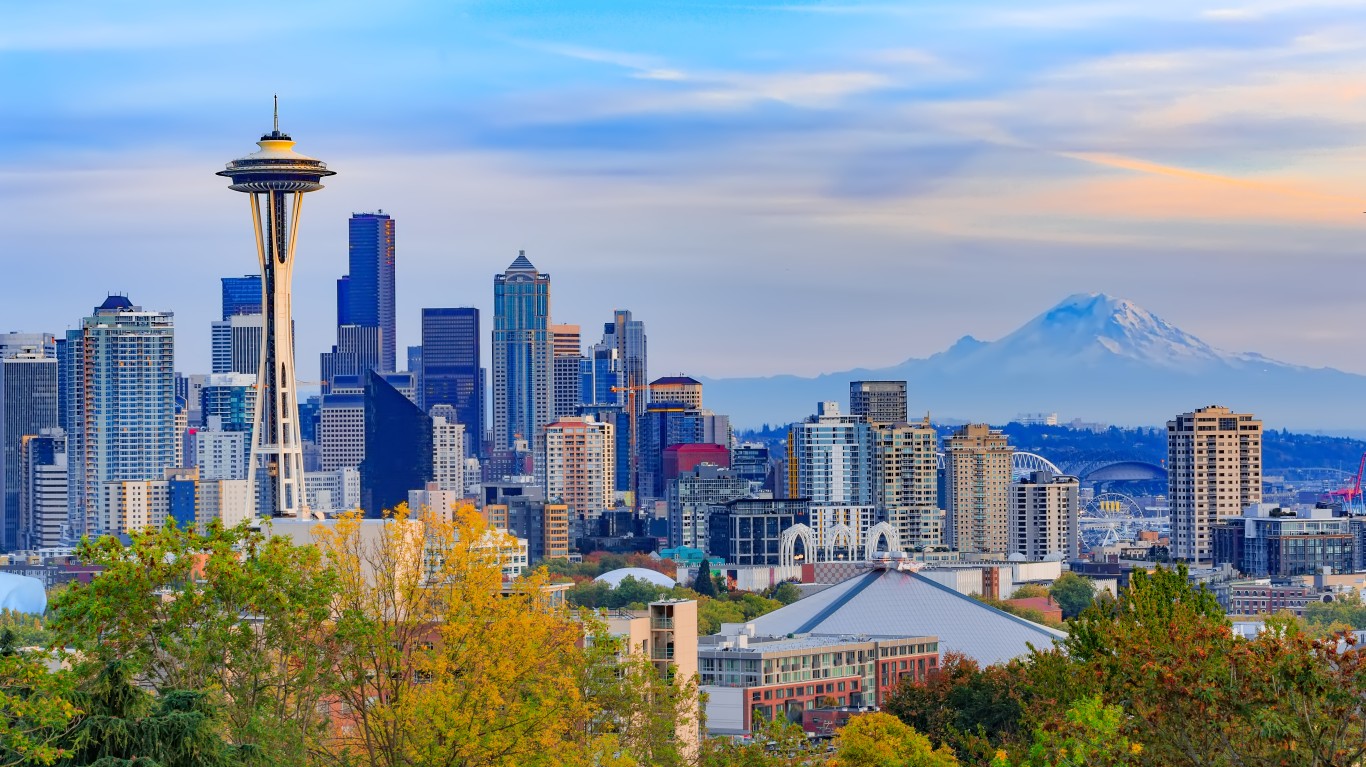
42. Washington
> Adults drinking excessively: 16.5% (US rate: 19.8%)
> Alcohol-related driving deaths: 32.7% — 13th highest (US rate: 26.6%)
> Median household income: $84,247 — 7th highest (US median: $69,717)
> Drunkest metro area in Washington: Seattle-Tacoma-Bellevue (18.7% of adult residents drinking excessively)
[in-text-ad-2]

41. North Carolina
> Adults drinking excessively: 16.5% (US rate: 19.8%)
> Alcohol-related driving deaths: 25.9% — 16th lowest (US rate: 26.6%)
> Median household income: $61,972 — 12th lowest (US median: $69,717)
> Drunkest metro area in North Carolina: Raleigh-Cary (20.0% of adult residents drinking excessively)

40. Tennessee
> Adults drinking excessively: 17.2% (US rate: 19.8%)
> Alcohol-related driving deaths: 23.5% — 10th lowest (US rate: 26.6%)
> Median household income: $59,695 — 10th lowest (US median: $69,717)
> Drunkest metro area in Tennessee: Chattanooga (18.5% of adult residents drinking excessively)
[in-text-ad]

39. Virginia
> Adults drinking excessively: 17.3% (US rate: 19.8%)
> Alcohol-related driving deaths: 30.3% — 21st highest (US rate: 26.6%)
> Median household income: $80,963 — 10th highest (US median: $69,717)
> Drunkest metro area in Virginia: Charlottesville (20.0% of adult residents drinking excessively)
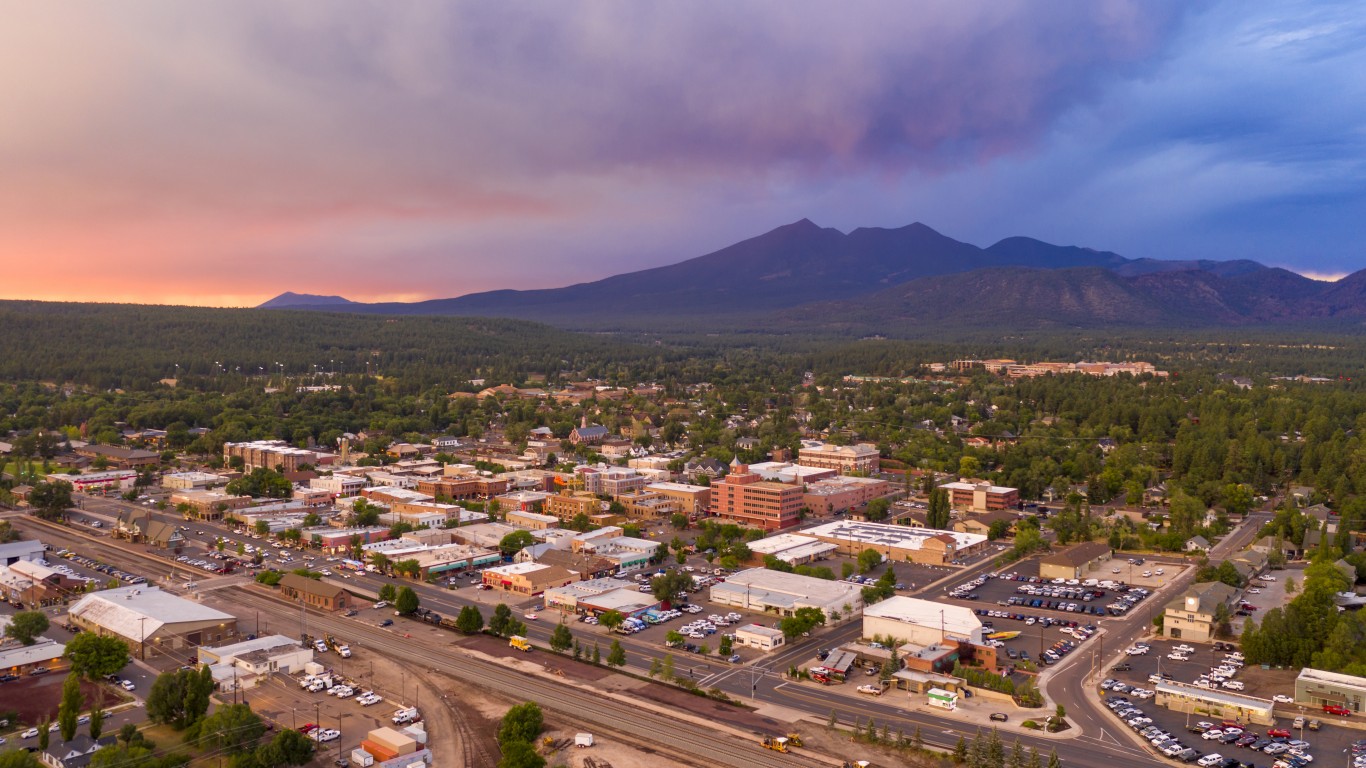
38. Arizona
> Adults drinking excessively: 17.4% (US rate: 19.8%)
> Alcohol-related driving deaths: 22.3% — 8th lowest (US rate: 26.6%)
> Median household income: $69,056 — 20th highest (US median: $69,717)
> Drunkest metro area in Arizona: Flagstaff (20.5% of adult residents drinking excessively)
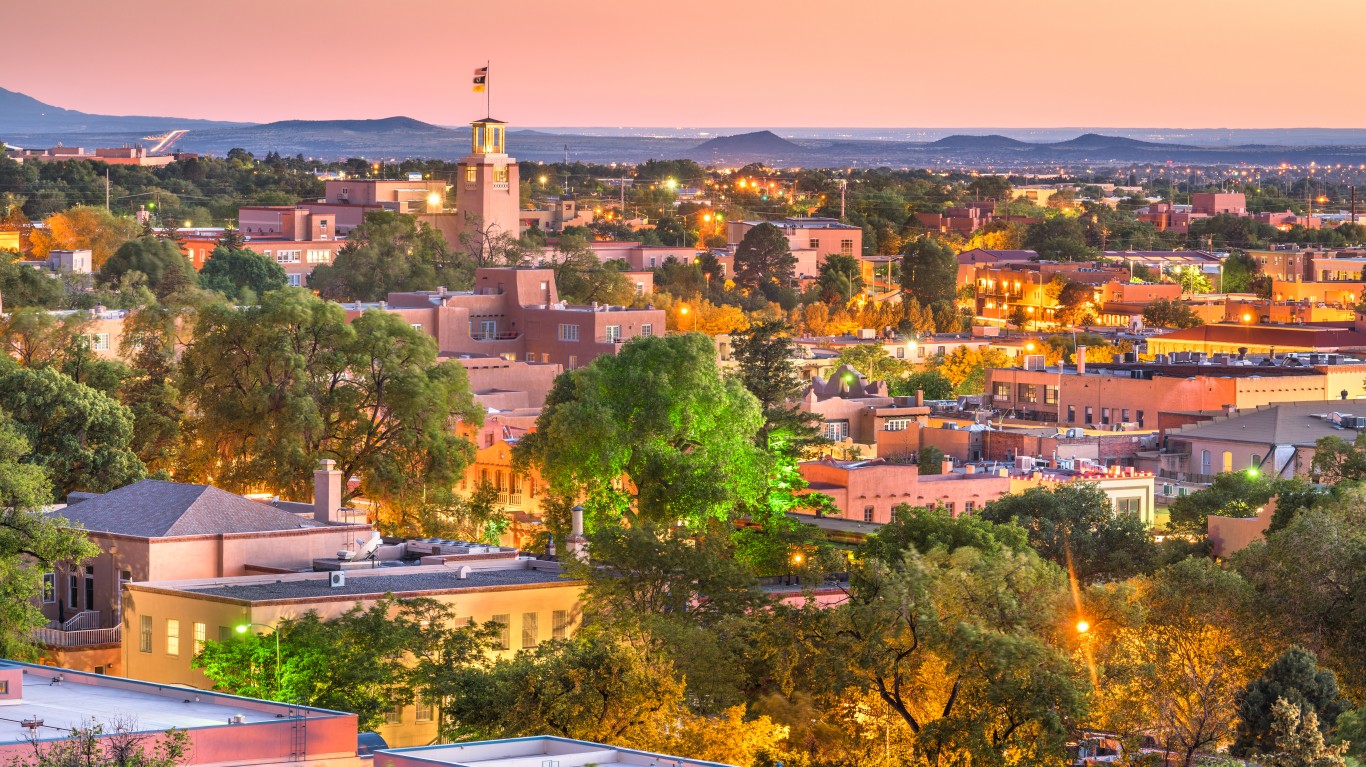
37. New Mexico
> Adults drinking excessively: 17.4% (US rate: 19.8%)
> Alcohol-related driving deaths: 29.4% — 23rd highest (US rate: 26.6%)
> Median household income: $53,992 — 6th lowest (US median: $69,717)
> Drunkest metro area in New Mexico: Santa Fe (18.5% of adult residents drinking excessively)
[in-text-ad-2]
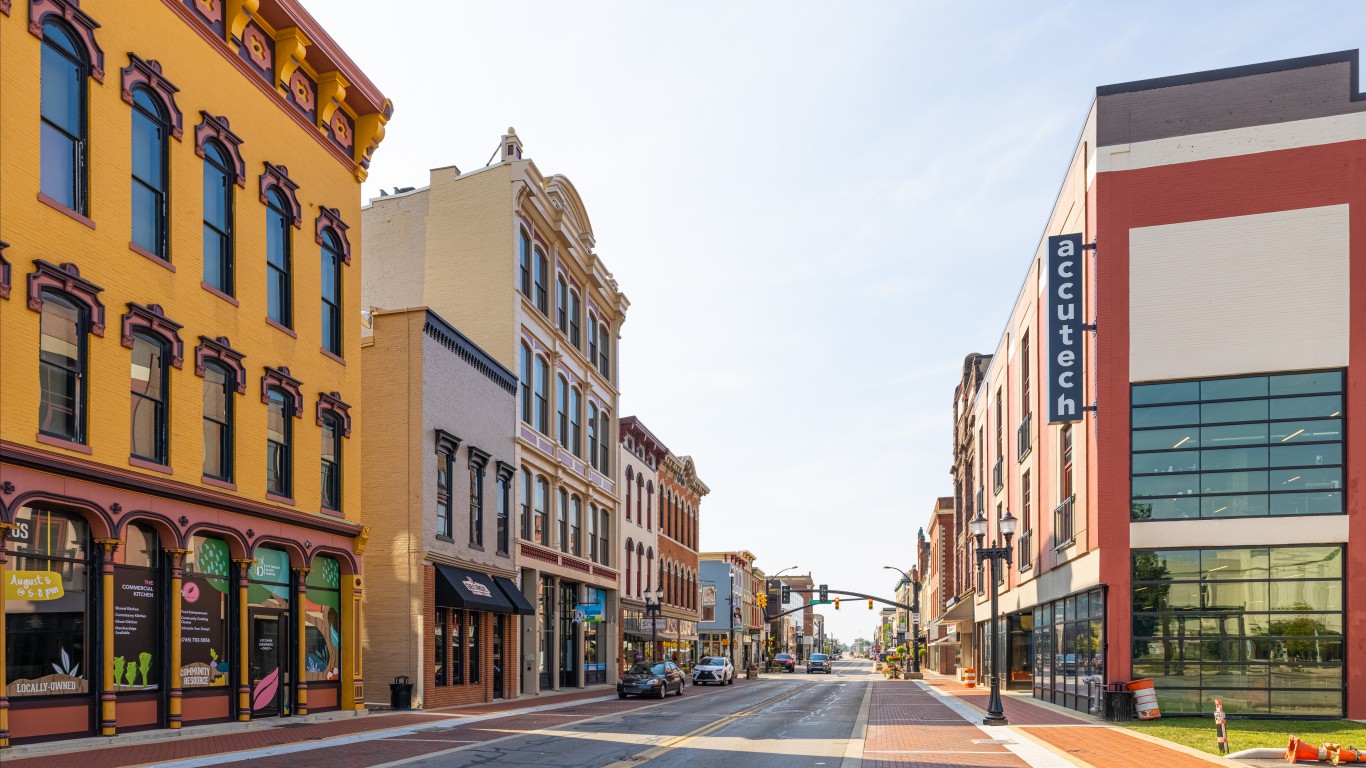
36. Indiana
> Adults drinking excessively: 17.7% (US rate: 19.8%)
> Alcohol-related driving deaths: 19.0% — 2nd lowest (US rate: 26.6%)
> Median household income: $62,743 — 14th lowest (US median: $69,717)
> Drunkest metro area in Indiana: Muncie (19.4% of adult residents drinking excessively)

35. Georgia
> Adults drinking excessively: 17.8% (US rate: 19.8%)
> Alcohol-related driving deaths: 20.7% — 5th lowest (US rate: 26.6%)
> Median household income: $66,559 — 25th highest (US median: $69,717)
> Drunkest metro area in Georgia: Augusta-Richmond County (19.1% of adult residents drinking excessively)
[in-text-ad]
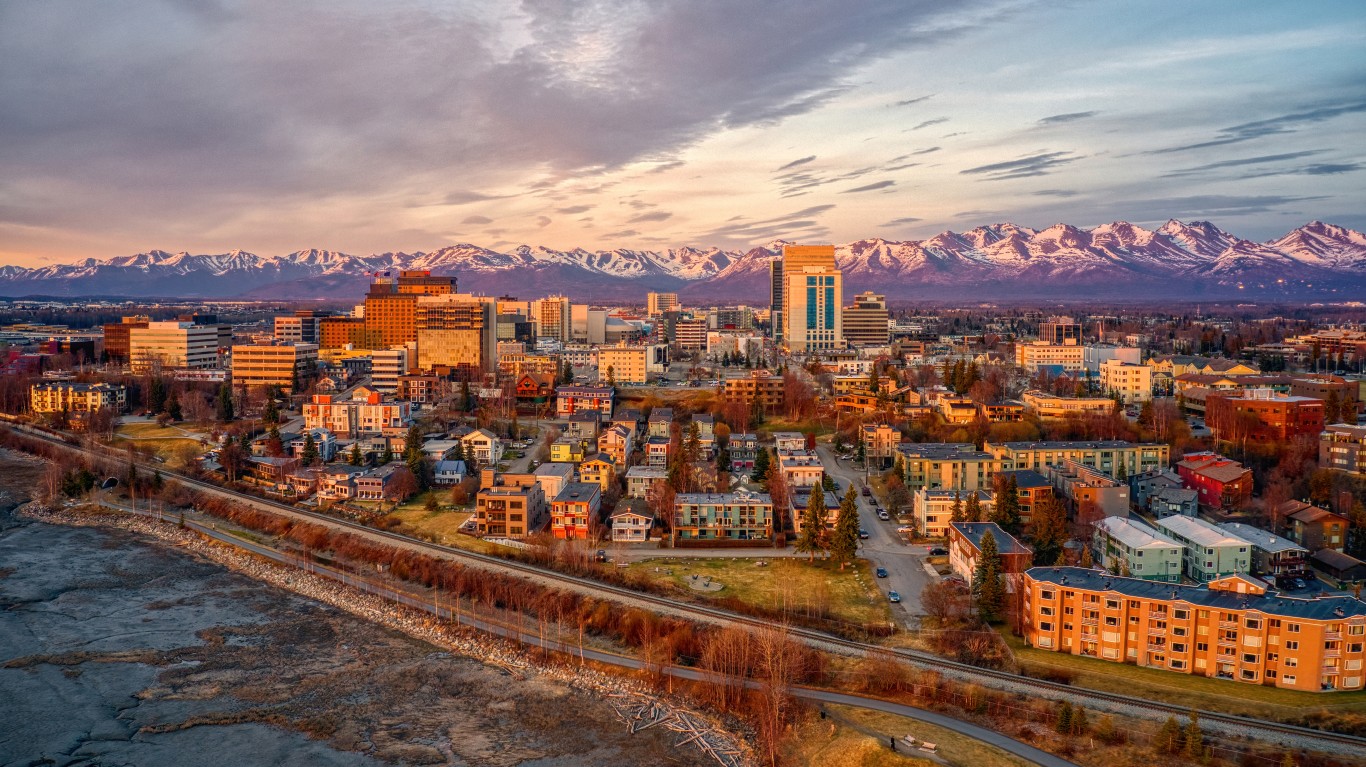
34. Alaska
> Adults drinking excessively: 18.1% (US rate: 19.8%)
> Alcohol-related driving deaths: 36.9% — 4th highest (US rate: 26.6%)
> Median household income: $77,845 — 12th highest (US median: $69,717)
> Drunkest metro area in Alaska: Anchorage (20.8% of adult residents drinking excessively)
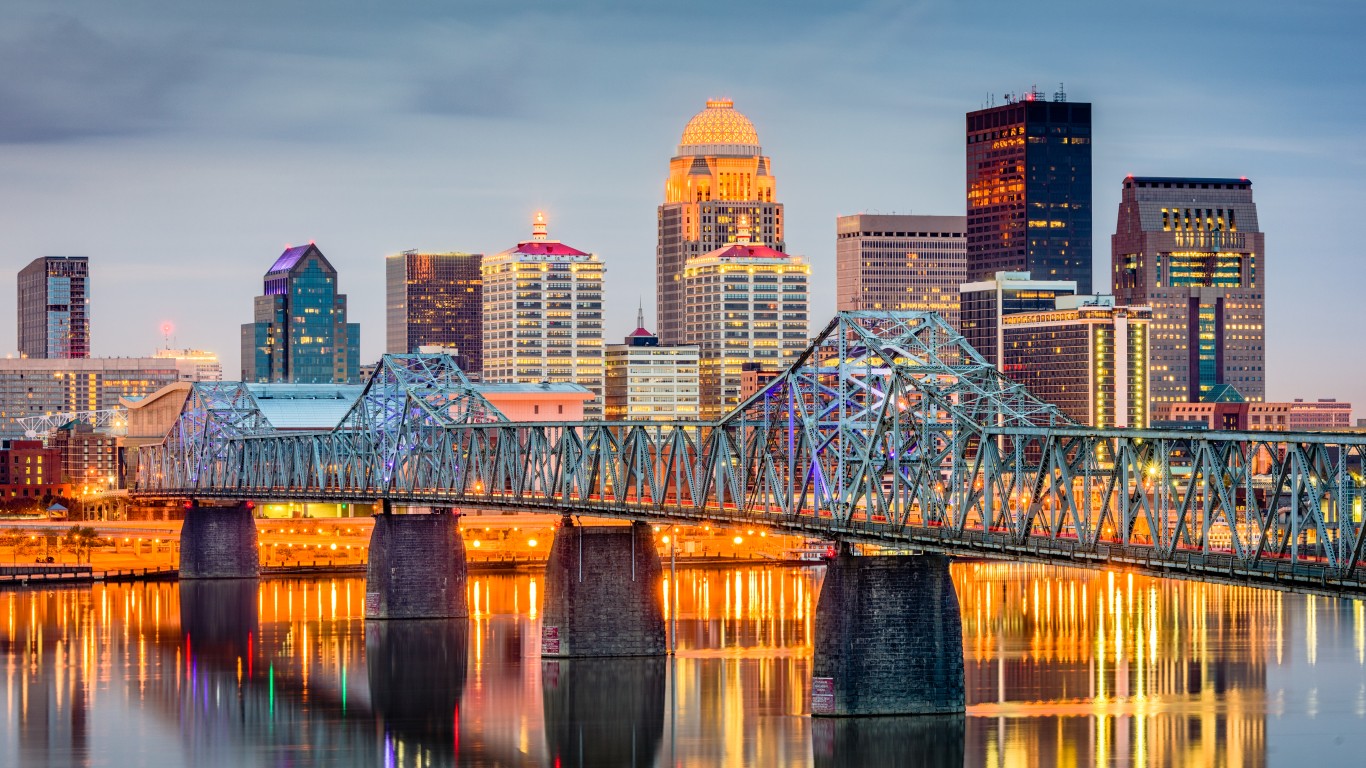
33. Kentucky
> Adults drinking excessively: 18.2% (US rate: 19.8%)
> Alcohol-related driving deaths: 25.5% — 14th lowest (US rate: 26.6%)
> Median household income: $55,573 — 7th lowest (US median: $69,717)
> Drunkest metro area in Kentucky: Louisville/Jefferson County (19.0% of adult residents drinking excessively)
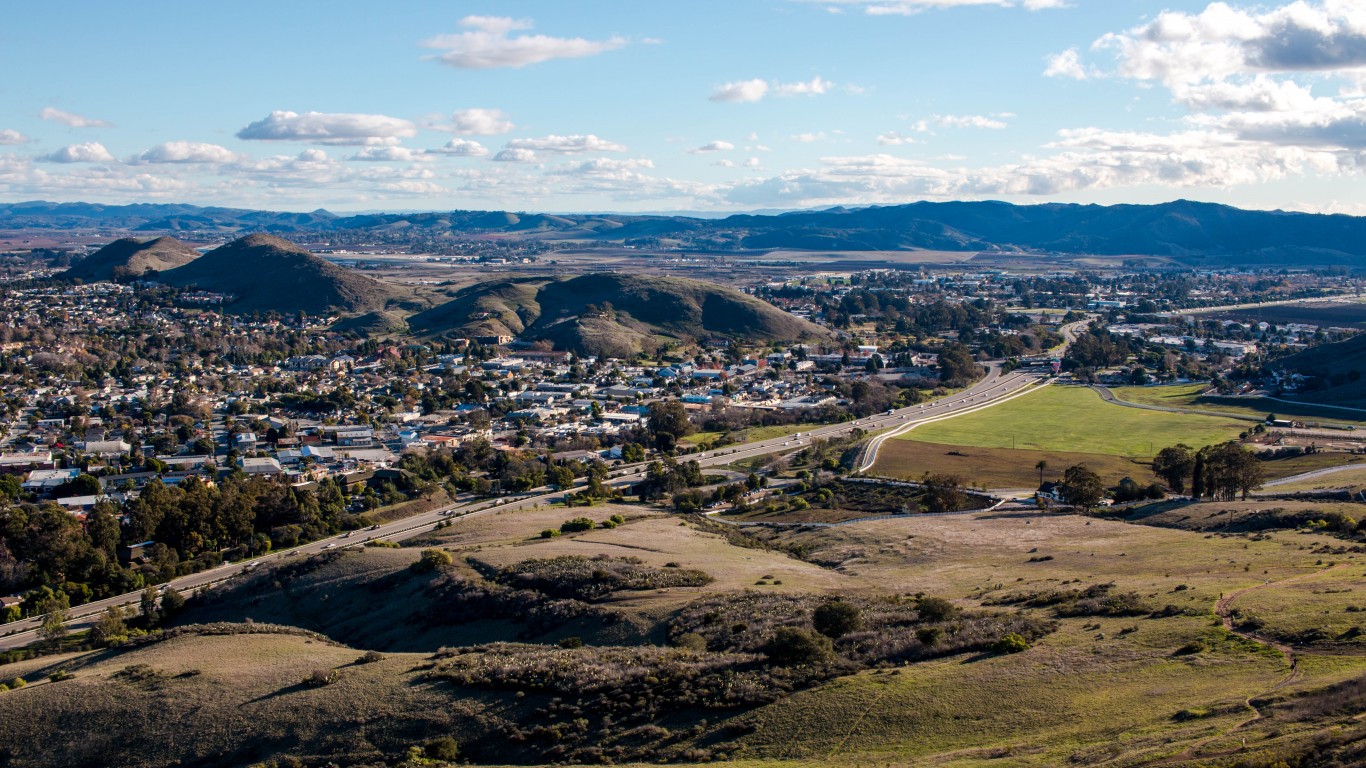
32. California
> Adults drinking excessively: 18.8% (US rate: 19.8%)
> Alcohol-related driving deaths: 27.7% — 23rd lowest (US rate: 26.6%)
> Median household income: $84,907 — 5th highest (US median: $69,717)
> Drunkest metro area in California: San Luis Obispo-Paso Robles (22.3% of adult residents drinking excessively)
[in-text-ad-2]

31. New York
> Adults drinking excessively: 19.0% (US rate: 19.8%)
> Alcohol-related driving deaths: 20.2% — 4th lowest (US rate: 26.6%)
> Median household income: $74,314 — 14th highest (US median: $69,717)
> Drunkest metro area in New York: Syracuse (23.5% of adult residents drinking excessively)
30. Connecticut
> Adults drinking excessively: 19.2% (US rate: 19.8%)
> Alcohol-related driving deaths: 30.4% — 20th highest (US rate: 26.6%)
> Median household income: $83,771 — 8th highest (US median: $69,717)
> Drunkest metro area in Connecticut: Norwich-New London (20.6% of adult residents drinking excessively)
[in-text-ad]

29. Missouri
> Adults drinking excessively: 19.5% (US rate: 19.8%)
> Alcohol-related driving deaths: 27.6% — 22nd lowest (US rate: 26.6%)
> Median household income: $61,847 — 11th lowest (US median: $69,717)
> Drunkest metro area in Missouri: St. Louis (20.3% of adult residents drinking excessively)
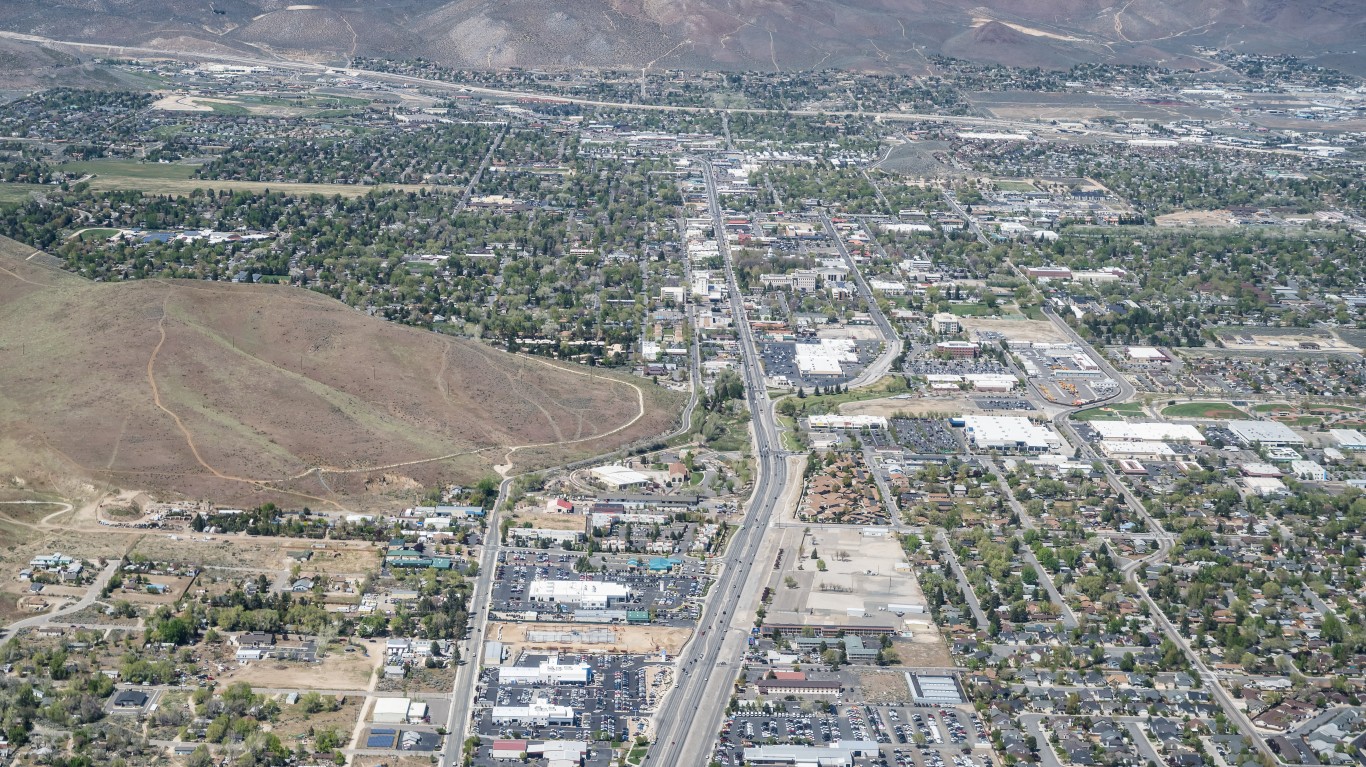
28. Nevada
> Adults drinking excessively: 19.5% (US rate: 19.8%)
> Alcohol-related driving deaths: 27.3% — 21st lowest (US rate: 26.6%)
> Median household income: $66,274 — 23rd lowest (US median: $69,717)
> Drunkest metro area in Nevada: Carson City (22.2% of adult residents drinking excessively)
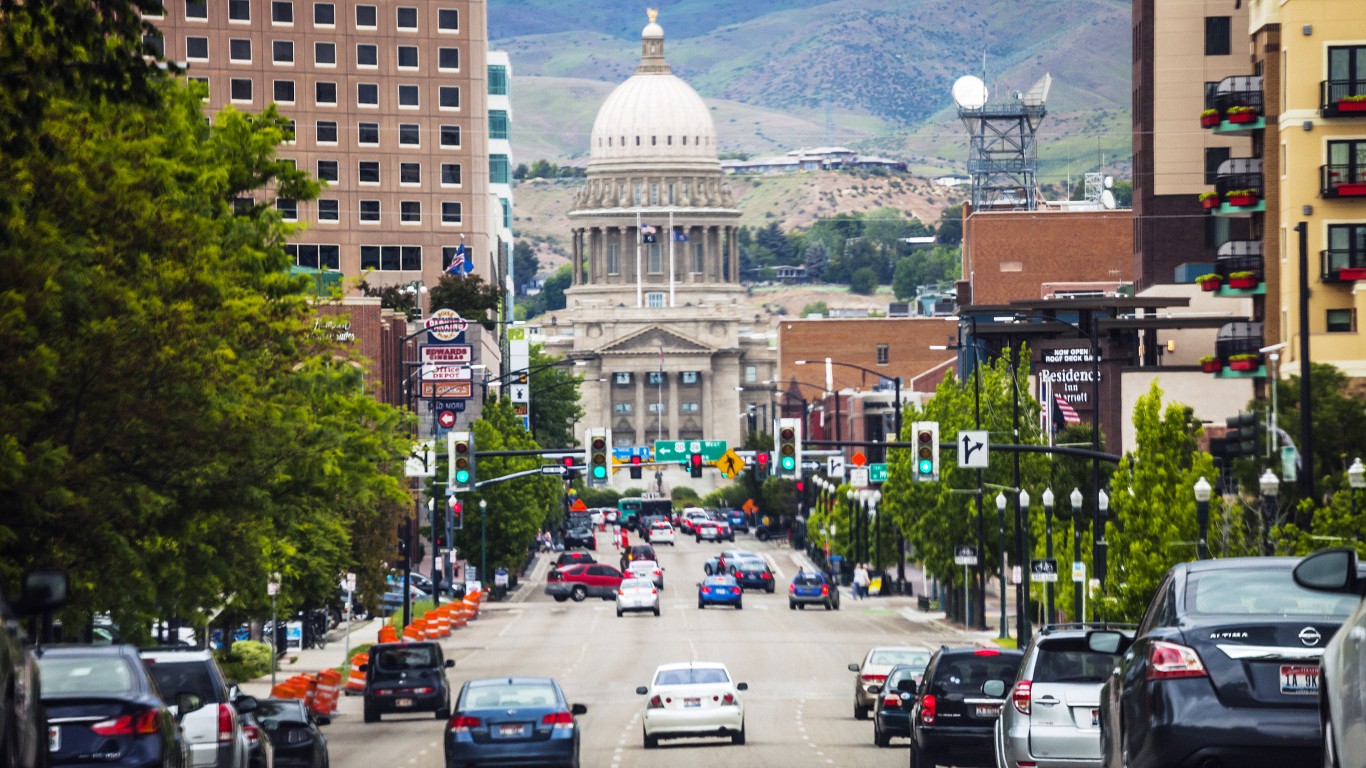
27. Idaho
> Adults drinking excessively: 19.6% (US rate: 19.8%)
> Alcohol-related driving deaths: 31.1% — 18th highest (US rate: 26.6%)
> Median household income: $66,474 — 24th lowest (US median: $69,717)
> Drunkest metro area in Idaho: Boise City (20.7% of adult residents drinking excessively)
[in-text-ad-2]
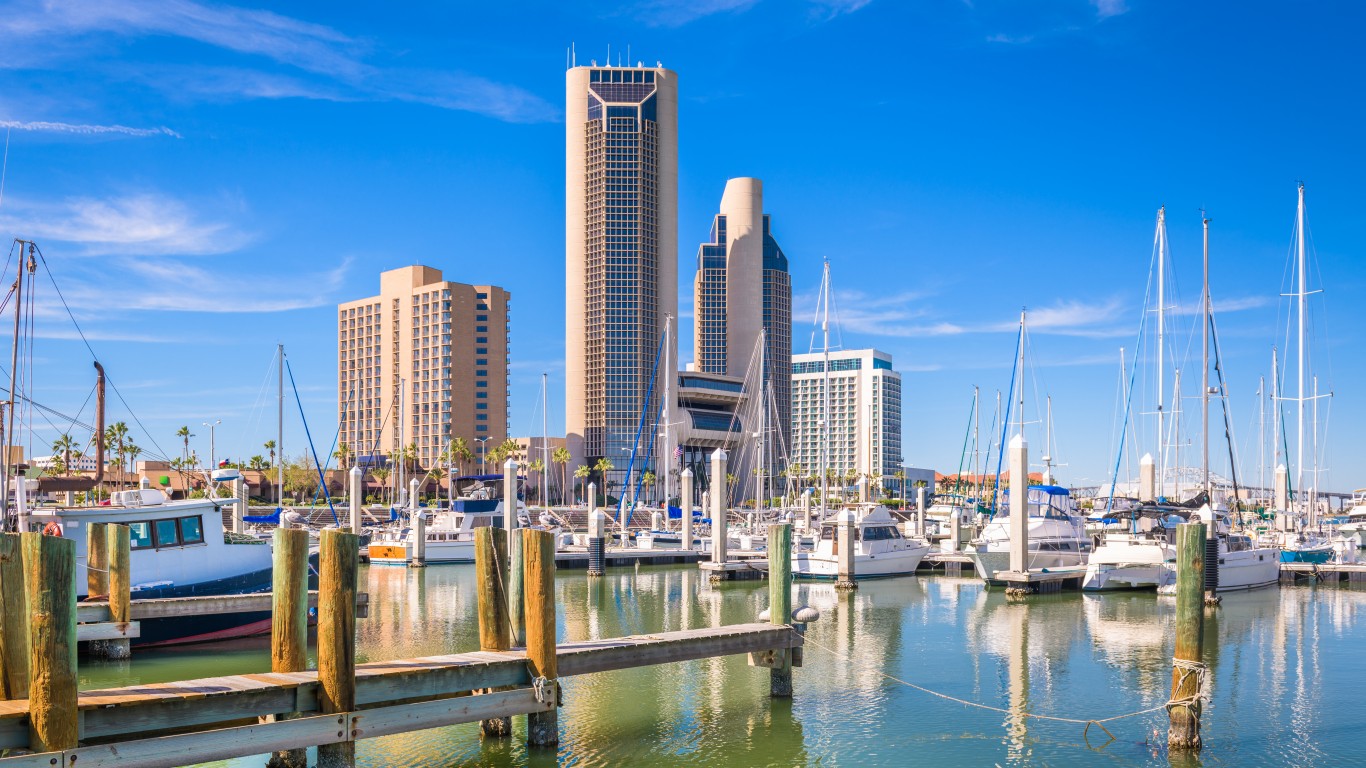
26. Texas
> Adults drinking excessively: 19.6% (US rate: 19.8%)
> Alcohol-related driving deaths: 25.4% — 13th lowest (US rate: 26.6%)
> Median household income: $66,963 — 23rd highest (US median: $69,717)
> Drunkest metro area in Texas: Corpus Christi (21.6% of adult residents drinking excessively)

25. Pennsylvania
> Adults drinking excessively: 19.8% (US rate: 19.8%)
> Alcohol-related driving deaths: 25.4% — 12th lowest (US rate: 26.6%)
> Median household income: $68,957 — 21st highest (US median: $69,717)
> Drunkest metro area in Pennsylvania: Pittsburgh (22.1% of adult residents drinking excessively)
[in-text-ad]
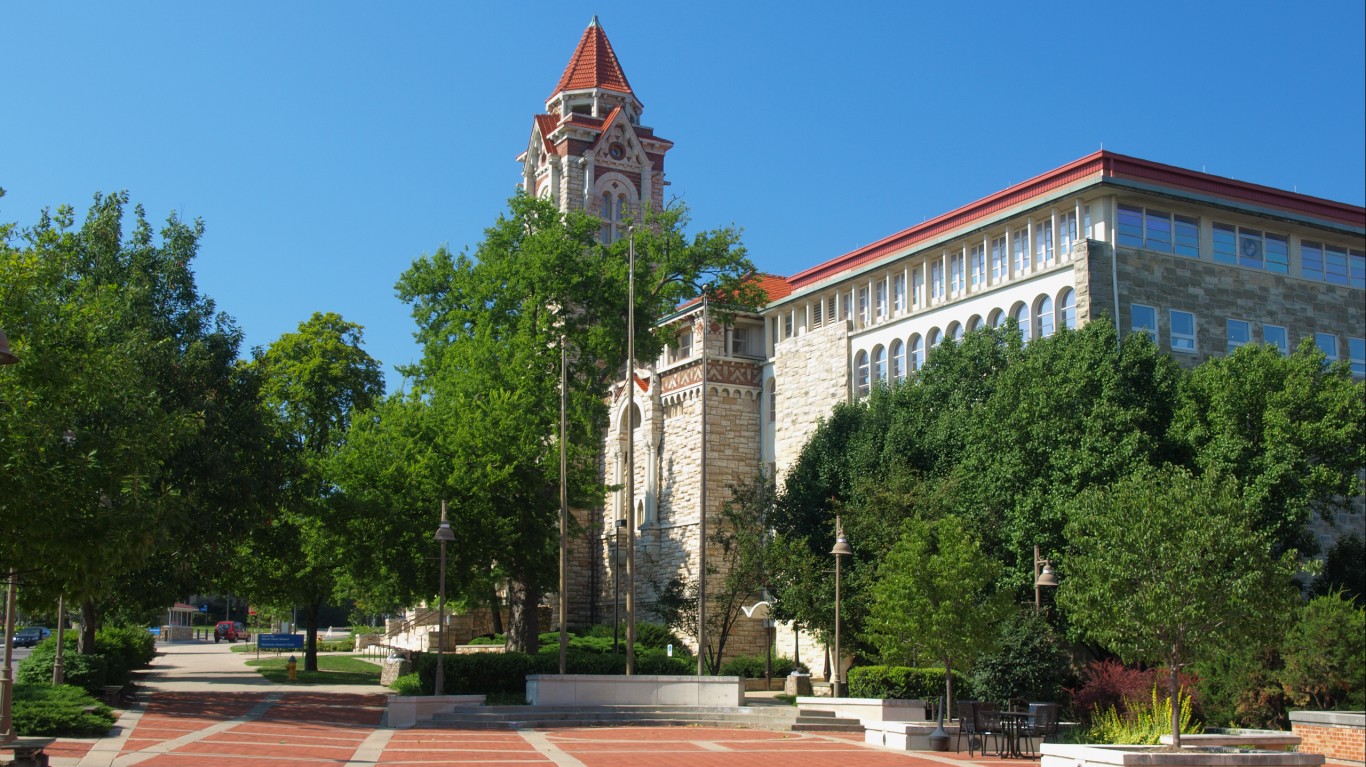
24. Kansas
> Adults drinking excessively: 20.0% (US rate: 19.8%)
> Alcohol-related driving deaths: 19.4% — 3rd lowest (US rate: 26.6%)
> Median household income: $64,124 — 18th lowest (US median: $69,717)
> Drunkest metro area in Kansas: Lawrence (19.9% of adult residents drinking excessively)

23. Colorado
> Adults drinking excessively: 20.1% (US rate: 19.8%)
> Alcohol-related driving deaths: 34.0% — 9th highest (US rate: 26.6%)
> Median household income: $82,254 — 9th highest (US median: $69,717)
> Drunkest metro area in Colorado: Denver-Aurora-Lakewood (20.2% of adult residents drinking excessively)
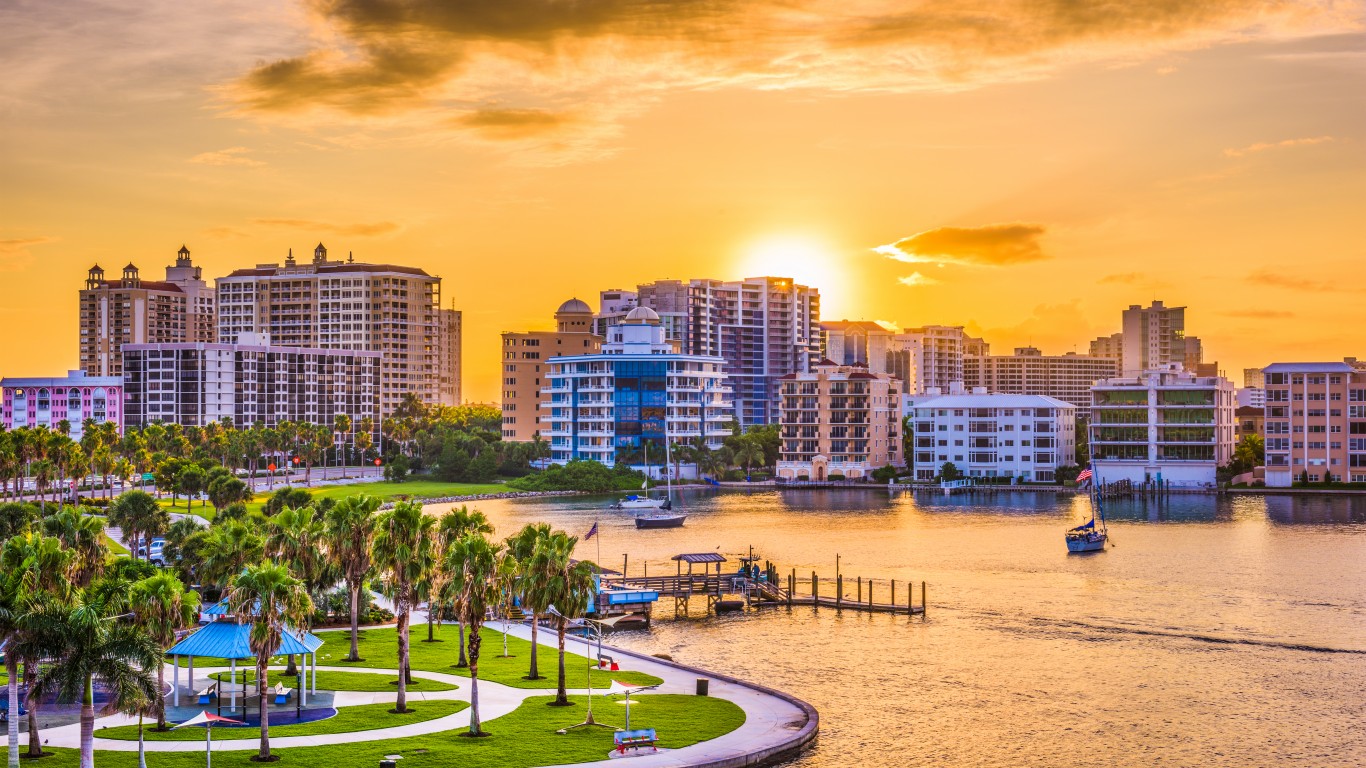
22. Florida
> Adults drinking excessively: 20.2% (US rate: 19.8%)
> Alcohol-related driving deaths: 22.0% — 7th lowest (US rate: 26.6%)
> Median household income: $63,062 — 15th lowest (US median: $69,717)
> Drunkest metro area in Florida: North Port-Sarasota-Bradenton (23.8% of adult residents drinking excessively)
[in-text-ad-2]
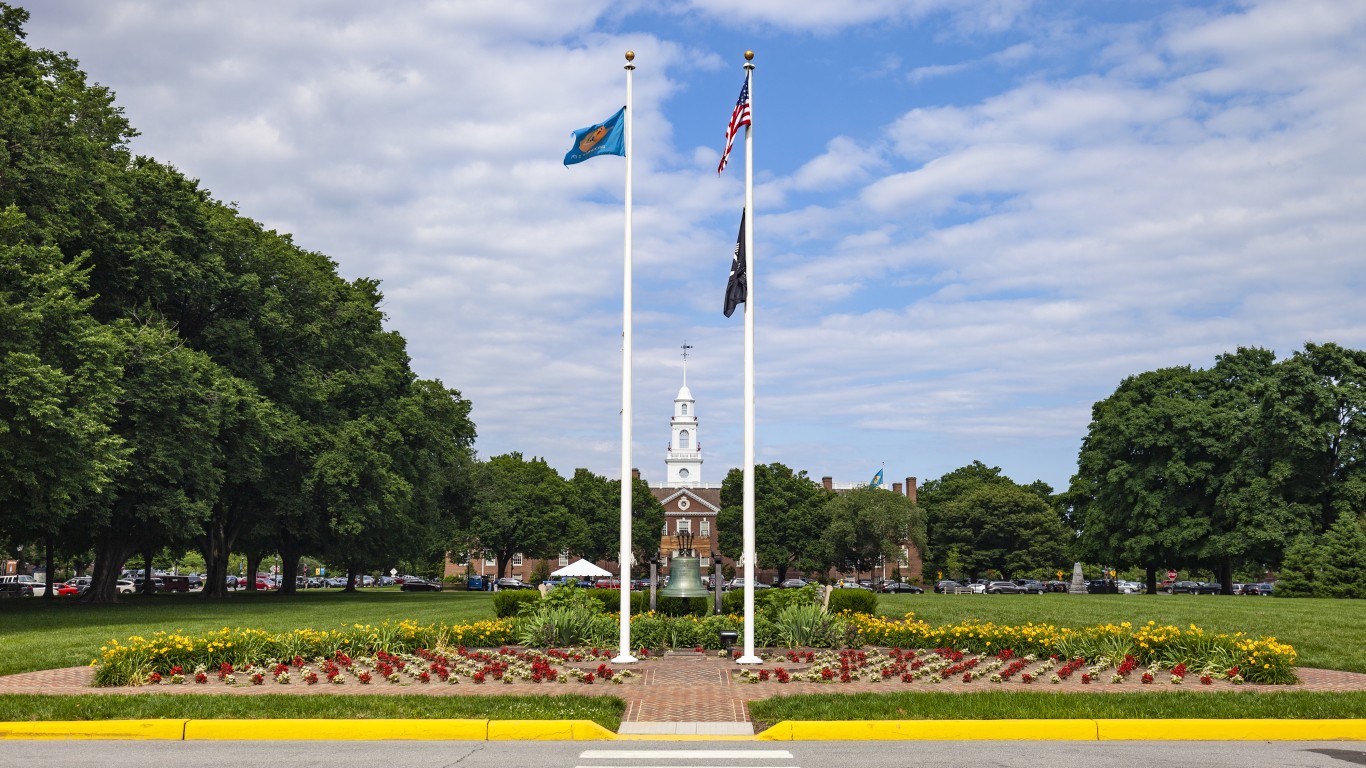
21. Delaware
> Adults drinking excessively: 20.5% (US rate: 19.8%)
> Alcohol-related driving deaths: 25.0% — 11th lowest (US rate: 26.6%)
> Median household income: $71,091 — 19th highest (US median: $69,717)
> Drunkest metro area in Delaware: Dover (17.7% of adult residents drinking excessively)
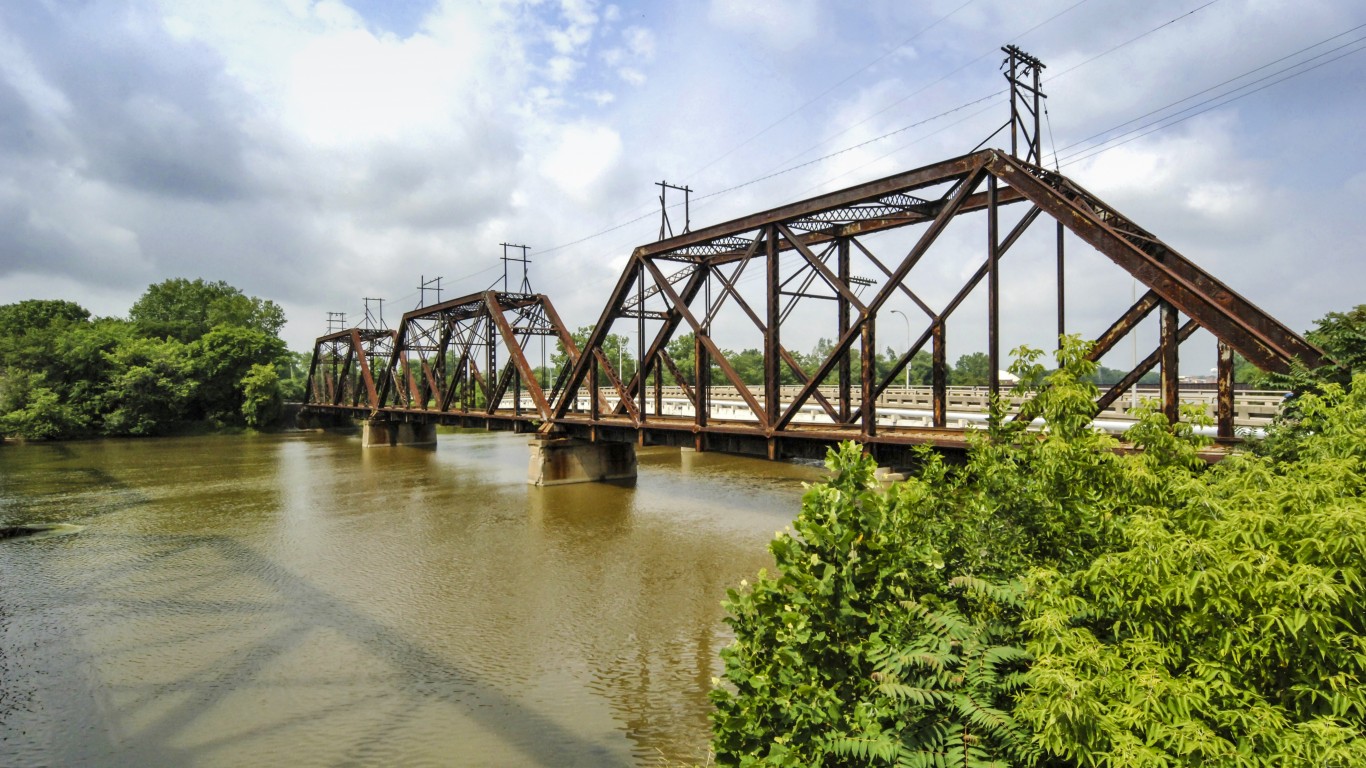
20. Michigan
> Adults drinking excessively: 20.5% (US rate: 19.8%)
> Alcohol-related driving deaths: 29.2% — 24th highest (US rate: 26.6%)
> Median household income: $63,498 — 17th lowest (US median: $69,717)
> Drunkest metro area in Michigan: Monroe (23.5% of adult residents drinking excessively)
[in-text-ad]
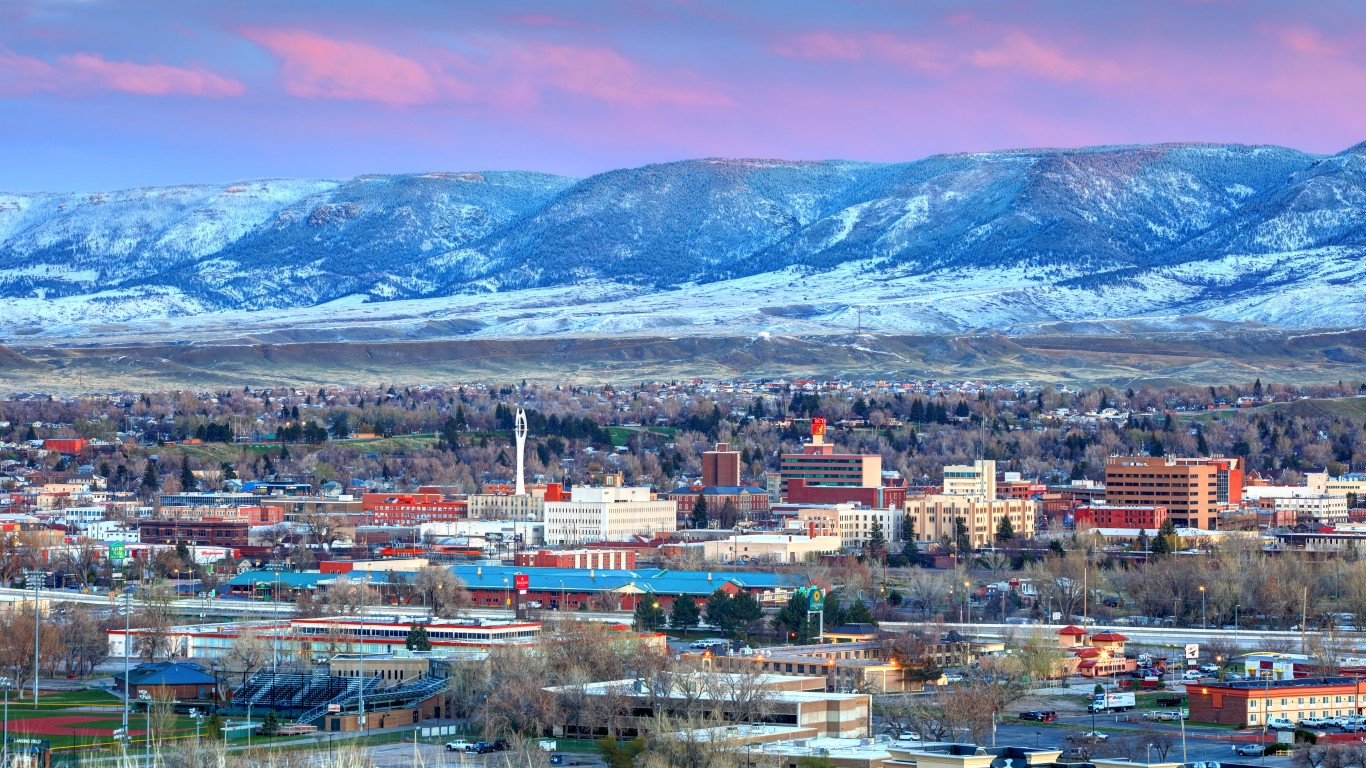
19. Wyoming
> Adults drinking excessively: 20.5% (US rate: 19.8%)
> Alcohol-related driving deaths: 31.8% — 15th highest (US rate: 26.6%)
> Median household income: $65,204 — 20th lowest (US median: $69,717)
> Drunkest metro area in Wyoming: Casper (18.5% of adult residents drinking excessively)
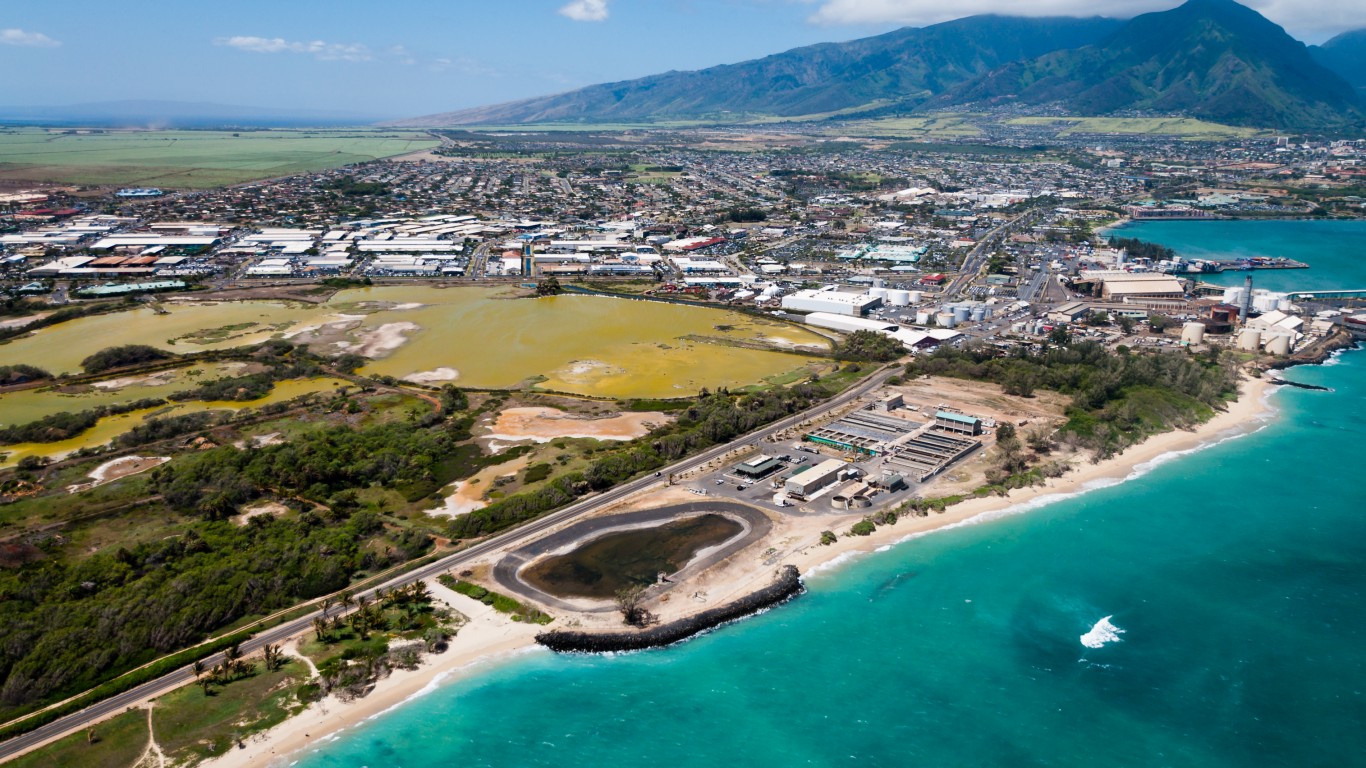
18. Hawaii
> Adults drinking excessively: 20.7% (US rate: 19.8%)
> Alcohol-related driving deaths: 31.5% — 16th highest (US rate: 26.6%)
> Median household income: $84,857 — 6th highest (US median: $69,717)
> Drunkest metro area in Hawaii: Kahului-Wailuku-Lahaina (23.4% of adult residents drinking excessively)
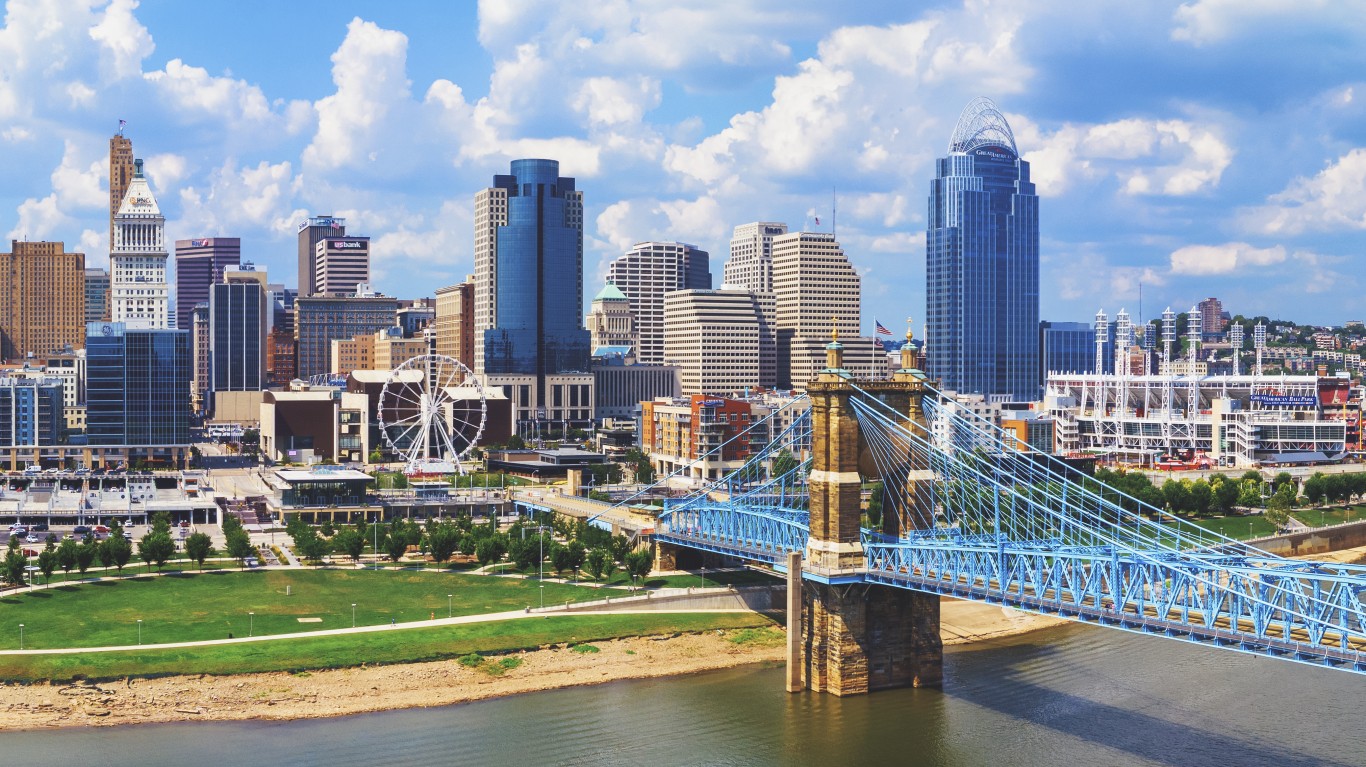
17. Ohio
> Adults drinking excessively: 20.7% (US rate: 19.8%)
> Alcohol-related driving deaths: 32.5% — 14th highest (US rate: 26.6%)
> Median household income: $62,262 — 13th lowest (US median: $69,717)
> Drunkest metro area in Ohio: Cincinnati (19.7% of adult residents drinking excessively)
[in-text-ad-2]

16. New Hampshire
> Adults drinking excessively: 20.8% (US rate: 19.8%)
> Alcohol-related driving deaths: 33.1% — 11th highest (US rate: 26.6%)
> Median household income: $88,465 — 4th highest (US median: $69,717)
> Drunkest metro area in New Hampshire: Manchester-Nashua (20.4% of adult residents drinking excessively)
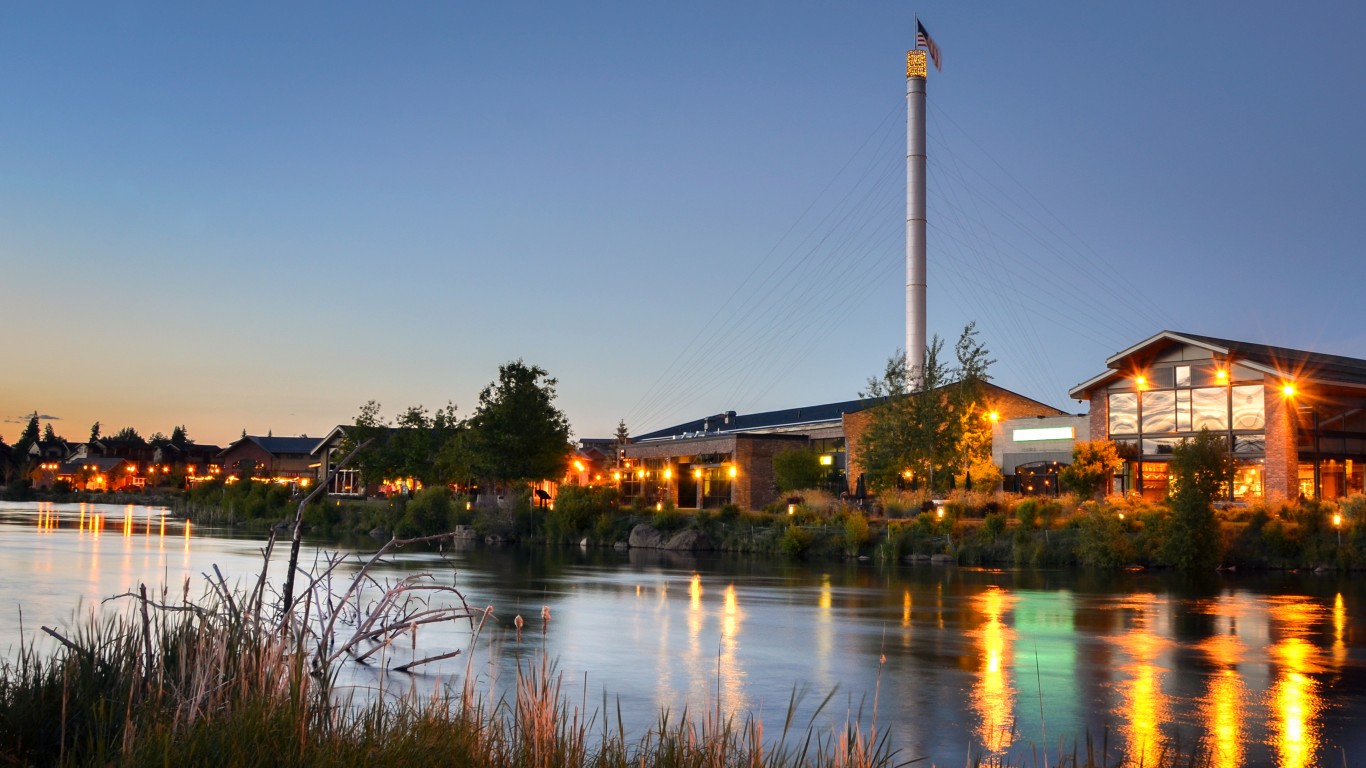
15. Oregon
> Adults drinking excessively: 21.2% (US rate: 19.8%)
> Alcohol-related driving deaths: 27.9% — 24th lowest (US rate: 26.6%)
> Median household income: $71,562 — 18th highest (US median: $69,717)
> Drunkest metro area in Oregon: Bend (23.8% of adult residents drinking excessively)
[in-text-ad]

14. Rhode Island
> Adults drinking excessively: 21.7% (US rate: 19.8%)
> Alcohol-related driving deaths: 40.3% — 3rd highest (US rate: 26.6%)
> Median household income: $74,008 — 15th highest (US median: $69,717)
> Drunkest metro area in Rhode Island: Providence-Warwick (20.8% of adult residents drinking excessively)
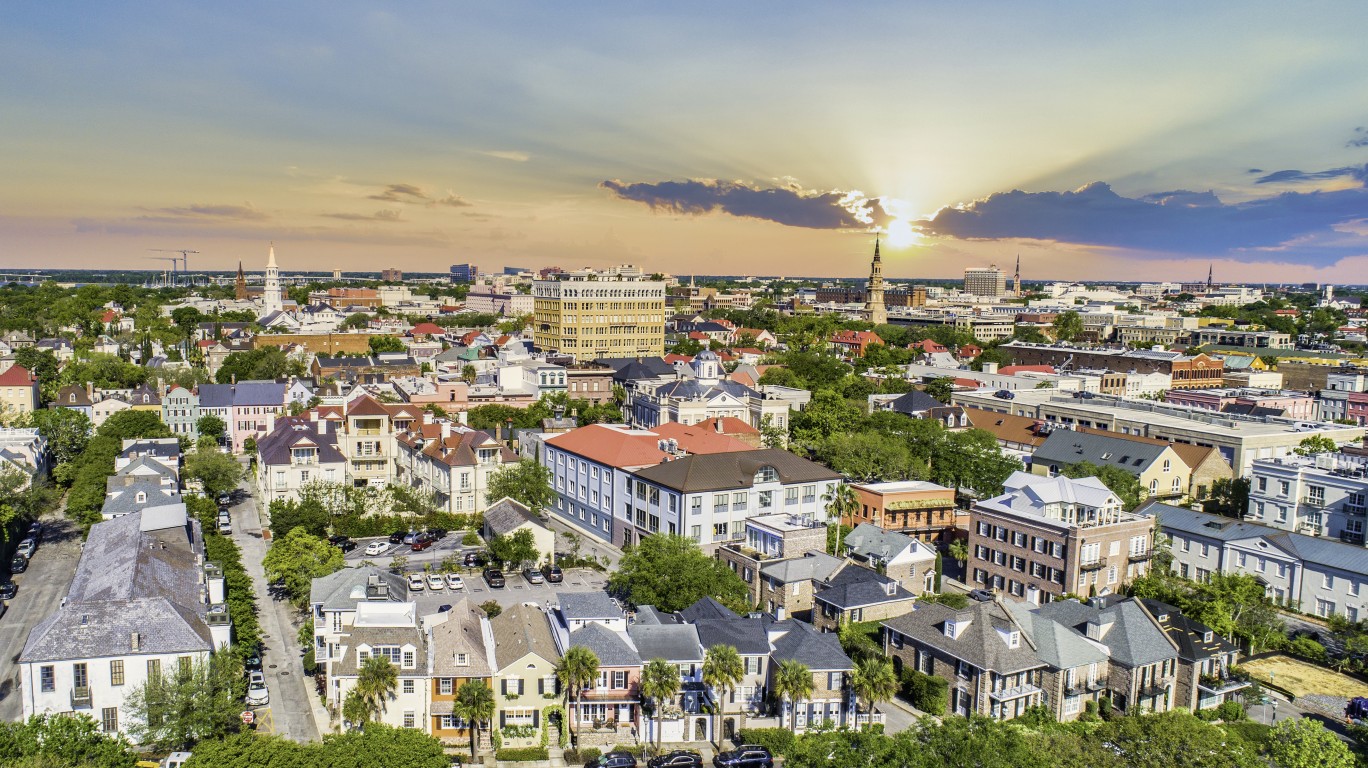
13. South Carolina
> Adults drinking excessively: 21.7% (US rate: 19.8%)
> Alcohol-related driving deaths: 32.8% — 12th highest (US rate: 26.6%)
> Median household income: $59,318 — 9th lowest (US median: $69,717)
> Drunkest metro area in South Carolina: Charleston-North Charleston (26.3% of adult residents drinking excessively)
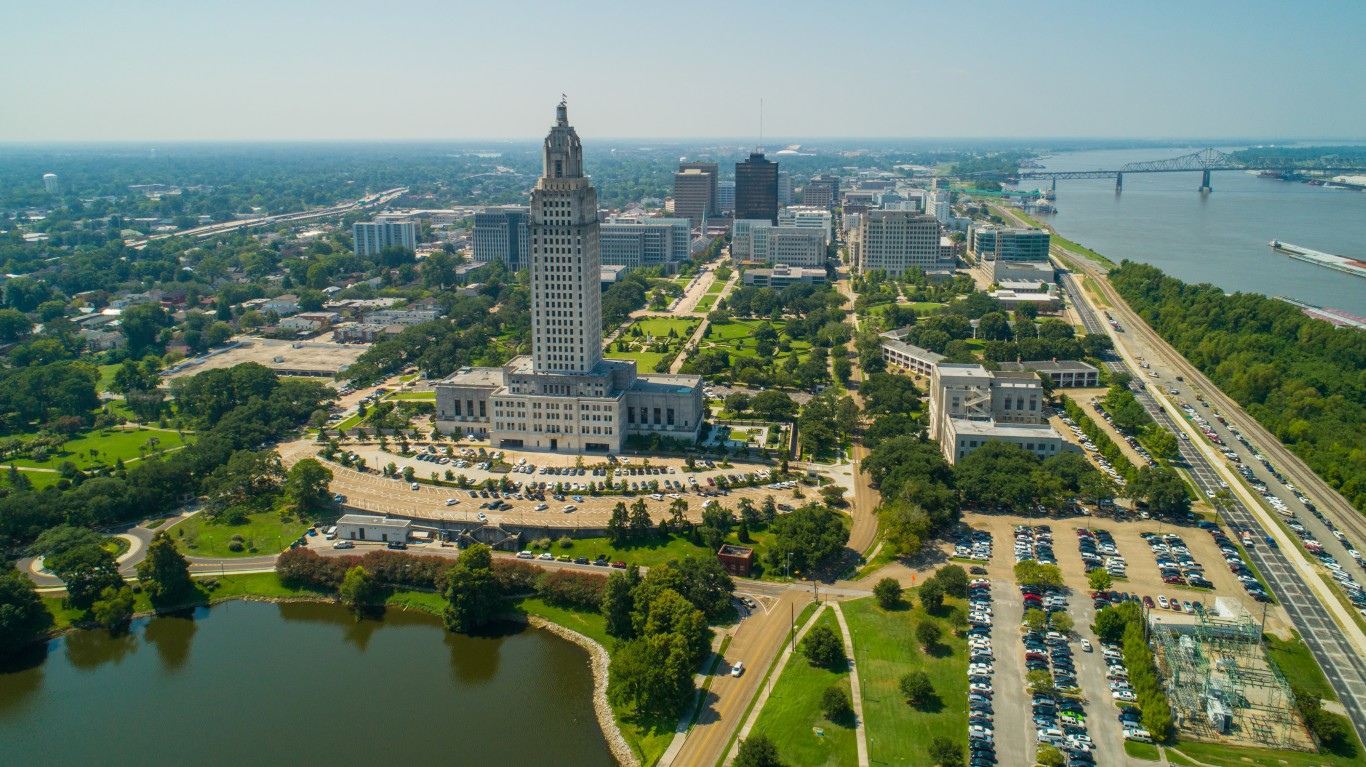
12. Louisiana
> Adults drinking excessively: 21.9% (US rate: 19.8%)
> Alcohol-related driving deaths: 31.2% — 17th highest (US rate: 26.6%)
> Median household income: $52,087 — 3rd lowest (US median: $69,717)
> Drunkest metro area in Louisiana: Baton Rouge (23.5% of adult residents drinking excessively)
[in-text-ad-2]
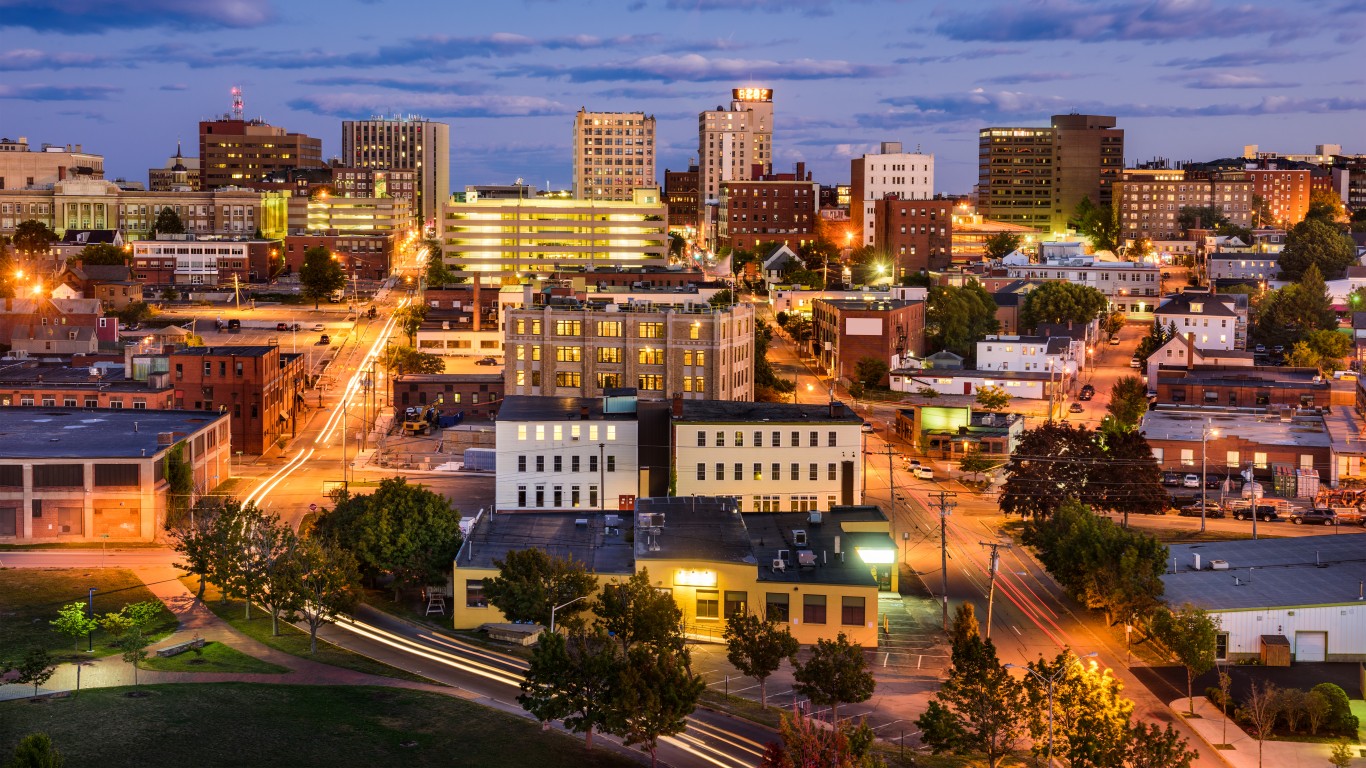
11. Maine
> Adults drinking excessively: 22.5% (US rate: 19.8%)
> Alcohol-related driving deaths: 34.4% — 8th highest (US rate: 26.6%)
> Median household income: $64,767 — 19th lowest (US median: $69,717)
> Drunkest metro area in Maine: Portland-South Portland (25.4% of adult residents drinking excessively)
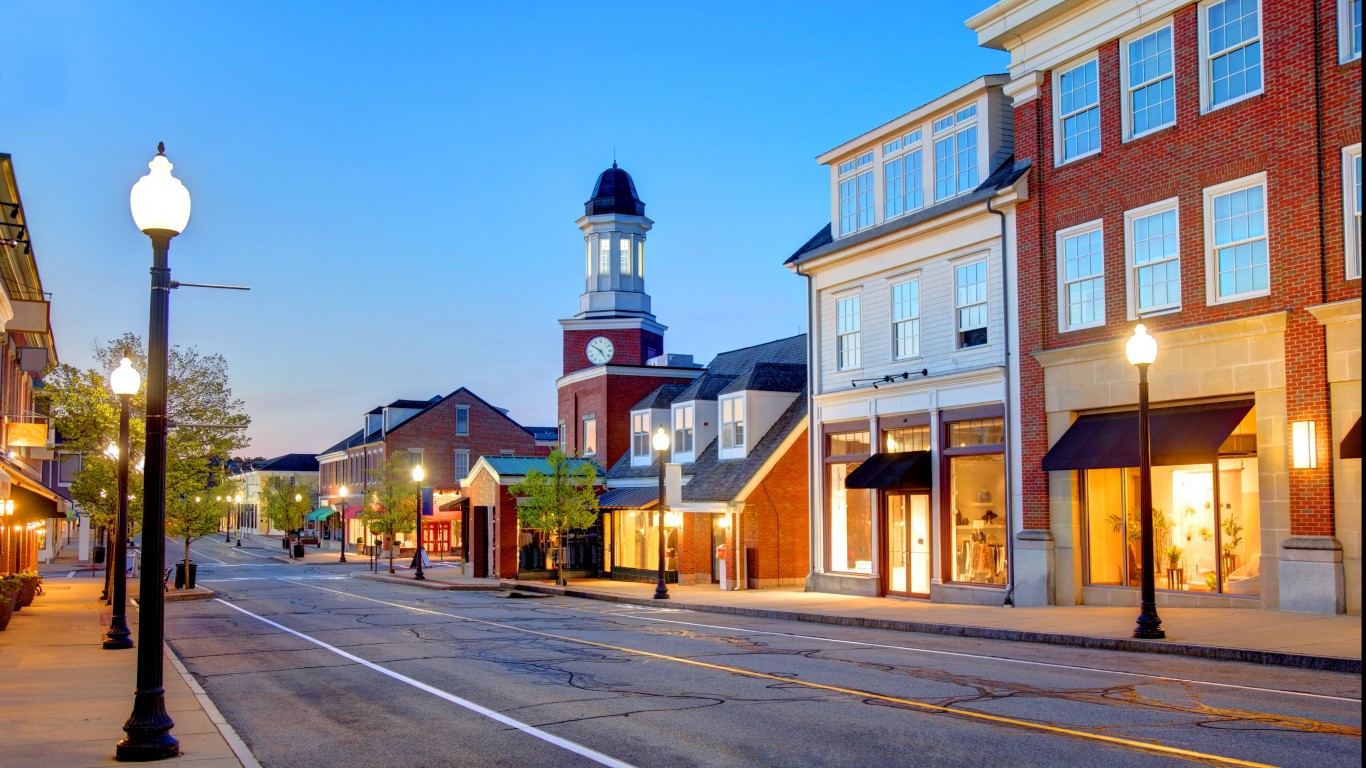
10. Massachusetts
> Adults drinking excessively: 22.5% (US rate: 19.8%)
> Alcohol-related driving deaths: 30.5% — 19th highest (US rate: 26.6%)
> Median household income: $89,645 — 2nd highest (US median: $69,717)
> Drunkest metro area in Massachusetts: Barnstable Town (25.4% of adult residents drinking excessively)
[in-text-ad]
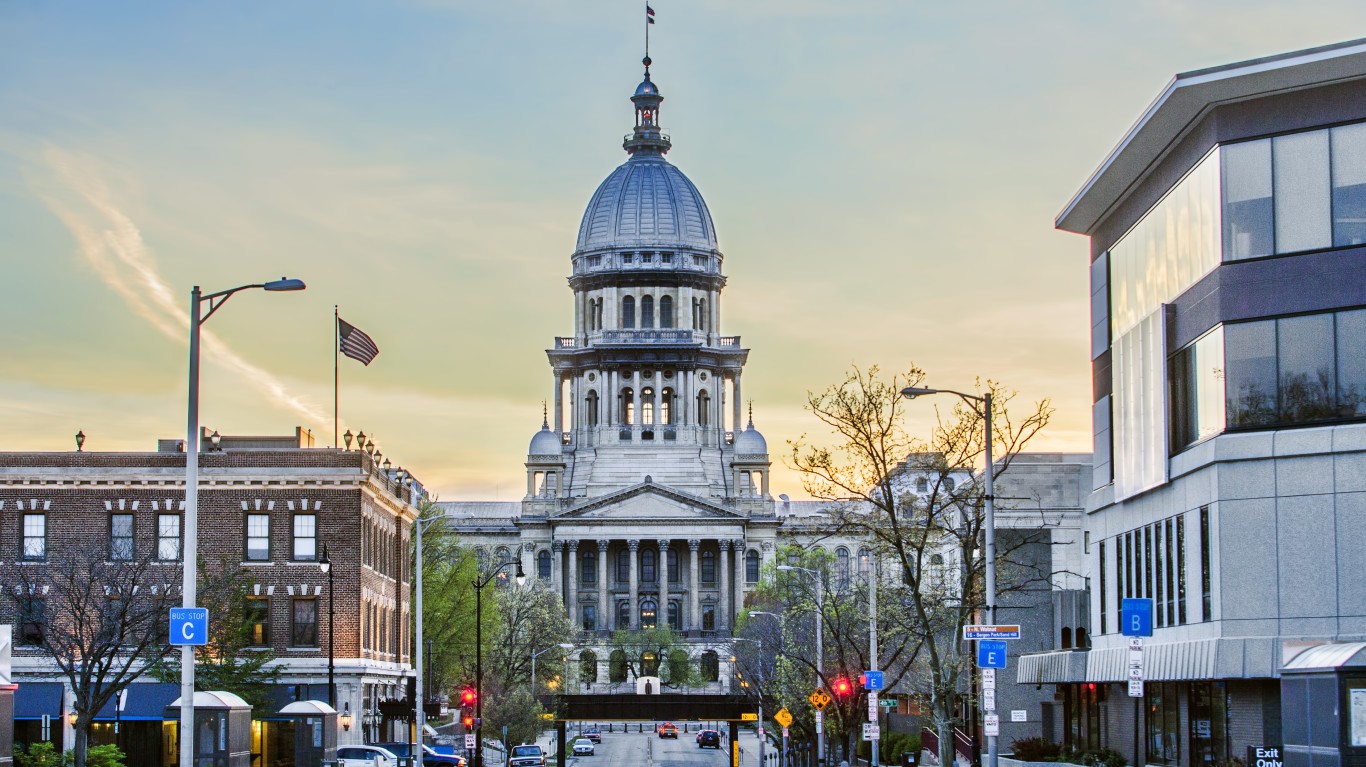
9. Illinois
> Adults drinking excessively: 22.9% (US rate: 19.8%)
> Alcohol-related driving deaths: 28.8% — 25th highest (US rate: 26.6%)
> Median household income: $72,205 — 17th highest (US median: $69,717)
> Drunkest metro area in Illinois: Springfield (23.8% of adult residents drinking excessively)

8. Vermont
> Adults drinking excessively: 23.2% (US rate: 19.8%)
> Alcohol-related driving deaths: 35.4% — 7th highest (US rate: 26.6%)
> Median household income: $72,431 — 16th highest (US median: $69,717)
> Drunkest metro area in Vermont: Burlington-South Burlington (23.3% of adult residents drinking excessively)
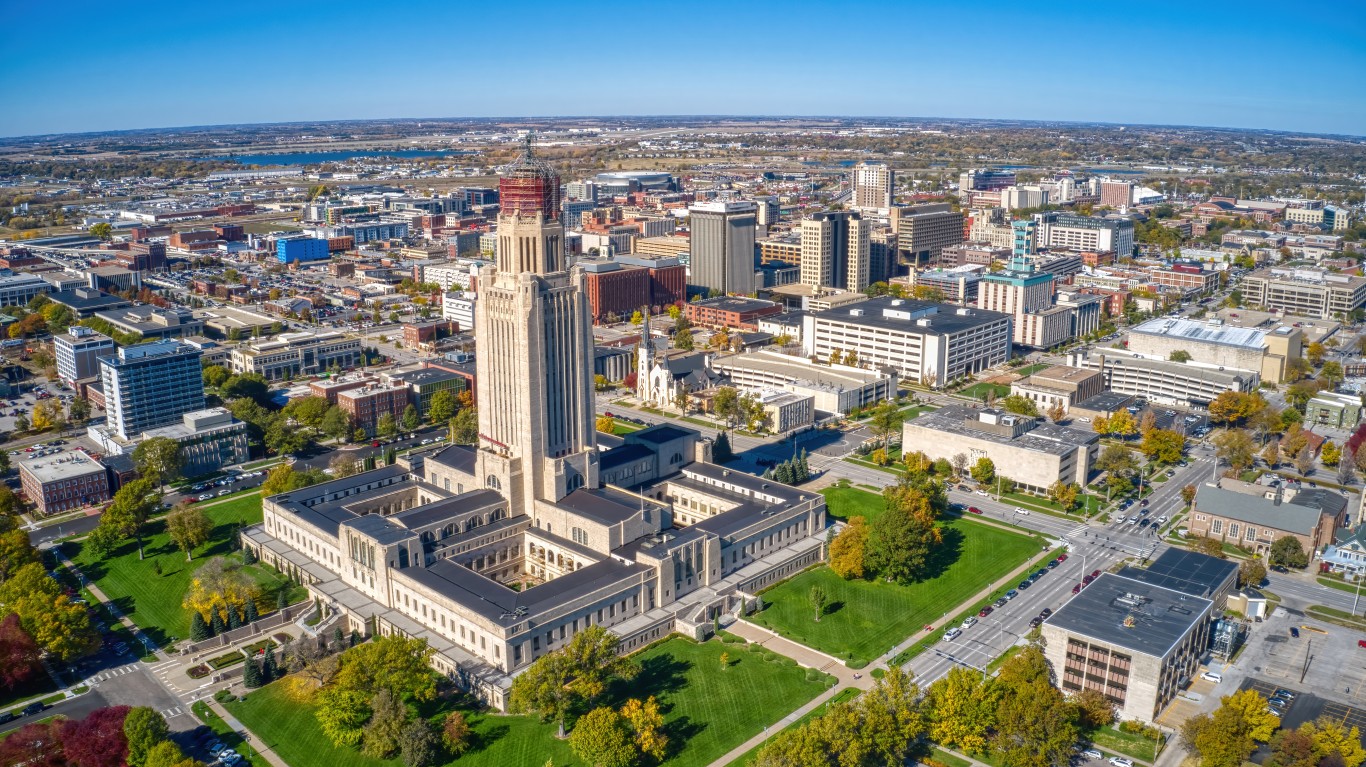
7. Nebraska
> Adults drinking excessively: 23.2% (US rate: 19.8%)
> Alcohol-related driving deaths: 33.2% — 10th highest (US rate: 26.6%)
> Median household income: $66,817 — 24th highest (US median: $69,717)
> Drunkest metro area in Nebraska: Lincoln (23.6% of adult residents drinking excessively)
[in-text-ad-2]
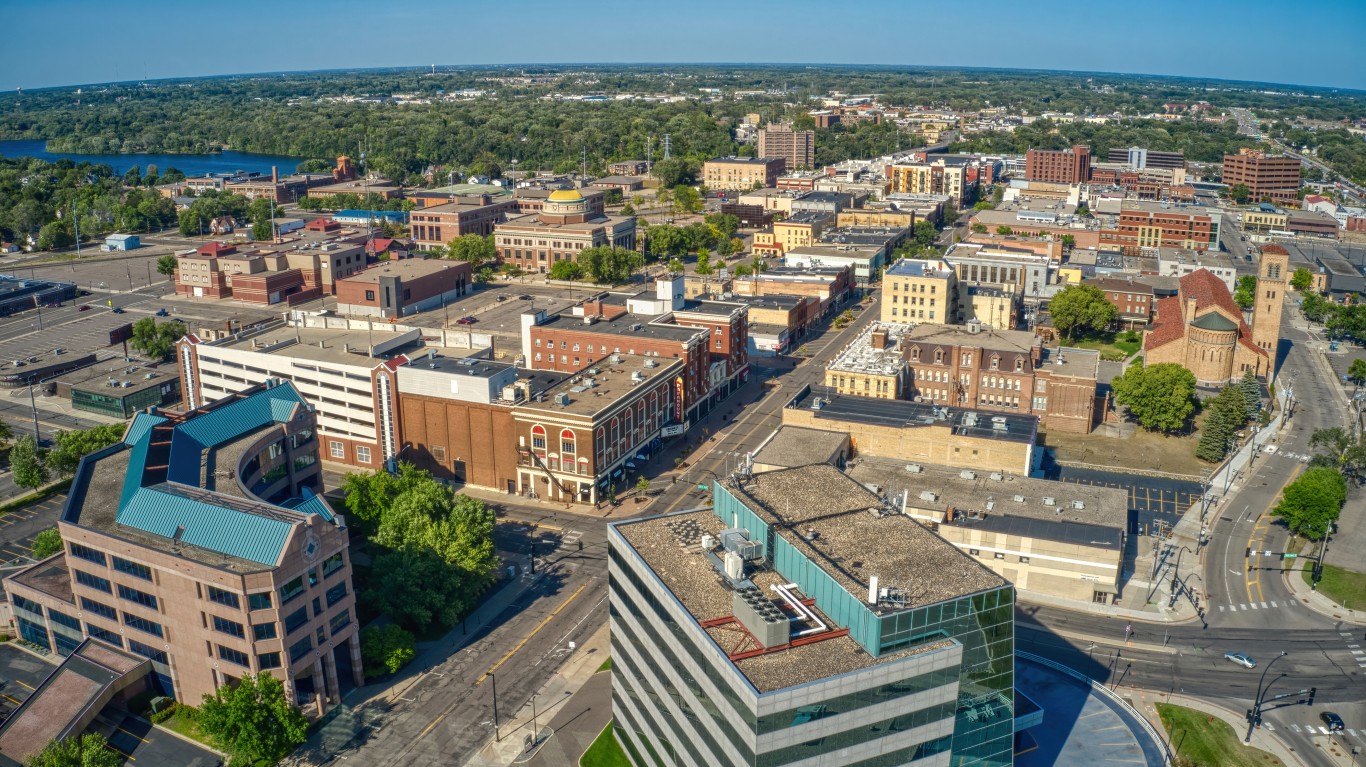
6. Minnesota
> Adults drinking excessively: 23.4% (US rate: 19.8%)
> Alcohol-related driving deaths: 29.9% — 22nd highest (US rate: 26.6%)
> Median household income: $77,720 — 13th highest (US median: $69,717)
> Drunkest metro area in Minnesota: St. Cloud (26.9% of adult residents drinking excessively)
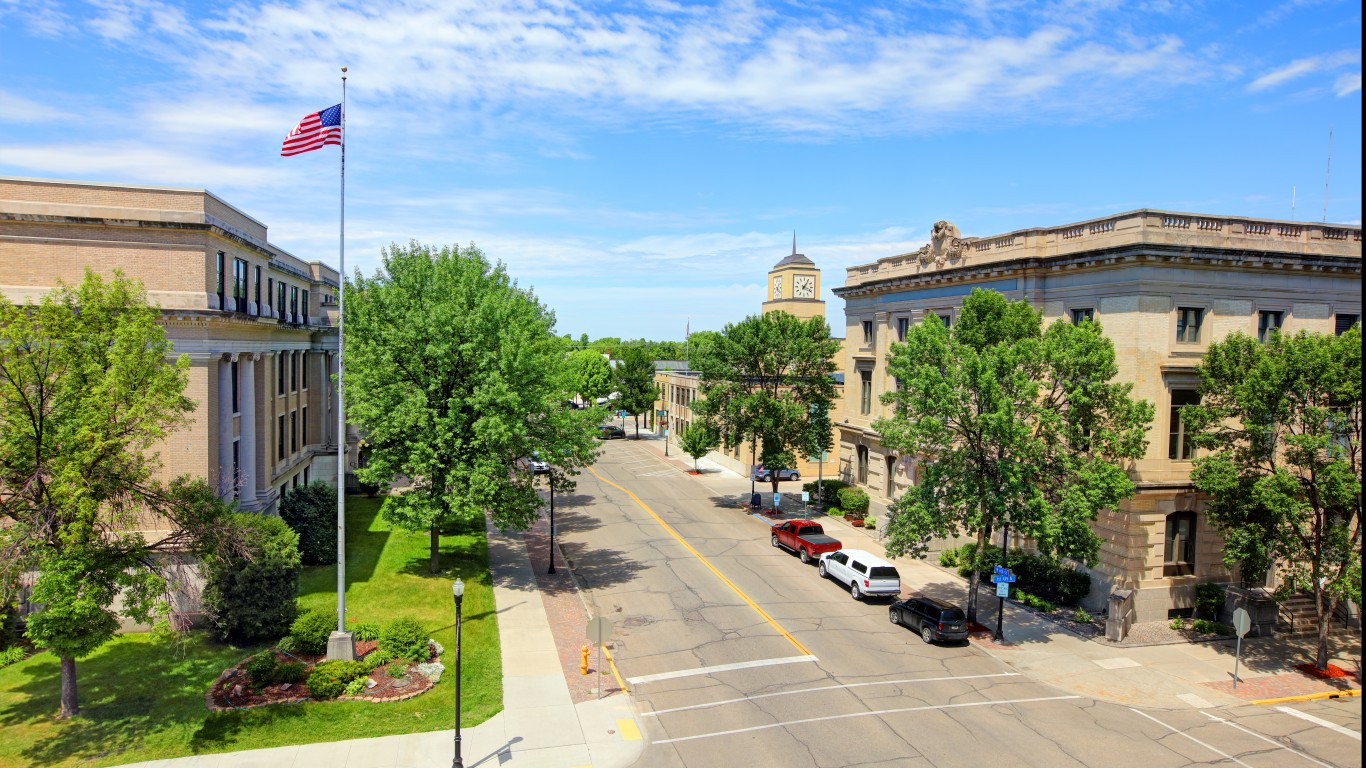
5. North Dakota
> Adults drinking excessively: 24.1% (US rate: 19.8%)
> Alcohol-related driving deaths: 41.4% — 2nd highest (US rate: 26.6%)
> Median household income: $66,519 — 25th lowest (US median: $69,717)
> Drunkest metro area in North Dakota: Grand Forks (23.9% of adult residents drinking excessively)
[in-text-ad]
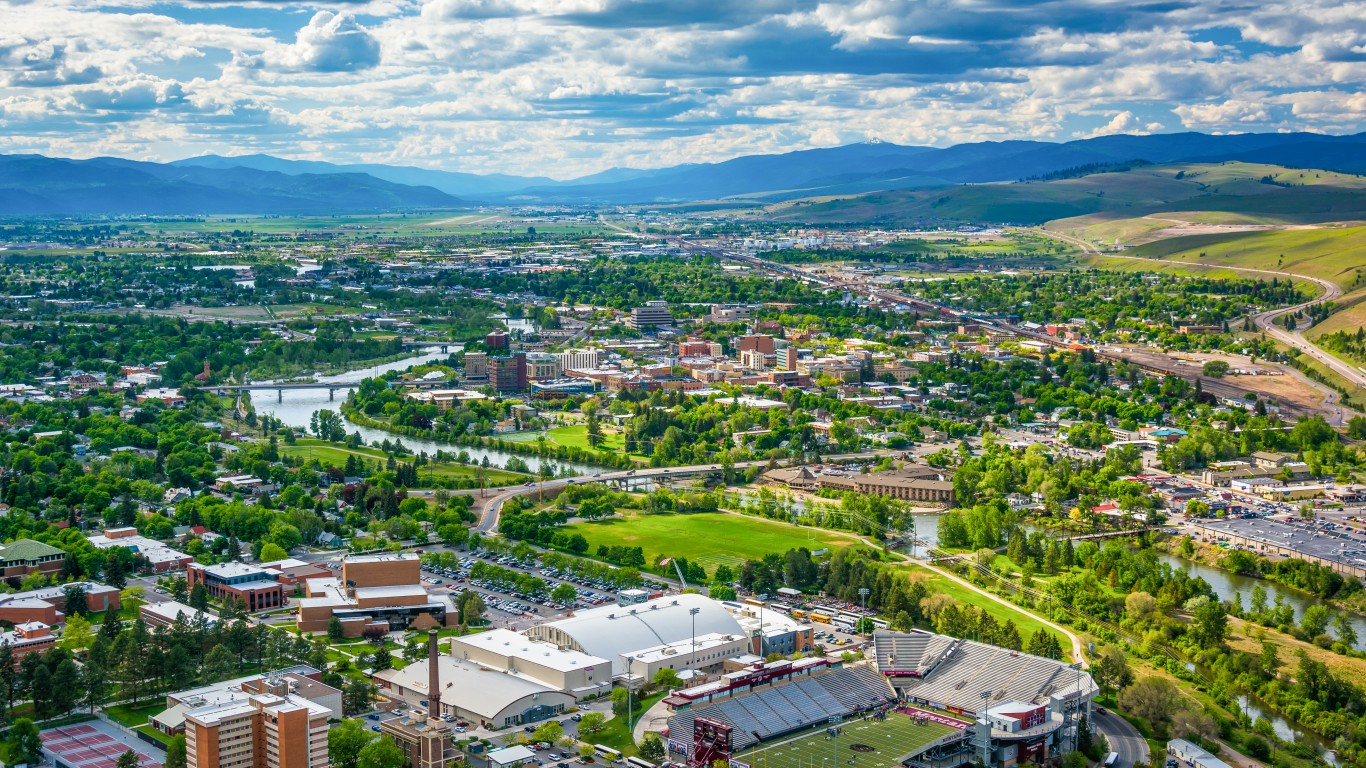
4. Montana
> Adults drinking excessively: 24.3% (US rate: 19.8%)
> Alcohol-related driving deaths: 46.4% — the highest (US rate: 26.6%)
> Median household income: $63,249 — 16th lowest (US median: $69,717)
> Drunkest metro area in Montana: Missoula (26.9% of adult residents drinking excessively)

3. South Dakota
> Adults drinking excessively: 24.4% (US rate: 19.8%)
> Alcohol-related driving deaths: 36.1% — 5th highest (US rate: 26.6%)
> Median household income: $66,143 — 22nd lowest (US median: $69,717)
> Drunkest metro area in South Dakota: Sioux Falls (22.6% of adult residents drinking excessively)

2. Iowa
> Adults drinking excessively: 24.6% (US rate: 19.8%)
> Alcohol-related driving deaths: 26.8% — 19th lowest (US rate: 26.6%)
> Median household income: $65,600 — 21st lowest (US median: $69,717)
> Drunkest metro area in Iowa: Dubuque (26.0% of adult residents drinking excessively)
[in-text-ad-2]

1. Wisconsin
> Adults drinking excessively: 25.2% (US rate: 19.8%)
> Alcohol-related driving deaths: 35.6% — 6th highest (US rate: 26.6%)
> Median household income: $67,125 — 22nd highest (US median: $69,717)
> Drunkest metro area in Wisconsin: Eau Claire (26.4% of adult residents drinking excessively)
It’s Your Money, Your Future—Own It (sponsor)
Retirement can be daunting, but it doesn’t need to be.
Imagine having an expert in your corner to help you with your financial goals. Someone to help you determine if you’re ahead, behind, or right on track. With SmartAsset, that’s not just a dream—it’s reality. This free tool connects you with pre-screened financial advisors who work in your best interests. It’s quick, it’s easy, so take the leap today and start planning smarter!
Don’t waste another minute; get started right here and help your retirement dreams become a retirement reality.
Thank you for reading! Have some feedback for us?
Contact the 24/7 Wall St. editorial team.
 24/7 Wall St.


 24/7 Wall St.
 24/7 Wall St.
 24/7 Wall St.
