
Swimming, boating, water skiing, and diving are among the most popular pastimes in warm weather. In northern states, that warm weather may only last four or five months. In southern states, it lasts the entire year. Unfortunately, drowning may result from pastime activities, and the state where most people drown is Alaska.
There is ample opportunity for water sports in the U.S. The National Ocean Services reports the United States has 95,471 miles of coastline and “These measurements included the continental U.S. as well as U.S. territories (Hawaii and Alaska were U.S. territories during this time period).” (This is best place to enjoy the water in each state.)
Additionally, the U.S. has 250 freshwater lakes with surfaces that cover 17,300 square miles. Beyond that, there are tens of thousands of smaller lakes. Some of these are remote, but many of the larger lakes, including the Great Lakes, are easily accessible. (This is the largest lake in America.)
All this water sports activity carries some risks, the worst of which is drowning. The Centers for Disease Control and Prevention reports that there are nearly 4,000 unintentional drownings each year, or about 11 per day. The CDC further explains: “Drowning death rates vary from state to state. The annual age-adjusted drowning death rate in the United States during 2015-2019 was 1.23 deaths per 100,000 people (including boating-related drowning deaths).”
To determine the states where the most people drown, 24/7 Wall St. reviewed data on fatal unintentional drownings from the Centers for Disease Control and Prevention. States were ranked based on the annual age-adjusted drowning death rate from 2015 to 2019.
America’s two newest states have the highest drowning rates. The figure in Alaska is 4.97 drownings per 100,000 people, followed by Hawaii at 2.90 per 100,000. Southern states make up most of the balance of high drowning rates. Louisiana has 2.20 drownings per 100,000, Florida 2.01 per 100,000, and Mississippi 1.88 per 100,000.
At the other end of the spectrum, several states have drowning rates of less than 1.00 per 100,000. New York is the lowest on the list at 0.65 drownings per 100,000, followed by New Jersey at 0.67 per 100,000, and Connecticut at 0.68 per 100,000. There is no explanation for the low level in the so-called tri-state area around New York City.
Click here to see the state where the most people drown
50. New York
> Annual drowning deaths, 2015-2019: 0.65 per 100,000
> Total drowning deaths, 2015-2019: 655
[in-text-ad]
49. New Jersey
> Annual drowning deaths, 2015-2019: 0.67 per 100,000
> Total drowning deaths, 2015-2019: 312

48. Connecticut
> Annual drowning deaths, 2015-2019: 0.68 per 100,000
> Total drowning deaths, 2015-2019: 123
47. Delaware
> Annual drowning deaths, 2015-2019: 0.71 per 100,000
> Total drowning deaths, 2015-2019: 36
[in-text-ad-2]
46. Pennsylvania
> Annual drowning deaths, 2015-2019: 0.76 per 100,000
> Total drowning deaths, 2015-2019: 490
45. Massachusetts
> Annual drowning deaths, 2015-2019: 0.78 per 100,000
> Total drowning deaths, 2015-2019: 285
[in-text-ad]

44. Nebraska
> Annual drowning deaths, 2015-2019: 0.89 per 100,000
> Total drowning deaths, 2015-2019: 87
43. Maryland
> Annual drowning deaths, 2015-2019: 0.91 per 100,000
> Total drowning deaths, 2015-2019: 278

42. Illinois
> Annual drowning deaths, 2015-2019: 0.96 per 100,000
> Total drowning deaths, 2015-2019: 619
[in-text-ad-2]
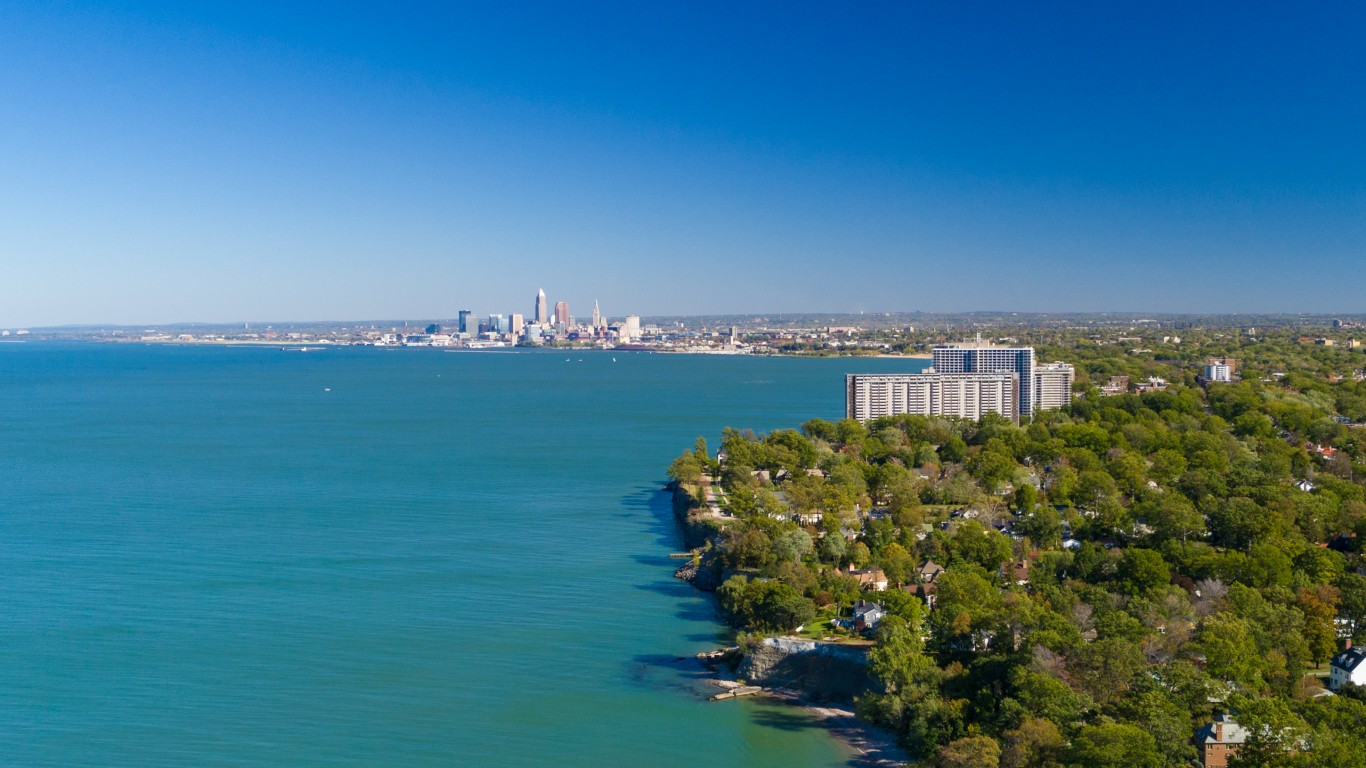
41. Ohio
> Annual drowning deaths, 2015-2019: 0.96 per 100,000
> Total drowning deaths, 2015-2019: 562

40. Virginia
> Annual drowning deaths, 2015-2019: 0.96 per 100,000
> Total drowning deaths, 2015-2019: 429
[in-text-ad]

39. Minnesota
> Annual drowning deaths, 2015-2019: 1.00 per 100,000
> Total drowning deaths, 2015-2019: 288
38. Iowa
> Annual drowning deaths, 2015-2019: 1.01 per 100,000
> Total drowning deaths, 2015-2019: 162
37. Rhode Island
> Annual drowning deaths, 2015-2019: 1.04 per 100,000
> Total drowning deaths, 2015-2019: 55
[in-text-ad-2]
36. North Carolina
> Annual drowning deaths, 2015-2019: 1.05 per 100,000
> Total drowning deaths, 2015-2019: 547
35. California
> Annual drowning deaths, 2015-2019: 1.08 per 100,000
> Total drowning deaths, 2015-2019: 2,181
[in-text-ad]
34. New Hampshire
> Annual drowning deaths, 2015-2019: 1.08 per 100,000
> Total drowning deaths, 2015-2019: 79

33. Kansas
> Annual drowning deaths, 2015-2019: 1.09 per 100,000
> Total drowning deaths, 2015-2019: 161

32. Michigan
> Annual drowning deaths, 2015-2019: 1.10 per 100,000
> Total drowning deaths, 2015-2019: 580
[in-text-ad-2]

31. Utah
> Annual drowning deaths, 2015-2019: 1.12 per 100,000
> Total drowning deaths, 2015-2019: 169
30. Indiana
> Annual drowning deaths, 2015-2019: 1.13 per 100,000
> Total drowning deaths, 2015-2019: 369
[in-text-ad]
29. Wisconsin
> Annual drowning deaths, 2015-2019: 1.13 per 100,000
> Total drowning deaths, 2015-2019: 331
28. North Dakota
> Annual drowning deaths, 2015-2019: 1.19 per 100,000
> Total drowning deaths, 2015-2019: 48

27. Nevada
> Annual drowning deaths, 2015-2019: 1.25 per 100,000
> Total drowning deaths, 2015-2019: 189
[in-text-ad-2]
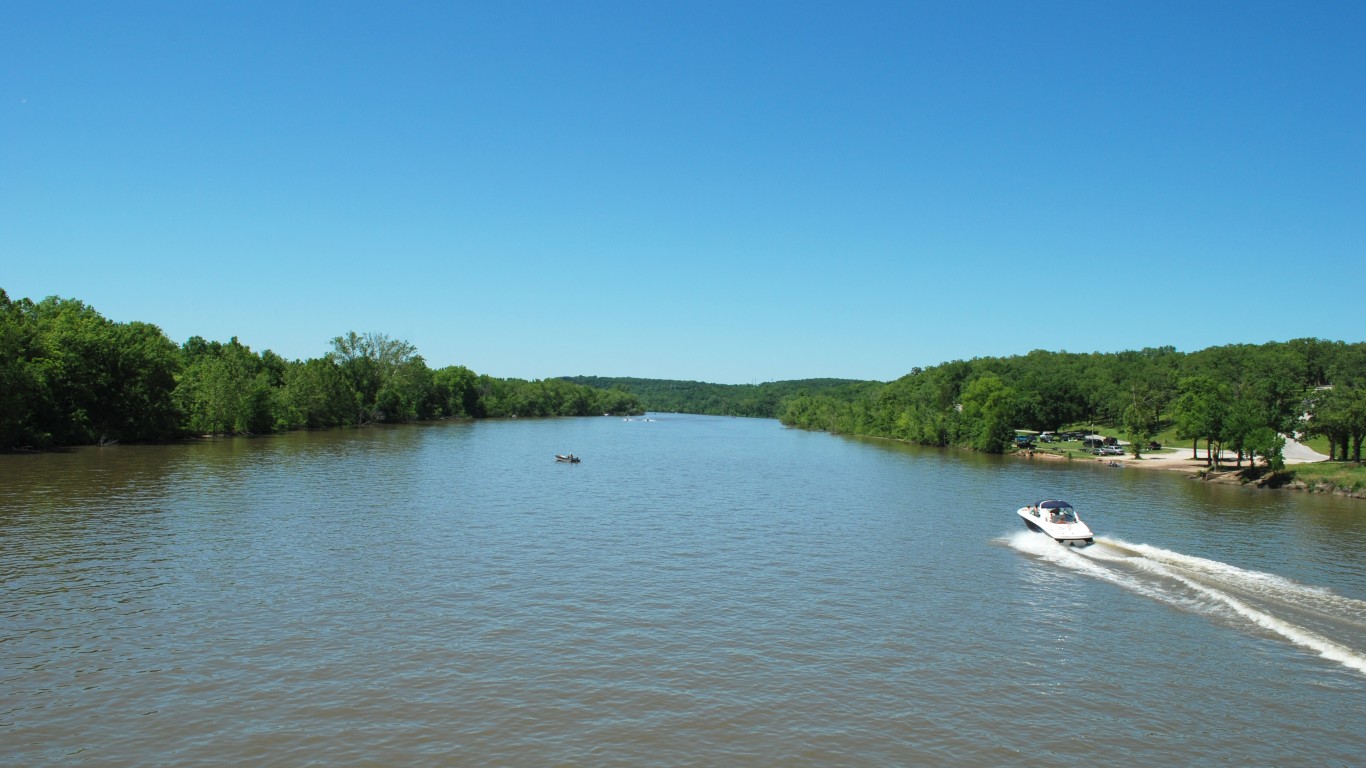
26. Missouri
> Annual drowning deaths, 2015-2019: 1.31 per 100,000
> Total drowning deaths, 2015-2019: 395
25. Colorado
> Annual drowning deaths, 2015-2019: 1.33 per 100,000
> Total drowning deaths, 2015-2019: 381
[in-text-ad]
24. South Dakota
> Annual drowning deaths, 2015-2019: 1.33 per 100,000
> Total drowning deaths, 2015-2019: 56
23. Tennessee
> Annual drowning deaths, 2015-2019: 1.33 per 100,000
> Total drowning deaths, 2015-2019: 450
22. Vermont
> Annual drowning deaths, 2015-2019: 1.36 per 100,000
> Total drowning deaths, 2015-2019: 41
[in-text-ad-2]

21. Texas
> Annual drowning deaths, 2015-2019: 1.37 per 100,000
> Total drowning deaths, 2015-2019: 1,956
20. Georgia
> Annual drowning deaths, 2015-2019: 1.39 per 100,000
> Total drowning deaths, 2015-2019: 723
[in-text-ad]
19. West Virginia
> Annual drowning deaths, 2015-2019: 1.41 per 100,000
> Total drowning deaths, 2015-2019: 126
18. Arizona
> Annual drowning deaths, 2015-2019: 1.42 per 100,000
> Total drowning deaths, 2015-2019: 511
17. New Mexico
> Annual drowning deaths, 2015-2019: 1.43 per 100,000
> Total drowning deaths, 2015-2019: 150
[in-text-ad-2]

16. Washington
> Annual drowning deaths, 2015-2019: 1.44 per 100,000
> Total drowning deaths, 2015-2019: 554

15. Kentucky
> Annual drowning deaths, 2015-2019: 1.45 per 100,000
> Total drowning deaths, 2015-2019: 315
[in-text-ad]
14. South Carolina
> Annual drowning deaths, 2015-2019: 1.56 per 100,000
> Total drowning deaths, 2015-2019: 394
13. Alabama
> Annual drowning deaths, 2015-2019: 1.63 per 100,000
> Total drowning deaths, 2015-2019: 404
12. Maine
> Annual drowning deaths, 2015-2019: 1.64 per 100,000
> Total drowning deaths, 2015-2019: 112
[in-text-ad-2]

11. Oregon
> Annual drowning deaths, 2015-2019: 1.64 per 100,000
> Total drowning deaths, 2015-2019: 344
10. Montana
> Annual drowning deaths, 2015-2019: 1.66 per 100,000
> Total drowning deaths, 2015-2019: 88
[in-text-ad]

9. Idaho
> Annual drowning deaths, 2015-2019: 1.74 per 100,000
> Total drowning deaths, 2015-2019: 148
8. Arkansas
> Annual drowning deaths, 2015-2019: 1.78 per 100,000
> Total drowning deaths, 2015-2019: 262

7. Oklahoma
> Annual drowning deaths, 2015-2019: 1.82 per 100,000
> Total drowning deaths, 2015-2019: 363
[in-text-ad-2]
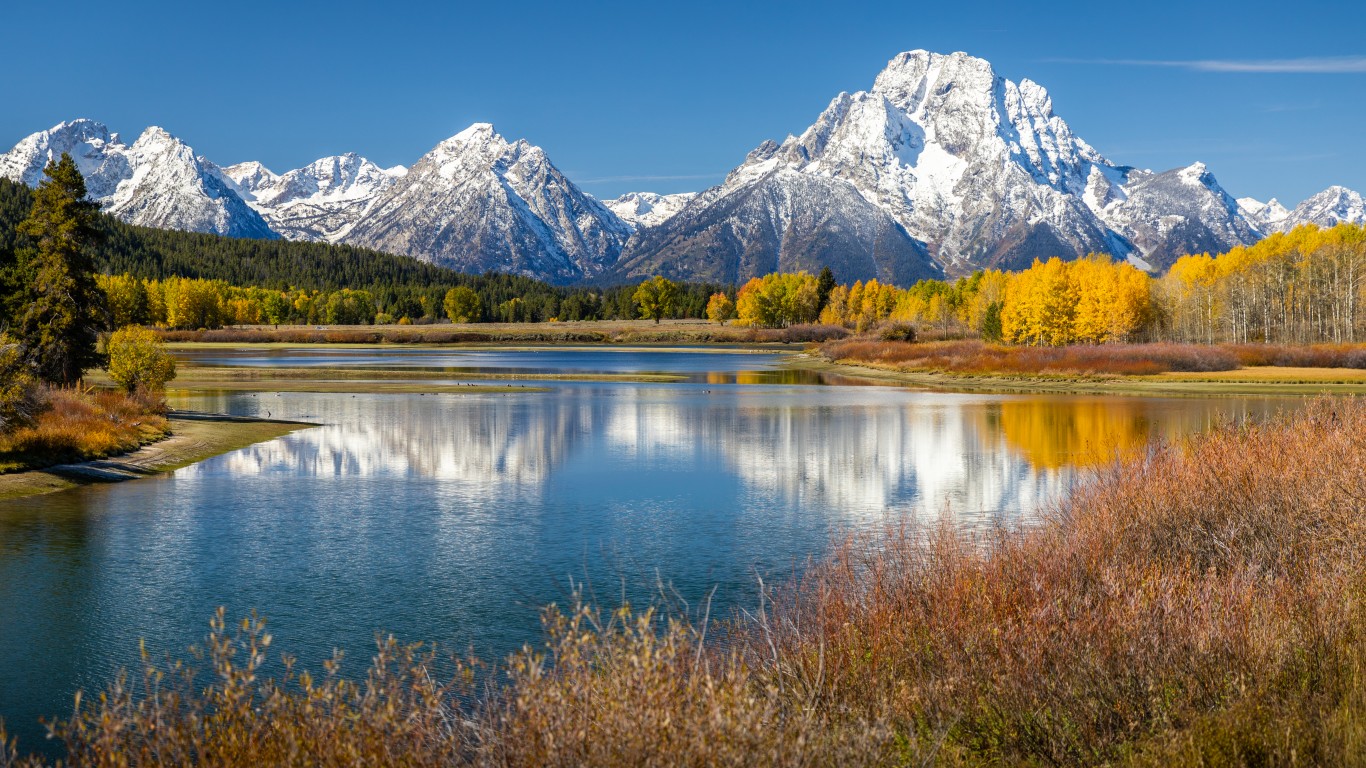
6. Wyoming
> Annual drowning deaths, 2015-2019: 1.85 per 100,000
> Total drowning deaths, 2015-2019: 54
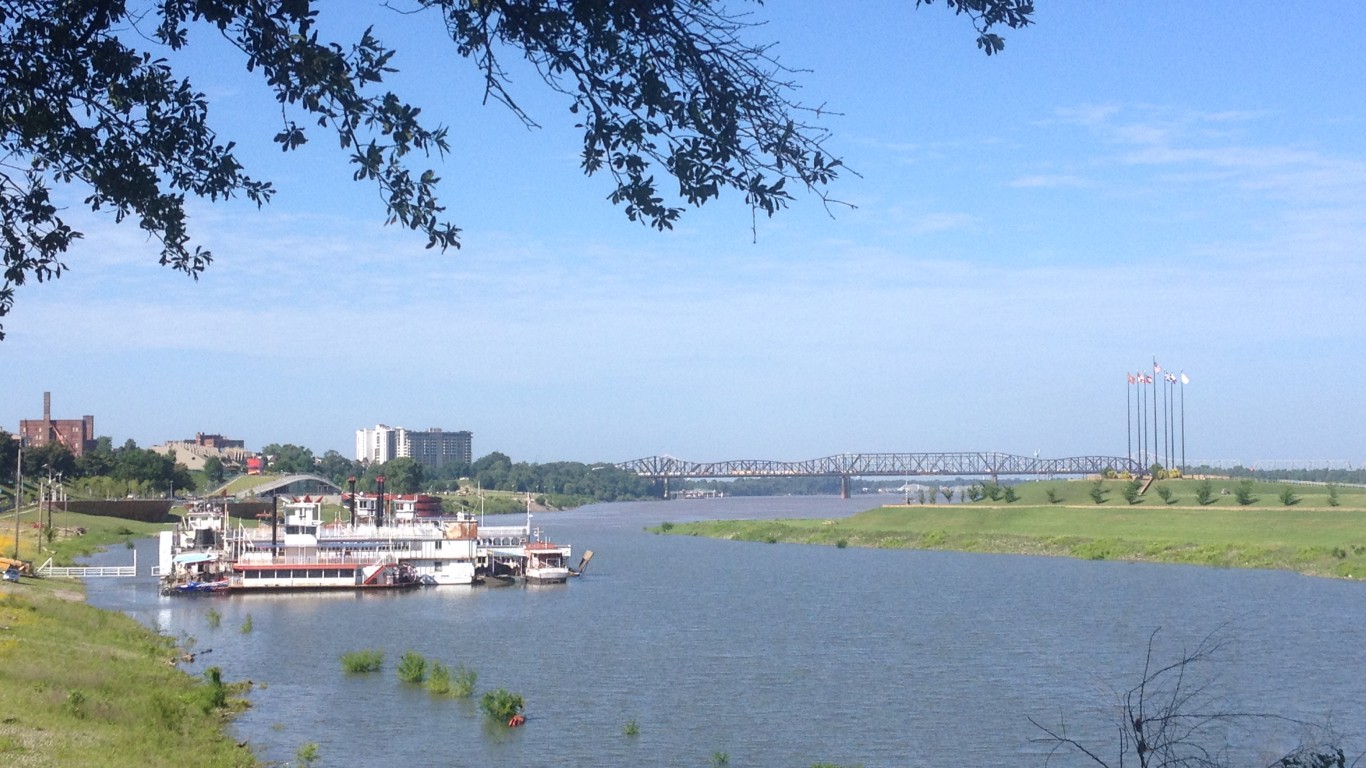
5. Mississippi
> Annual drowning deaths, 2015-2019: 1.88 per 100,000
> Total drowning deaths, 2015-2019: 278
[in-text-ad]

4. Florida
> Annual drowning deaths, 2015-2019: 2.01 per 100,000
> Total drowning deaths, 2015-2019: 2,197

3. Louisiana
> Annual drowning deaths, 2015-2019: 2.20 per 100,000
> Total drowning deaths, 2015-2019: 522
2. Hawaii
> Annual drowning deaths, 2015-2019: 2.90 per 100,000
> Total drowning deaths, 2015-2019: 224
[in-text-ad-2]
1. Alaska
> Annual drowning deaths, 2015-2019: 4.97 per 100,000
> Total drowning deaths, 2015-2019: 184
Thank you for reading! Have some feedback for us?
Contact the 24/7 Wall St. editorial team.


 24/7 Wall St.





 24/7 Wall St.

 24/7 Wall St.


