
The U.S. housing market has cooled considerably in recent months. Precipitated in part by rising mortgage rates, existing home sales totaled just 4.28 million in April 2023, down 23% from the same period last year, according to the National Realtors Association. Still, the nationwide cooling, a number of American cities are breaking from the broader trend. In these places, most homes are sold within only a few weeks, as demand among homebuyers is surging.
Using data from Realtor.com, a real estate market website, 24/7 Wall St. identified America’s 30 hottest housing markets. Metro areas are ranked by their Market Hotness Index score, a proprietary measure from Realtor.com that takes into account how long homes are on the market for as well as several measures of supply and demand dynamics. All data is for April 2023.
The vast majority of the metro areas on this list are in the Midwest and the Northeast, including four in Wisconsin alone and 12 in the New England region.
As might be expected, because of the rising demand in these places, home prices are also on the rise. Two-thirds of the metro areas on this list have reported a month-over-month increase in median list price, and in all but one, the typical list price is higher now than it was a year ago. (These are the cities where the cost of housing has skyrocketed.)
Despite the rising prices in these places, in many the housing is still relatively affordable, which may be contributing to the increase in demand. According to calculations provided by Realtor.com, the median list price in 21 of the 30 hottest metro areas is lower than the national median by anywhere from about 2% to over 60%. (Here is a look at the cities where people need the smallest downpayments to buy their home.)
Click here to see America’s hottest housing markets.
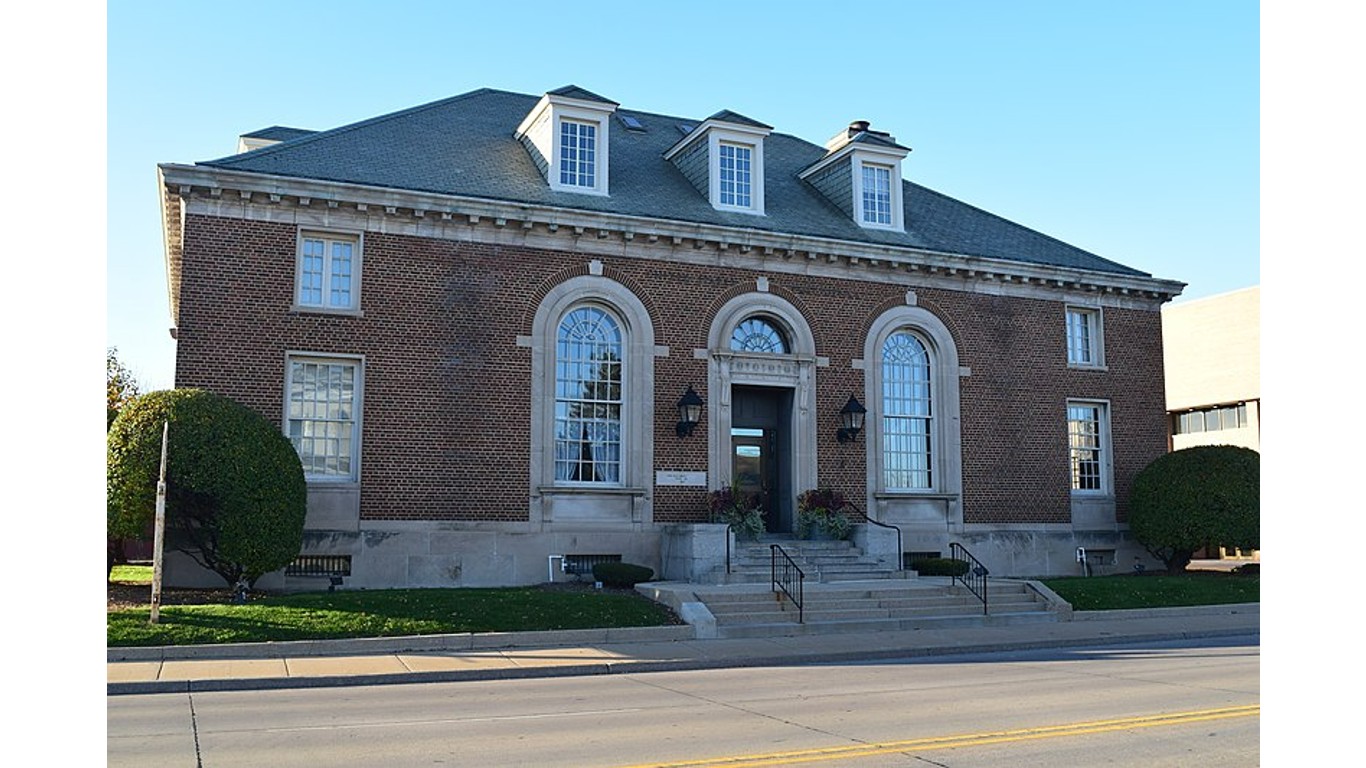
30. Oshkosh-Neenah, WI
> Hotness index score: 84.8 out of 100
> Time a house typically spends on the market: 36.5 days
> Median list price: $299,950 (31.8% less than national avg.)
> Change in median list price: -9.7% month-over-month; +2.1% year-over-year
> Total homes on the market: 311
[in-text-ad]
28. La Crosse-Onalaska, WI-MN — tied
> Hotness index score: 85.1 out of 100
> Time a house typically spends on the market: 31 days
> Median list price: $339,900 (22.7% less than national avg.)
> Change in median list price: -5.6% month-over-month; +3.2% year-over-year
> Total homes on the market: 289

28. Milwaukee-Waukesha, WI — tied
> Hotness index score: 85.1 out of 100
> Time a house typically spends on the market: 29 days
> Median list price: $374,900 (14.8% less than national avg.)
> Change in median list price: +2.7% month-over-month; +16.3% year-over-year
> Total homes on the market: 2,774

27. Peoria, IL
> Hotness index score: 85.3 out of 100
> Time a house typically spends on the market: 33 days
> Median list price: $159,900 (63.7% less than national avg.)
> Change in median list price: +6.7% month-over-month; +16.8% year-over-year
> Total homes on the market: 949
[in-text-ad-2]
26. Providence-Warwick, RI-MA
> Hotness index score: 85.6 out of 100
> Time a house typically spends on the market: 33 days
> Median list price: $525,000 (19.3% more than national avg.)
> Change in median list price: -0.9% month-over-month; +11.1% year-over-year
> Total homes on the market: 2,843

25. Toledo, OH
> Hotness index score: 86.1 out of 100
> Time a house typically spends on the market: 31 days
> Median list price: $225,000 (48.9% less than national avg.)
> Change in median list price: +4.7% month-over-month; +22.0% year-over-year
> Total homes on the market: 1,494
[in-text-ad]

24. South Bend-Mishawaka, IN-MI
> Hotness index score: 86.5 out of 100
> Time a house typically spends on the market: 28 days
> Median list price: $299,450 (31.9% less than national avg.)
> Change in median list price: -0.2% month-over-month; -1.8% year-over-year
> Total homes on the market: 487
23. Norwich-New London, CT
> Hotness index score: 87.3 out of 100
> Time a house typically spends on the market: 35 days
> Median list price: $499,900 (13.6% more than national avg.)
> Change in median list price: +0.1% month-over-month; +25.0% year-over-year
> Total homes on the market: 705

22. Jefferson City, MO
> Hotness index score: 87.5 out of 100
> Time a house typically spends on the market: 30 days
> Median list price: $289,900 (34.1% less than national avg.)
> Change in median list price: +4.7% month-over-month; +26.1% year-over-year
> Total homes on the market: 277
[in-text-ad-2]
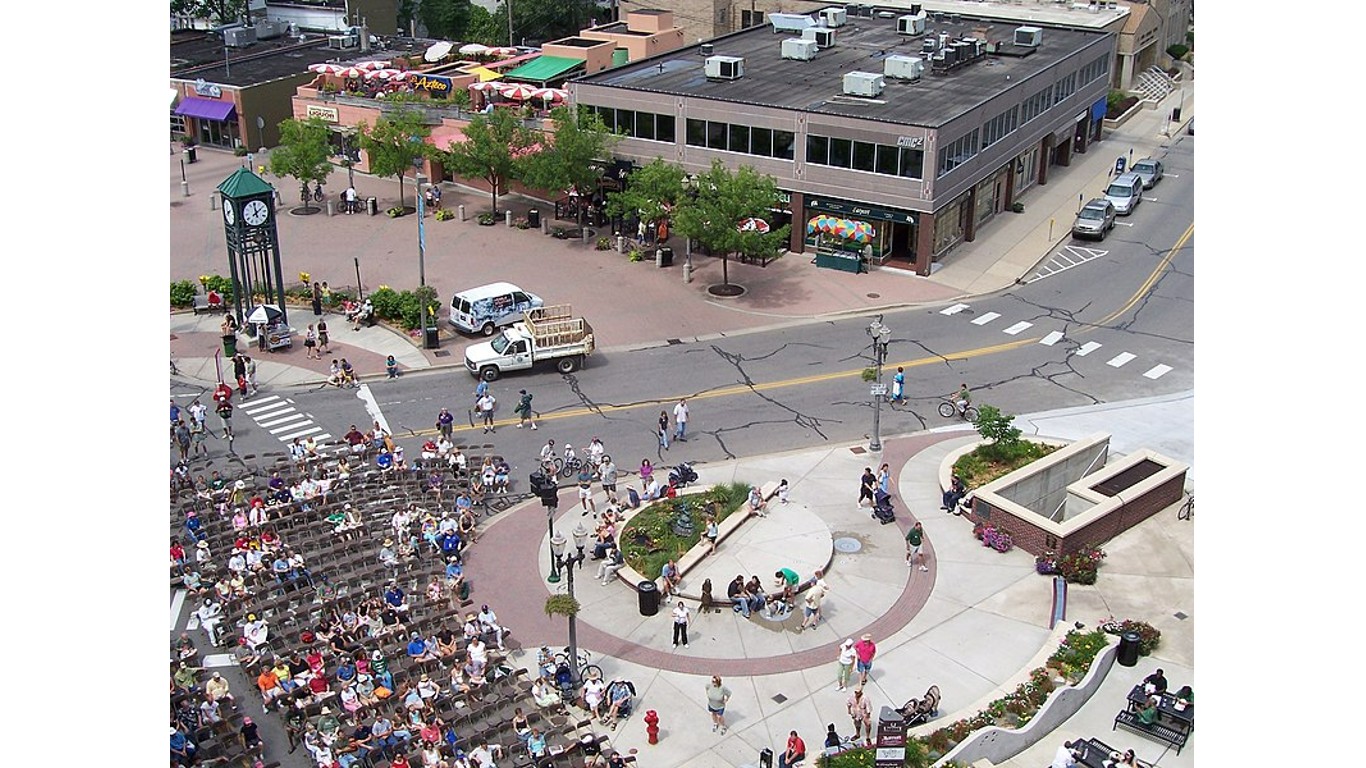
21. Lansing-East Lansing, MI
> Hotness index score: 87.5 out of 100
> Time a house typically spends on the market: 29 days
> Median list price: $219,900 (50.0% less than national avg.)
> Change in median list price: -4.3% month-over-month; +10.3% year-over-year
> Total homes on the market: 978

20. Bridgeport-Stamford-Norwalk, CT
> Hotness index score: 89.6 out of 100
> Time a house typically spends on the market: 31 days
> Median list price: $1,100,000 (150.1% more than national avg.)
> Change in median list price: -5.1% month-over-month; +30.3% year-over-year
> Total homes on the market: 2,702
[in-text-ad]

19. Johnson City, TN
> Hotness index score: 90.1 out of 100
> Time a house typically spends on the market: 33 days
> Median list price: $429,450 (2.4% less than national avg.)
> Change in median list price: +4.7% month-over-month; +22.7% year-over-year
> Total homes on the market: 488

18. Dayton-Kettering, OH
> Hotness index score: 90.3 out of 100
> Time a house typically spends on the market: 30 days
> Median list price: $230,000 (47.7% less than national avg.)
> Change in median list price: -4.2% month-over-month; +12.2% year-over-year
> Total homes on the market: 1,841

16. Allentown-Bethlehem-Easton, PA-NJ — tied
> Hotness index score: 90.3 out of 100
> Time a house typically spends on the market: 28 days
> Median list price: $383,500 (12.8% less than national avg.)
> Change in median list price: +1.2% month-over-month; +9.6% year-over-year
> Total homes on the market: 1,240
[in-text-ad-2]

16. Appleton, WI — tied
> Hotness index score: 90.3 out of 100
> Time a house typically spends on the market: 32 days
> Median list price: $392,500 (10.8% less than national avg.)
> Change in median list price: -0.8% month-over-month; +10.7% year-over-year
> Total homes on the market: 406

15. Fort Wayne, IN
> Hotness index score: 90.5 out of 100
> Time a house typically spends on the market: 29 days
> Median list price: $347,450 (21.0% less than national avg.)
> Change in median list price: +1.0% month-over-month; +23.0% year-over-year
> Total homes on the market: 451
[in-text-ad]

14. Boston-Cambridge-Newton, MA-NH
> Hotness index score: 90.6 out of 100
> Time a house typically spends on the market: 23 days
> Median list price: $849,948 (93.2% more than national avg.)
> Change in median list price: +1.3% month-over-month; +12.2% year-over-year
> Total homes on the market: 5,196

13. Burlington-South Burlington, VT
> Hotness index score: 92.1 out of 100
> Time a house typically spends on the market: 30 days
> Median list price: $483,125 (9.8% more than national avg.)
> Change in median list price: +2.3% month-over-month; +10.3% year-over-year
> Total homes on the market: 233

12. Rockford, IL
> Hotness index score: 93.1 out of 100
> Time a house typically spends on the market: 29 days
> Median list price: $212,900 (51.6% less than national avg.)
> Change in median list price: +18.3% month-over-month; +19.3% year-over-year
> Total homes on the market: 645
[in-text-ad-2]

11. Eau Claire, WI
> Hotness index score: 95.5 out of 100
> Time a house typically spends on the market: 24 days
> Median list price: $375,000 (14.8% less than national avg.)
> Change in median list price: +8.1% month-over-month; +12.5% year-over-year
> Total homes on the market: 314

10. Portland-South Portland, ME
> Hotness index score: 95.8 out of 100
> Time a house typically spends on the market: 29 days
> Median list price: $620,000 (40.9% more than national avg.)
> Change in median list price: -1.4% month-over-month; +16.4% year-over-year
> Total homes on the market: 793
[in-text-ad]
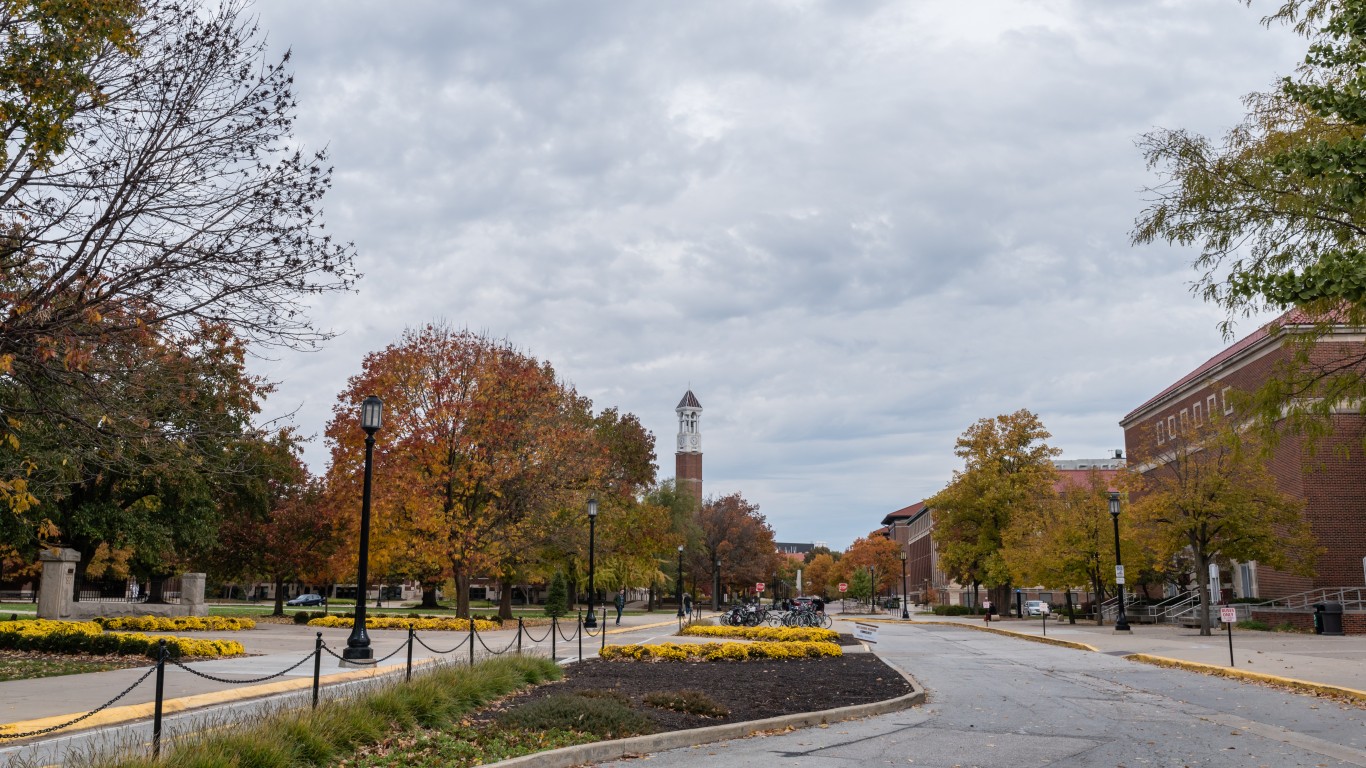
9. Lafayette-West Lafayette, IN
> Hotness index score: 96.0 out of 100
> Time a house typically spends on the market: 19 days
> Median list price: $367,900 (16.4% less than national avg.)
> Change in median list price: +11.8% month-over-month; +26.9% year-over-year
> Total homes on the market: 151

8. New Haven-Milford, CT
> Hotness index score: 96.7 out of 100
> Time a house typically spends on the market: 26 days
> Median list price: $429,900 (2.3% less than national avg.)
> Change in median list price: +7.5% month-over-month; +20.3% year-over-year
> Total homes on the market: 1,939

7. Worcester, MA-CT
> Hotness index score: 97.0 out of 100
> Time a house typically spends on the market: 19 days
> Median list price: $515,000 (17.1% more than national avg.)
> Change in median list price: +2.0% month-over-month; +9.7% year-over-year
> Total homes on the market: 991
[in-text-ad-2]

6. Columbus, OH
> Hotness index score: 97.3 out of 100
> Time a house typically spends on the market: 22 days
> Median list price: $388,900 (11.6% less than national avg.)
> Change in median list price: +1.0% month-over-month; +11.4% year-over-year
> Total homes on the market: 3,466

5. Springfield, MA
> Hotness index score: 97.8 out of 100
> Time a house typically spends on the market: 22 days
> Median list price: $377,450 (14.2% less than national avg.)
> Change in median list price: +2.3% month-over-month; +6.8% year-over-year
> Total homes on the market: 580
[in-text-ad]

3. Rochester, NY — tied
> Hotness index score: 99.0 out of 100
> Time a house typically spends on the market: 16 days
> Median list price: $264,900 (39.8% less than national avg.)
> Change in median list price: +0.0% month-over-month; +19.1% year-over-year
> Total homes on the market: 852

3. Concord, NH — tied
> Hotness index score: 99.0 out of 100
> Time a house typically spends on the market: 20 days
> Median list price: $547,400 (24.4% more than national avg.)
> Change in median list price: +4.8% month-over-month; +21.7% year-over-year
> Total homes on the market: 165

2. Hartford-East Hartford-Middletown, CT
> Hotness index score: 99.2 out of 100
> Time a house typically spends on the market: 21.5 days
> Median list price: $419,950 (4.5% less than national avg.)
> Change in median list price: +5.0% month-over-month; +15.9% year-over-year
> Total homes on the market: 2,457
[in-text-ad-2]

1. Manchester-Nashua, NH
> Hotness index score: 99.8 out of 100
> Time a house typically spends on the market: 12 days
> Median list price: $541,950 (23.2% more than national avg.)
> Change in median list price: +1.8% month-over-month; +21.9% year-over-year
> Total homes on the market: 451
Thank you for reading! Have some feedback for us?
Contact the 24/7 Wall St. editorial team.
 24/7 Wall St.
 24/7 Wall St.
 24/7 Wall St.