
Since 2010, the odds of dying young in the United States have risen at an alarming pace. According to figures from the U.S. Social Security Administration’s actuarial life tables, the odds of succumbing between the ages of 15 and 24 in America rose from 0.067% in 2010 to 0.083% in 2020. While those numbers may seem small, the difference amounts to an additional thousands of young Americans dying every year, giving the U.S. a youth mortality rate twice as high as that in France, Germany, Japan, and many other wealthy nations. (These are 24 states where deaths are outpacing births.)
The rise in youth mortality is highly concentrated in the South and Midwest, and affects impoverished communities with limited economic opportunity the most.
To determine the places where young Americans are dying at an alarming rate, 24/7 Tempo reviewed data on mortality rate by age from the Centers for Disease Control & Prevention. Counties and county equivalents were ranked based on the raw change in the crude death rate among residents aged15 to 24 from 2010 to 2020. All mortality data is from the CDC and is three-year data. Data on population came from the U.S. Census Bureau’s 2021 American Community Survey and is five-year data.
While COVID-19 is responsible for a bulk of the recent decline in U.S. life expectancy at birth for all ages – from 78.8 years in 2019 to 76.1 years in 2021 – the primary causes of rising mortality among young Americans are external. The drug overdose death rate, for example, rose by 4.7 deaths per 100,000 Americans aged 15 to 24 from 2010 to 2020, while the suicide rate rose by 4.1 deaths per 100,000 and the homicide rate rose by 1.0 deaths per 100,000.
Death rates among young Americans are rising the fastest in the South and Midwest, where poverty and violent crime are more prevalent. Of the 40 counties or county equivalents where youth mortality is rising the fastest, 26 are in the South, and eight are in the Midwest. While most are rural areas, a few counties that are home to major cities – Indianapolis, St. Louis, Louisville, and Memphis – make the list. In urban counties like these, the primary driver of rising youth mortality rates is an increase in homicide. (Considering young and old together, these are the 15 leading causes of death in America.)
Click here to see the places where young Americans are dying at an alarming rate
Research into rising youth mortality rates has identified a link between parental education, poverty, and early mortality. In 32 of the 40 counties where youth mortality is rising the fastest, the poverty rate is higher than the 12.6% national rate, while in 36 of them, the college attainment rate for adults 25 and over is lower than the 33.7% national figure.

40. St. Louis County, Missouri
> Change in youth mortality (age 15-24), 2010 to 2020: +47.1 deaths per 100,000
> Youth mortality rate (age 15-24), 2020: 131.4 deaths per 100,000
> Youth mortality rate (age 15-24), 2010: 84.3 deaths per 100,000
> Total population: 1,001,982
> County seat: Clayton
[in-text-ad]

39. Coffee County, Alabama
> Change in youth mortality (age 15-24), 2010 to 2020: +48.2 deaths per 100,000
> Youth mortality rate (age 15-24), 2020: 147.1 deaths per 100,000
> Youth mortality rate (age 15-24), 2010: 98.9 deaths per 100,000
> Total population: 53,043
> County seat: Elba
38. Sullivan County, New York
> Change in youth mortality (age 15-24), 2010 to 2020: +48.2 deaths per 100,000
> Youth mortality rate (age 15-24), 2020: 121.8 deaths per 100,000
> Youth mortality rate (age 15-24), 2010: 73.6 deaths per 100,000
> Total population: 78,230
> County seat: Monticello

37. Linn County, Iowa
> Change in youth mortality (age 15-24), 2010 to 2020: +48.3 deaths per 100,000
> Youth mortality rate (age 15-24), 2020: 82.5 deaths per 100,000
> Youth mortality rate (age 15-24), 2010: 34.3 deaths per 100,000
> Total population: 228,567
> County seat: Cedar Rapids
[in-text-ad-2]
36. Beltrami County, Minnesota
> Change in youth mortality (age 15-24), 2010 to 2020: +48.3 deaths per 100,000
> Youth mortality rate (age 15-24), 2020: 121.3 deaths per 100,000
> Youth mortality rate (age 15-24), 2010: 72.9 deaths per 100,000
> Total population: 46,033
> County seat: Bemidji
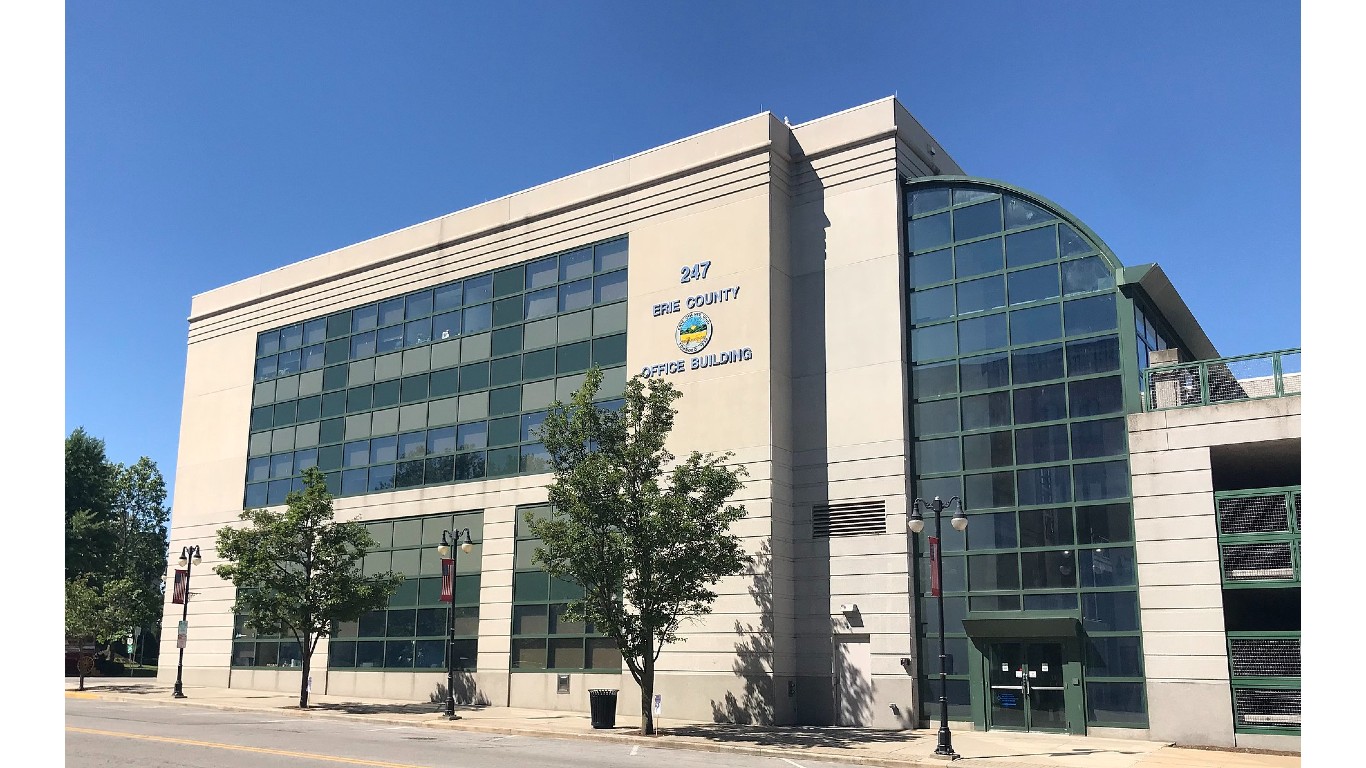
35. Erie County, Ohio
> Change in youth mortality (age 15-24), 2010 to 2020: +48.8 deaths per 100,000
> Youth mortality rate (age 15-24), 2020: 117.9 deaths per 100,000
> Youth mortality rate (age 15-24), 2010: 69.0 deaths per 100,000
> Total population: 75,560
> County seat: Sandusky
[in-text-ad]

34. Curry County, New Mexico
> Change in youth mortality (age 15-24), 2010 to 2020: +49.1 deaths per 100,000
> Youth mortality rate (age 15-24), 2020: 118.2 deaths per 100,000
> Youth mortality rate (age 15-24), 2010: 69.1 deaths per 100,000
> Total population: 48,716
> County seat: Clovis

33. Jefferson County, Kentucky
> Change in youth mortality (age 15-24), 2010 to 2020: +50.7 deaths per 100,000
> Youth mortality rate (age 15-24), 2020: 133.3 deaths per 100,000
> Youth mortality rate (age 15-24), 2010: 82.6 deaths per 100,000
> Total population: 780,449
> County seat: Louisville
32. Hardin County, Texas
> Change in youth mortality (age 15-24), 2010 to 2020: +52.5 deaths per 100,000
> Youth mortality rate (age 15-24), 2020: 172.7 deaths per 100,000
> Youth mortality rate (age 15-24), 2010: 120.2 deaths per 100,000
> Total population: 56,124
> County seat: Kountze
[in-text-ad-2]

31. Marion County, Indiana
> Change in youth mortality (age 15-24), 2010 to 2020: +52.8 deaths per 100,000
> Youth mortality rate (age 15-24), 2020: 145.7 deaths per 100,000
> Youth mortality rate (age 15-24), 2010: 92.9 deaths per 100,000
> Total population: 969,542
> County seat: Indianapolis

30. Muskingum County, Ohio
> Change in youth mortality (age 15-24), 2010 to 2020: +53.2 deaths per 100,000
> Youth mortality rate (age 15-24), 2020: 124.9 deaths per 100,000
> Youth mortality rate (age 15-24), 2010: 71.7 deaths per 100,000
> Total population: 86,346
> County seat: Zanesville
[in-text-ad]

29. Hinds County, Mississippi
> Change in youth mortality (age 15-24), 2010 to 2020: +53.6 deaths per 100,000
> Youth mortality rate (age 15-24), 2020: 156.5 deaths per 100,000
> Youth mortality rate (age 15-24), 2010: 102.9 deaths per 100,000
> Total population: 230,772
> County seat: Jackson
28. Linn County, Oregon
> Change in youth mortality (age 15-24), 2010 to 2020: +54.7 deaths per 100,000
> Youth mortality rate (age 15-24), 2020: 100.5 deaths per 100,000
> Youth mortality rate (age 15-24), 2010: 45.8 deaths per 100,000
> Total population: 127,200
> County seat: Albany
27. St. Landry Parish, Louisiana
> Change in youth mortality (age 15-24), 2010 to 2020: +55.3 deaths per 100,000
> Youth mortality rate (age 15-24), 2020: 160.7 deaths per 100,000
> Youth mortality rate (age 15-24), 2010: 105.5 deaths per 100,000
> Total population: 82,999
> County seat: Opelousas
[in-text-ad-2]
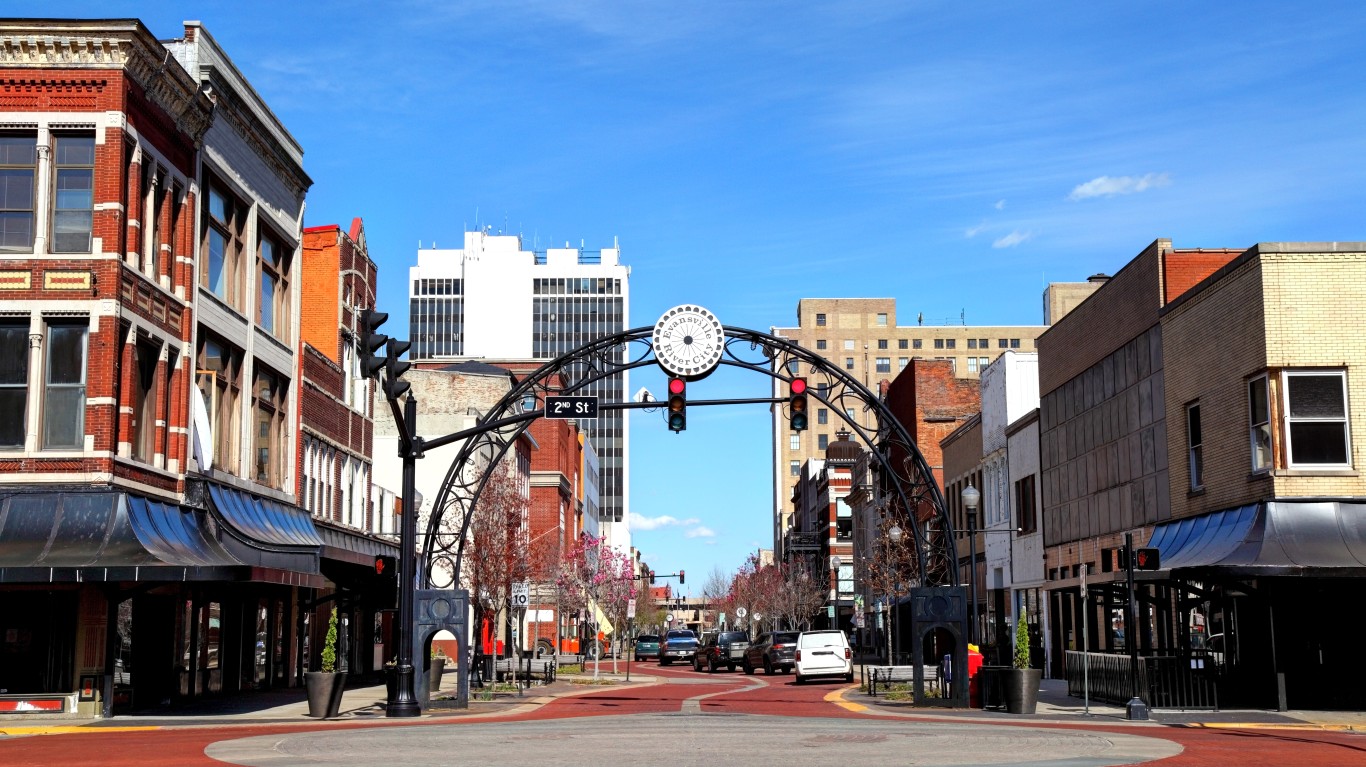
26. Vanderburgh County, Indiana
> Change in youth mortality (age 15-24), 2010 to 2020: +56.5 deaths per 100,000
> Youth mortality rate (age 15-24), 2020: 98.8 deaths per 100,000
> Youth mortality rate (age 15-24), 2010: 42.3 deaths per 100,000
> Total population: 179,695
> County seat: Evansville

25. Crittenden County, Arkansas
> Change in youth mortality (age 15-24), 2010 to 2020: +57.9 deaths per 100,000
> Youth mortality rate (age 15-24), 2020: 155.2 deaths per 100,000
> Youth mortality rate (age 15-24), 2010: 97.3 deaths per 100,000
> Total population: 48,338
> County seat: Marion
[in-text-ad]

24. Elko County, Nevada
> Change in youth mortality (age 15-24), 2010 to 2020: +58.2 deaths per 100,000
> Youth mortality rate (age 15-24), 2020: 148.2 deaths per 100,000
> Youth mortality rate (age 15-24), 2010: 90.0 deaths per 100,000
> Total population: 53,420
> County seat: Elko
23. Horry County, South Carolina
> Change in youth mortality (age 15-24), 2010 to 2020: +58.3 deaths per 100,000
> Youth mortality rate (age 15-24), 2020: 124.0 deaths per 100,000
> Youth mortality rate (age 15-24), 2010: 65.7 deaths per 100,000
> Total population: 344,865
> County seat: Conway

22. Colleton County, South Carolina
> Change in youth mortality (age 15-24), 2010 to 2020: +58.8 deaths per 100,000
> Youth mortality rate (age 15-24), 2020: 219.9 deaths per 100,000
> Youth mortality rate (age 15-24), 2010: 161.1 deaths per 100,000
> Total population: 38,520
> County seat: Walterboro
[in-text-ad-2]
21. Bryan County, Oklahoma
> Change in youth mortality (age 15-24), 2010 to 2020: +59.5 deaths per 100,000
> Youth mortality rate (age 15-24), 2020: 136.5 deaths per 100,000
> Youth mortality rate (age 15-24), 2010: 77.0 deaths per 100,000
> Total population: 45,809
> County seat: Durant

20. Lamar County, Mississippi
> Change in youth mortality (age 15-24), 2010 to 2020: +60.1 deaths per 100,000
> Youth mortality rate (age 15-24), 2020: 114.7 deaths per 100,000
> Youth mortality rate (age 15-24), 2010: 54.6 deaths per 100,000
> Total population: 63,610
> County seat: Purvis
[in-text-ad]

19. Tipton County, Tennessee
> Change in youth mortality (age 15-24), 2010 to 2020: +60.6 deaths per 100,000
> Youth mortality rate (age 15-24), 2020: 152.0 deaths per 100,000
> Youth mortality rate (age 15-24), 2010: 91.4 deaths per 100,000
> Total population: 60,868
> County seat: Covington
18. Madison County, Tennessee
> Change in youth mortality (age 15-24), 2010 to 2020: +60.8 deaths per 100,000
> Youth mortality rate (age 15-24), 2020: 120.3 deaths per 100,000
> Youth mortality rate (age 15-24), 2010: 59.5 deaths per 100,000
> Total population: 98,373
> County seat: Jackson

17. Georgetown County, South Carolina
> Change in youth mortality (age 15-24), 2010 to 2020: +61.2 deaths per 100,000
> Youth mortality rate (age 15-24), 2020: 197.5 deaths per 100,000
> Youth mortality rate (age 15-24), 2010: 136.3 deaths per 100,000
> Total population: 62,992
> County seat: Georgetown
[in-text-ad-2]

16. St. Louis city, Missouri
> Change in youth mortality (age 15-24), 2010 to 2020: +61.3 deaths per 100,000
> Youth mortality rate (age 15-24), 2020: 201.4 deaths per 100,000
> Youth mortality rate (age 15-24), 2010: 140.1 deaths per 100,000
> Total population: 302,787
> County seat: St. Louis

15. Harrison County, Texas
> Change in youth mortality (age 15-24), 2010 to 2020: +61.5 deaths per 100,000
> Youth mortality rate (age 15-24), 2020: 146.9 deaths per 100,000
> Youth mortality rate (age 15-24), 2010: 85.4 deaths per 100,000
> Total population: 68,674
> County seat: Marshall
[in-text-ad]
14. Shelby County, Tennessee
> Change in youth mortality (age 15-24), 2010 to 2020: +67.0 deaths per 100,000
> Youth mortality rate (age 15-24), 2020: 157.1 deaths per 100,000
> Youth mortality rate (age 15-24), 2010: 90.1 deaths per 100,000
> Total population: 929,178
> County seat: Memphis

13. Gila County, Arizona
> Change in youth mortality (age 15-24), 2010 to 2020: +69.1 deaths per 100,000
> Youth mortality rate (age 15-24), 2020: 247.9 deaths per 100,000
> Youth mortality rate (age 15-24), 2010: 178.8 deaths per 100,000
> Total population: 53,211
> County seat: Globe

12. Vance County, North Carolina
> Change in youth mortality (age 15-24), 2010 to 2020: +70.8 deaths per 100,000
> Youth mortality rate (age 15-24), 2020: 166.6 deaths per 100,000
> Youth mortality rate (age 15-24), 2010: 95.8 deaths per 100,000
> Total population: 42,650
> County seat: Henderson
[in-text-ad-2]

11. Bethel Census Area, Alaska
> Change in youth mortality (age 15-24), 2010 to 2020: +80.2 deaths per 100,000
> Youth mortality rate (age 15-24), 2020: 334.2 deaths per 100,000
> Youth mortality rate (age 15-24), 2010: 254.0 deaths per 100,000
> Total population: 18,514
> County seat: N/A
10. Mississippi County, Arkansas
> Change in youth mortality (age 15-24), 2010 to 2020: +81.7 deaths per 100,000
> Youth mortality rate (age 15-24), 2020: 226.9 deaths per 100,000
> Youth mortality rate (age 15-24), 2010: 145.2 deaths per 100,000
> Total population: 41,061
> County seat: Blytheville
[in-text-ad]

9. Dallas County, Alabama
> Change in youth mortality (age 15-24), 2010 to 2020: +85.0 deaths per 100,000
> Youth mortality rate (age 15-24), 2020: 188.0 deaths per 100,000
> Youth mortality rate (age 15-24), 2010: 103.0 deaths per 100,000
> Total population: 39,162
> County seat: Selma

8. Carteret County, North Carolina
> Change in youth mortality (age 15-24), 2010 to 2020: +85.7 deaths per 100,000
> Youth mortality rate (age 15-24), 2020: 146.9 deaths per 100,000
> Youth mortality rate (age 15-24), 2010: 61.2 deaths per 100,000
> Total population: 67,944
> County seat: Beaufort

7. Leflore County, Mississippi
> Change in youth mortality (age 15-24), 2010 to 2020: +89.6 deaths per 100,000
> Youth mortality rate (age 15-24), 2020: 200.1 deaths per 100,000
> Youth mortality rate (age 15-24), 2010: 110.5 deaths per 100,000
> Total population: 28,555
> County seat: Greenwood
[in-text-ad-2]
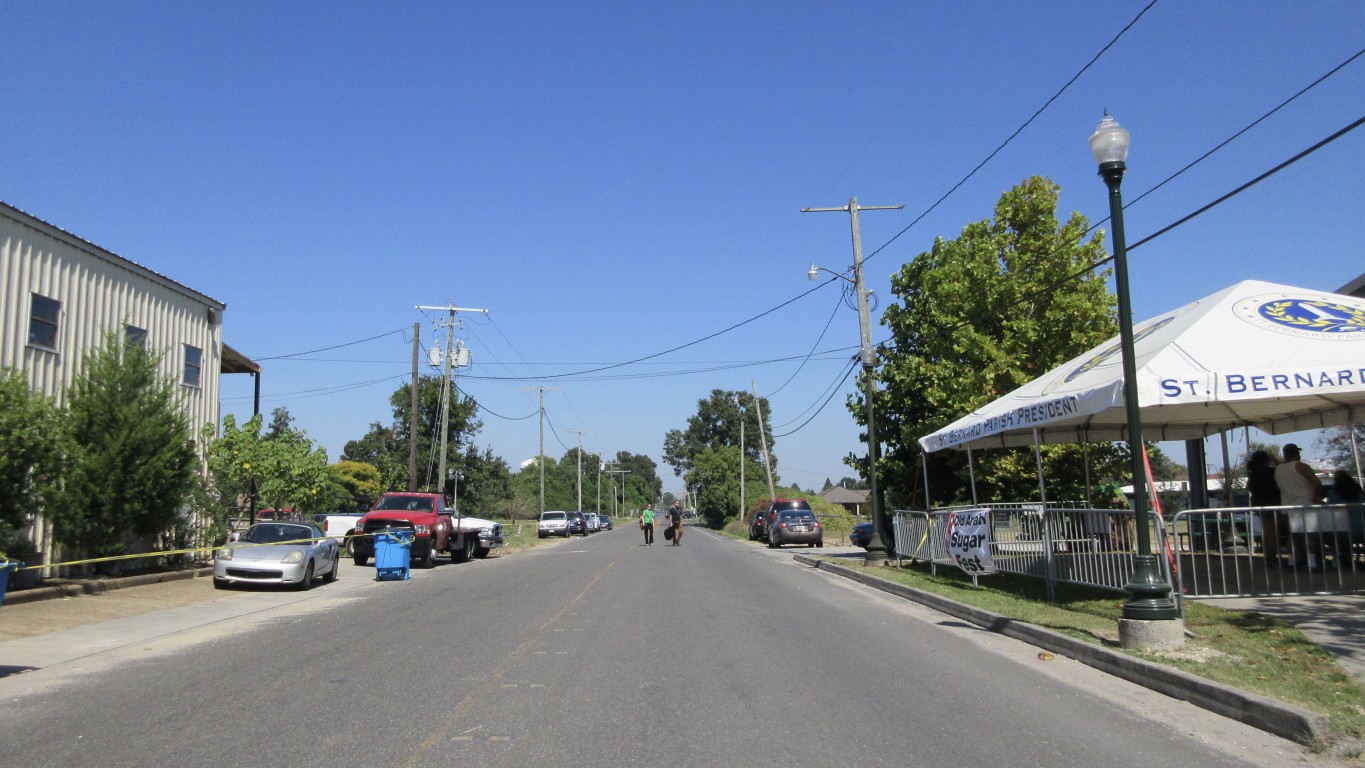
6. St. Bernard Parish, Louisiana
> Change in youth mortality (age 15-24), 2010 to 2020: +92.1 deaths per 100,000
> Youth mortality rate (age 15-24), 2020: 164.3 deaths per 100,000
> Youth mortality rate (age 15-24), 2010: 72.2 deaths per 100,000
> Total population: 43,821
> County seat: Chalmette

5. Garland County, Arkansas
> Change in youth mortality (age 15-24), 2010 to 2020: +94.2 deaths per 100,000
> Youth mortality rate (age 15-24), 2020: 169.8 deaths per 100,000
> Youth mortality rate (age 15-24), 2010: 75.6 deaths per 100,000
> Total population: 99,694
> County seat: Hot Springs
[in-text-ad]

4. Roanoke city, Virginia
> Change in youth mortality (age 15-24), 2010 to 2020: +101.0 deaths per 100,000
> Youth mortality rate (age 15-24), 2020: 162.5 deaths per 100,000
> Youth mortality rate (age 15-24), 2010: 61.5 deaths per 100,000
> Total population: 99,578
> County seat: Roanoke

3. Marshall County, Mississippi
> Change in youth mortality (age 15-24), 2010 to 2020: +109.7 deaths per 100,000
> Youth mortality rate (age 15-24), 2020: 197.5 deaths per 100,000
> Youth mortality rate (age 15-24), 2010: 87.7 deaths per 100,000
> Total population: 34,031
> County seat: Holly Springs

2. Edgecombe County, North Carolina
> Change in youth mortality (age 15-24), 2010 to 2020: +125.0 deaths per 100,000
> Youth mortality rate (age 15-24), 2020: 223.0 deaths per 100,000
> Youth mortality rate (age 15-24), 2010: 98.0 deaths per 100,000
> Total population: 49,609
> County seat: Tarboro
[in-text-ad-2]
1. Dillon County, South Carolina
> Change in youth mortality (age 15-24), 2010 to 2020: +193.9 deaths per 100,000
> Youth mortality rate (age 15-24), 2020: 277.6 deaths per 100,000
> Youth mortality rate (age 15-24), 2010: 83.7 deaths per 100,000
> Total population: 28,527
> County seat: Dillon
Thank you for reading! Have some feedback for us?
Contact the 24/7 Wall St. editorial team.
 24/7 Wall St.





 24/7 Wall St.



 24/7 Wall St.
 24/7 Wall St.